Categories
Developer Tools AI Agents Claude Code OpenTelemetry AI Observability Agent Monitoring LLM Cost TrackingStars
Forks
Watchers
Developer links
ClawMetry
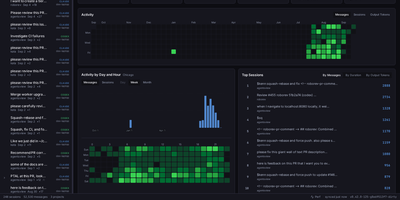
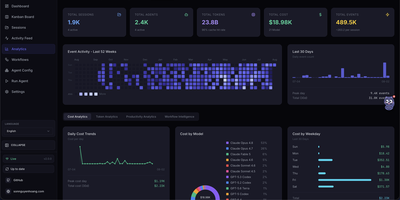
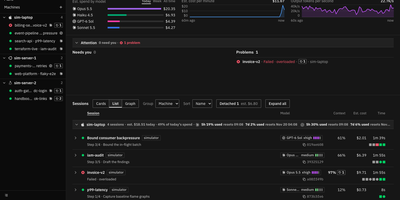
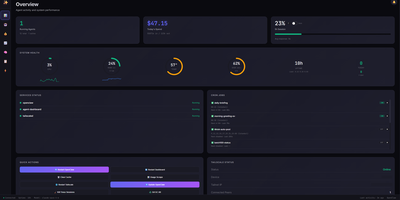
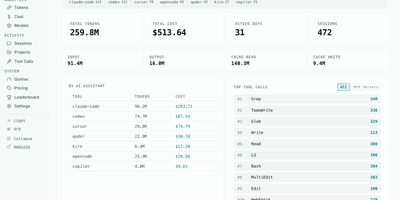
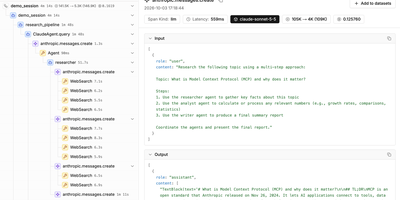
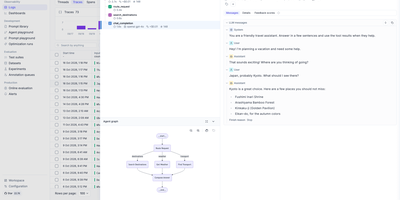
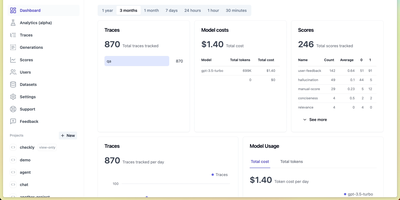
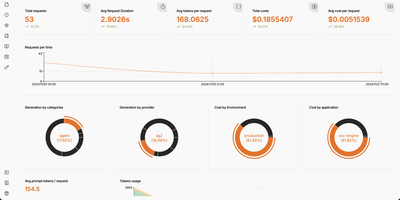
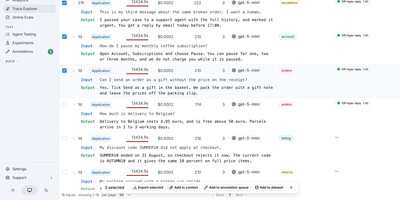
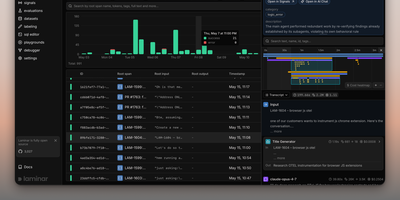
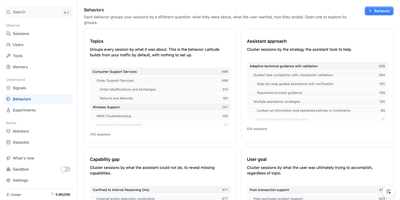
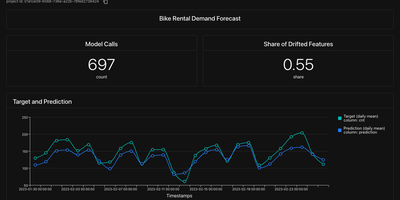
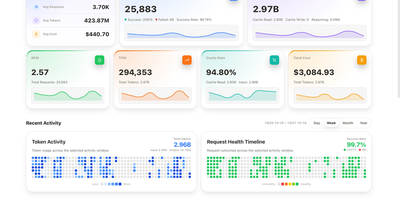
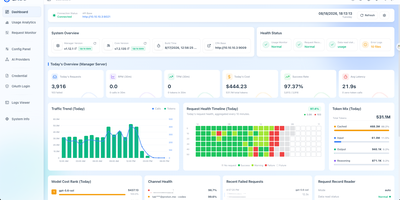
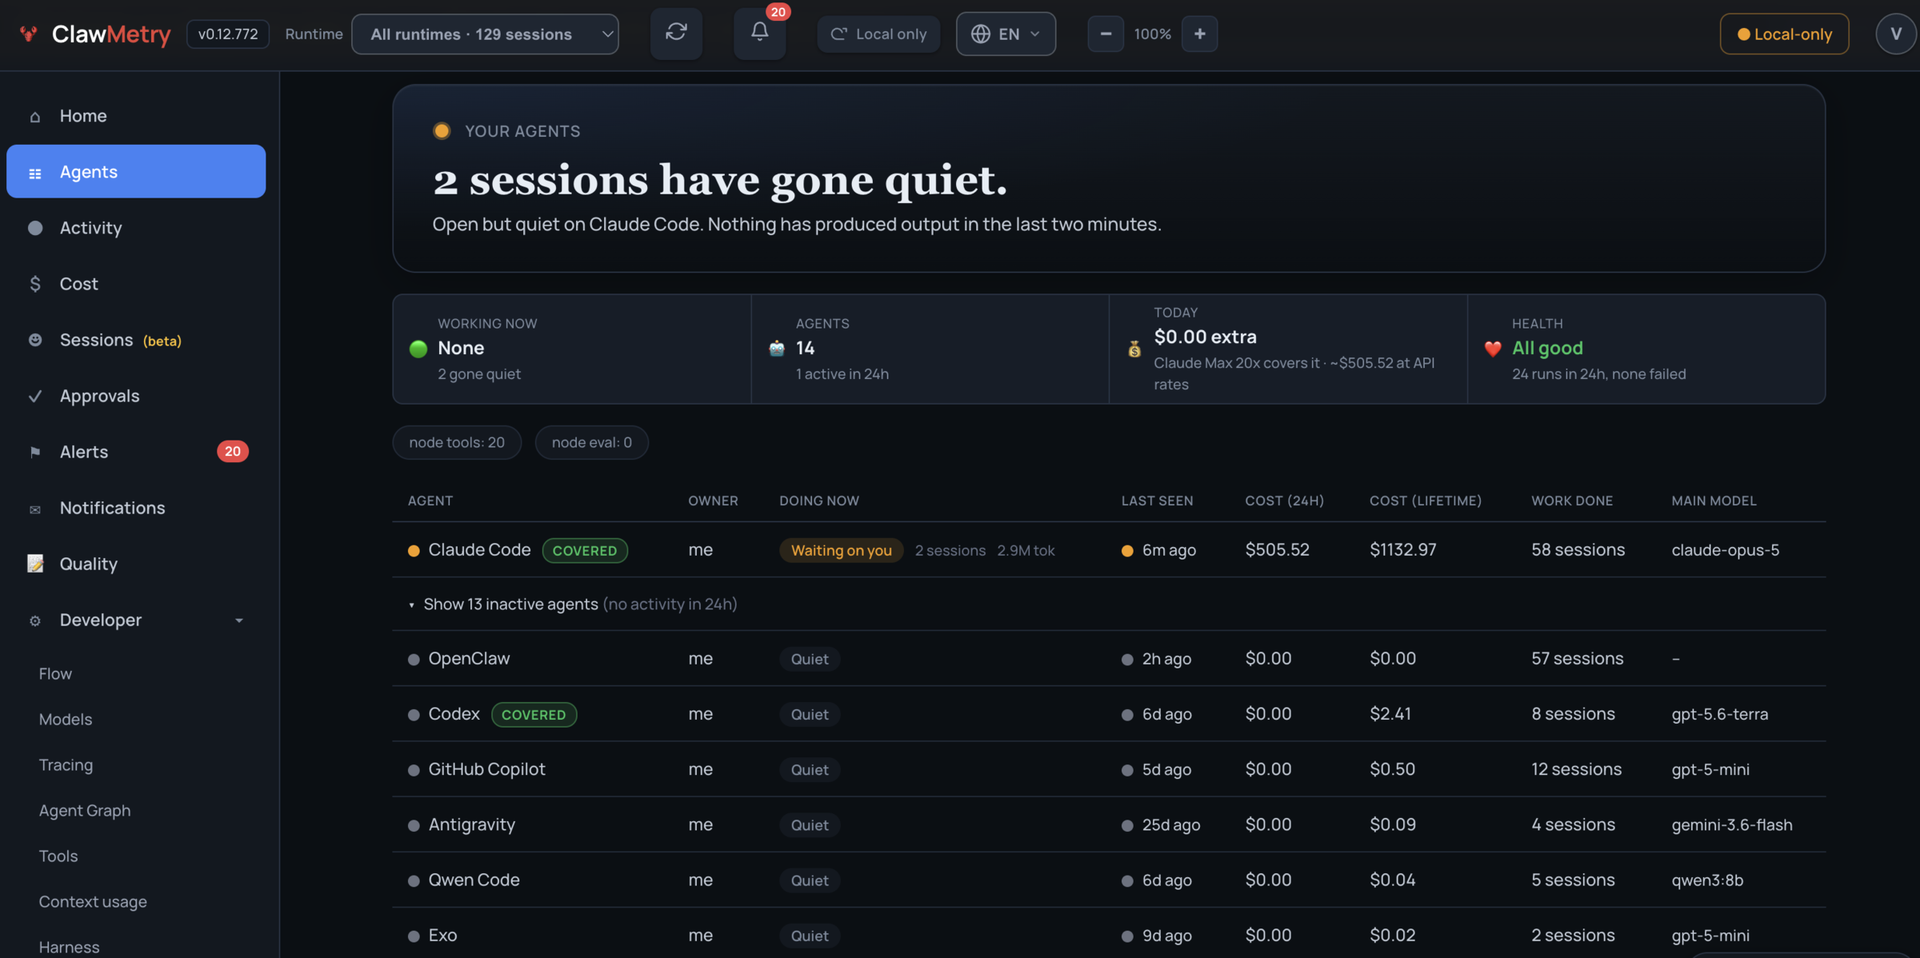
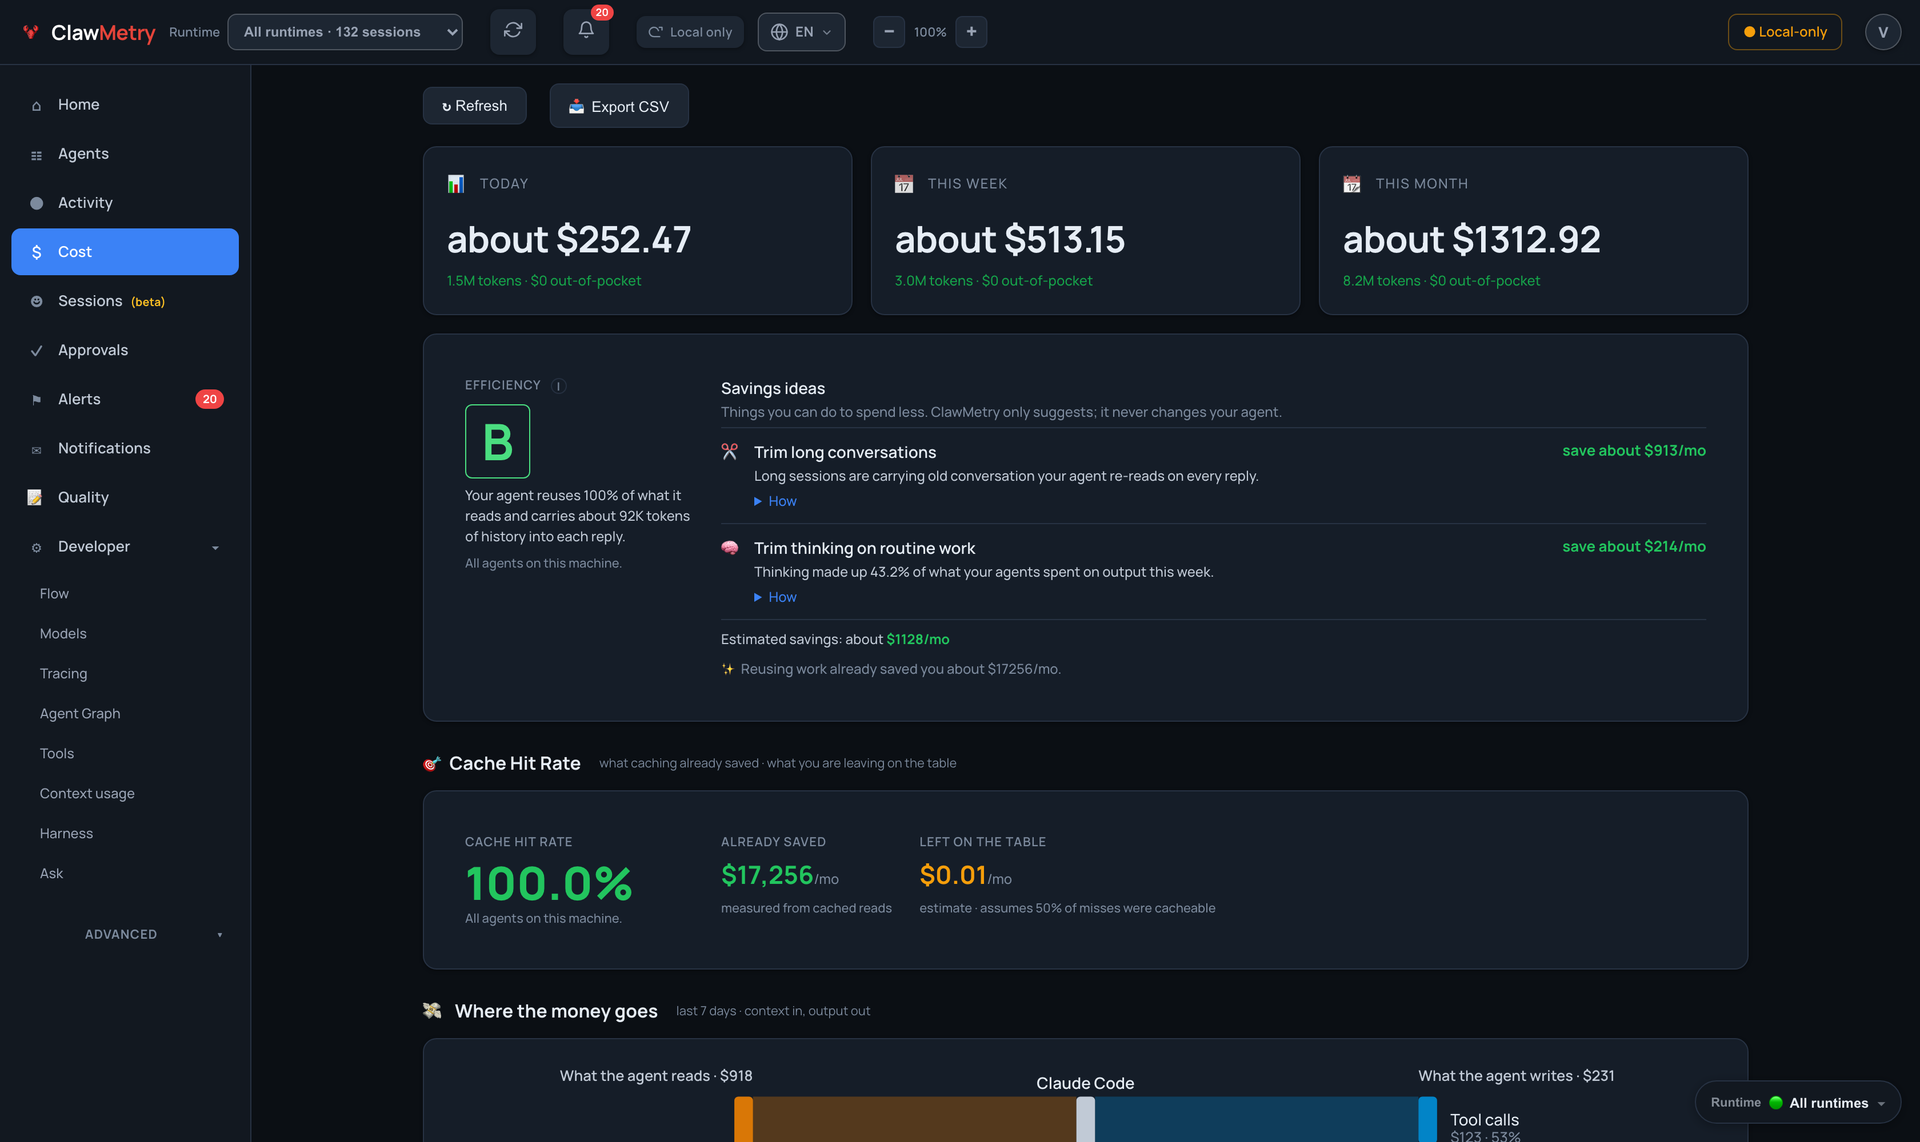
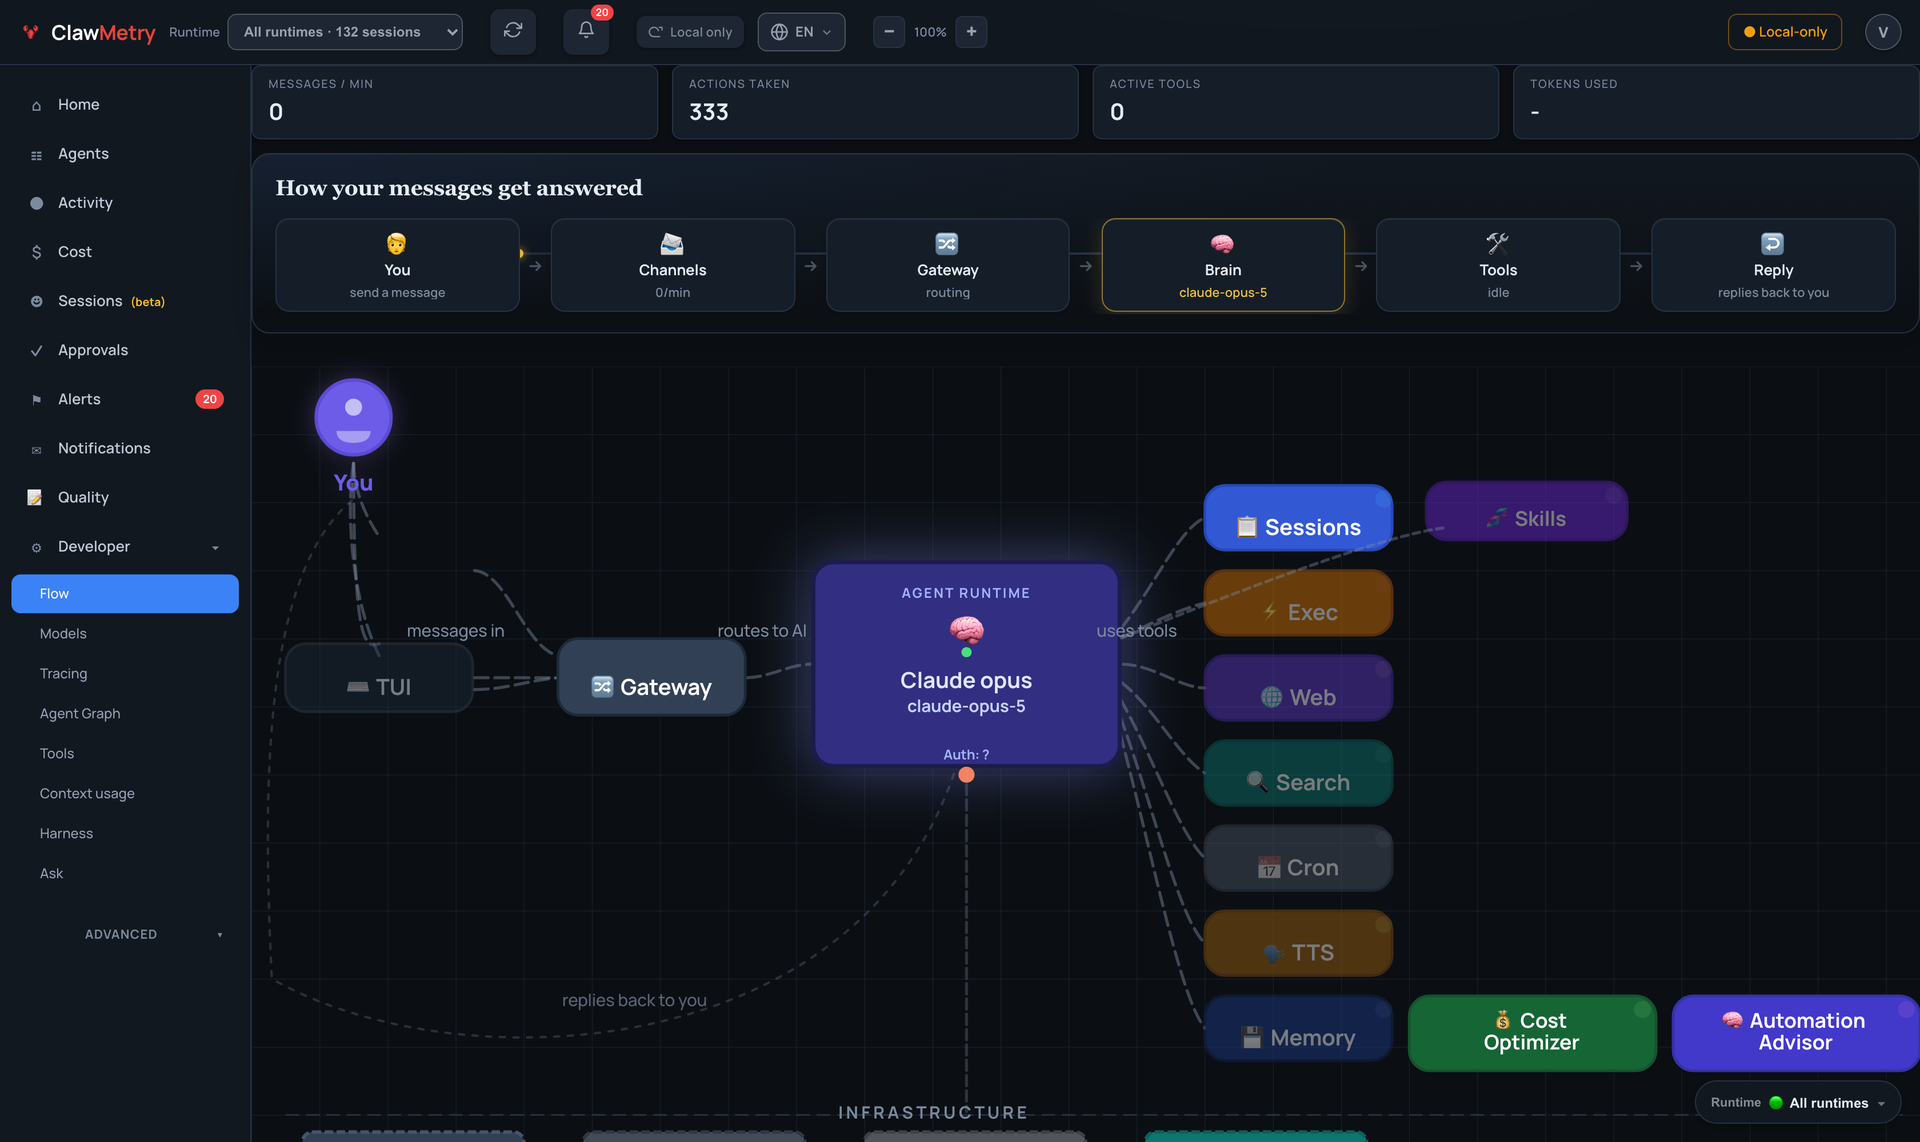
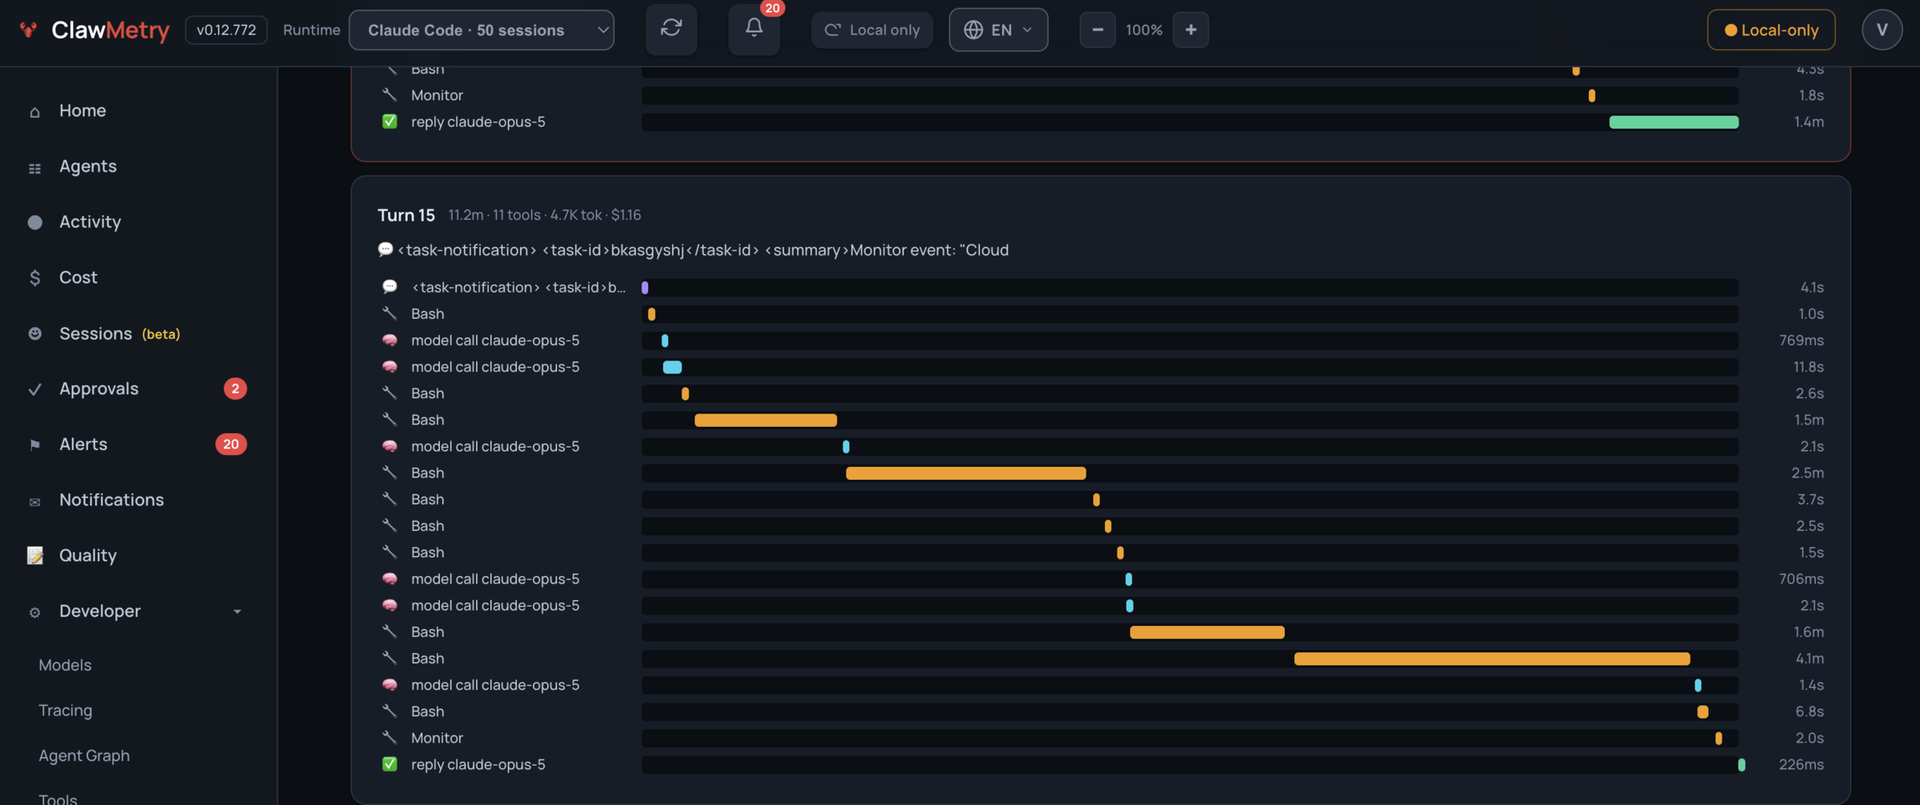
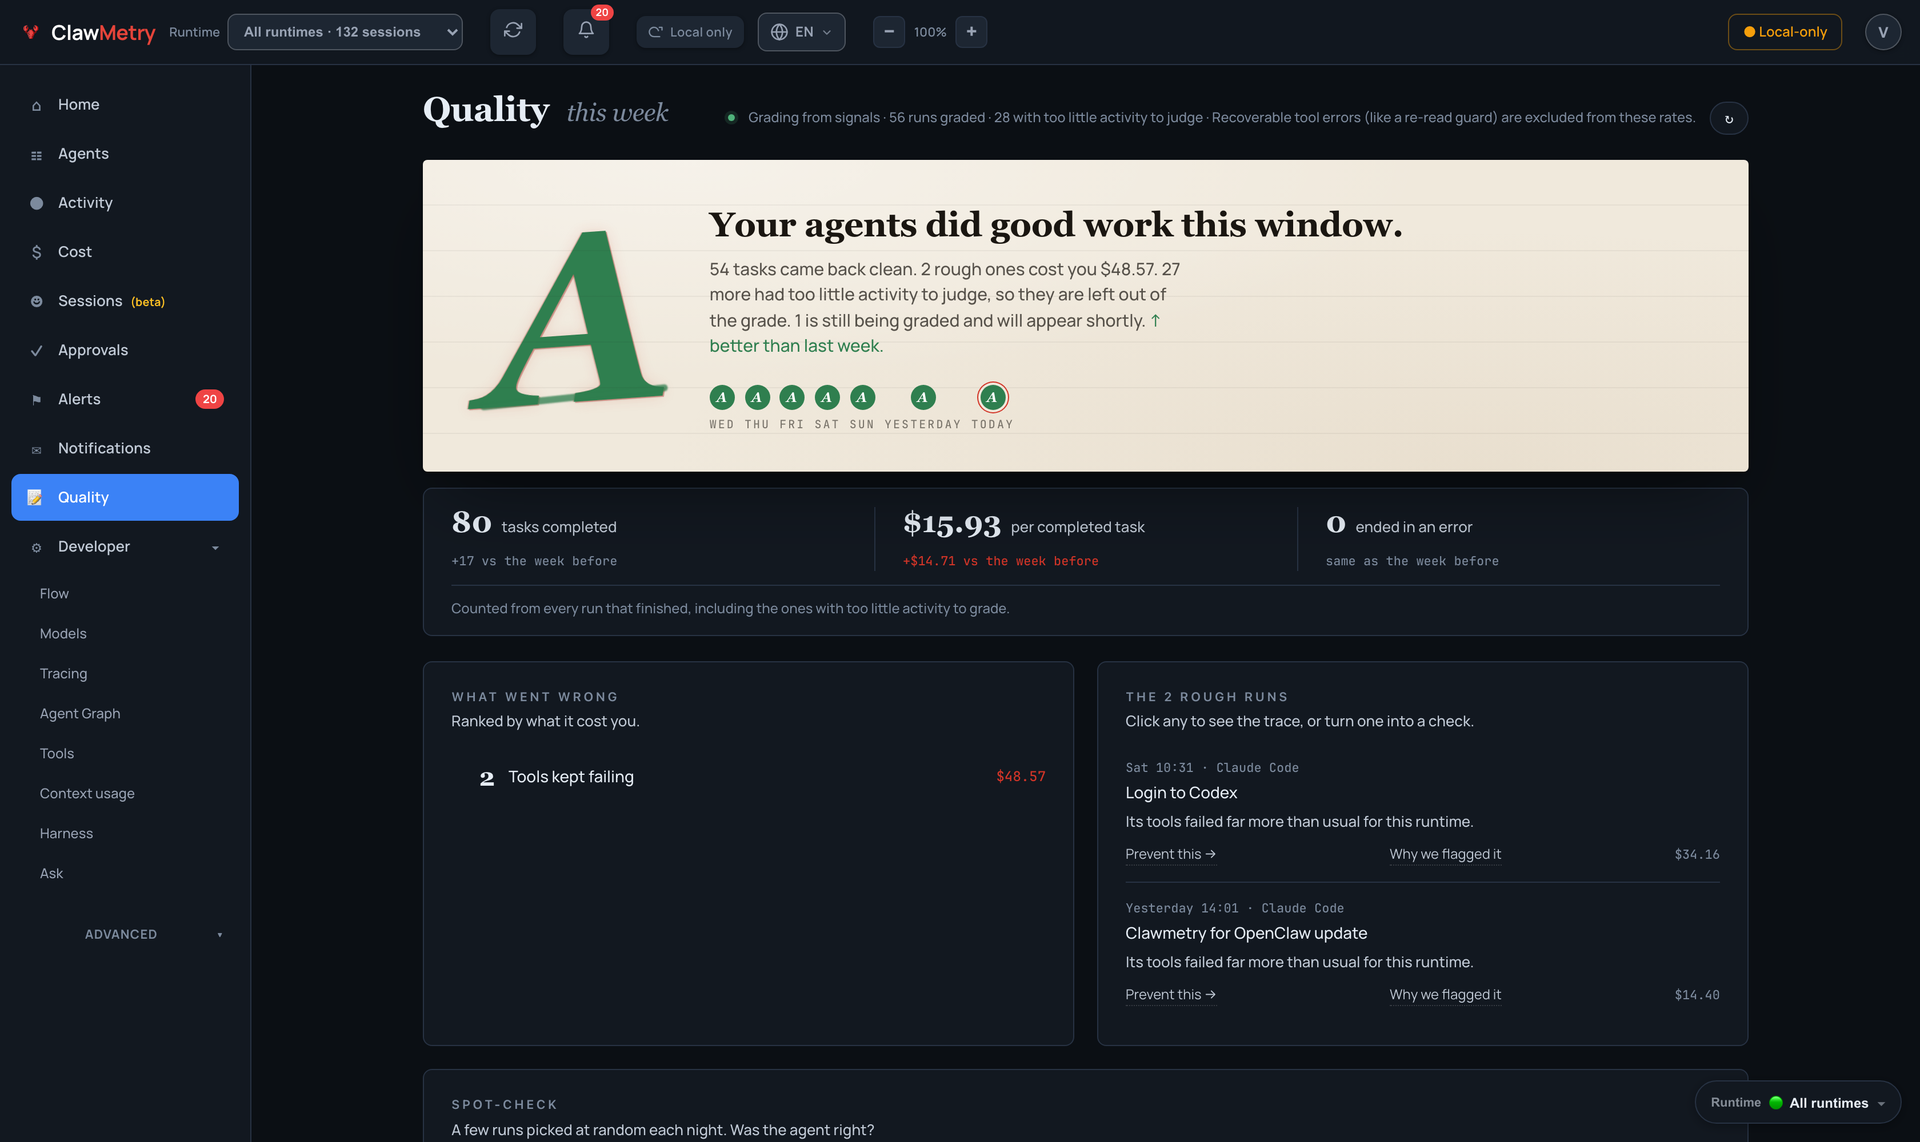
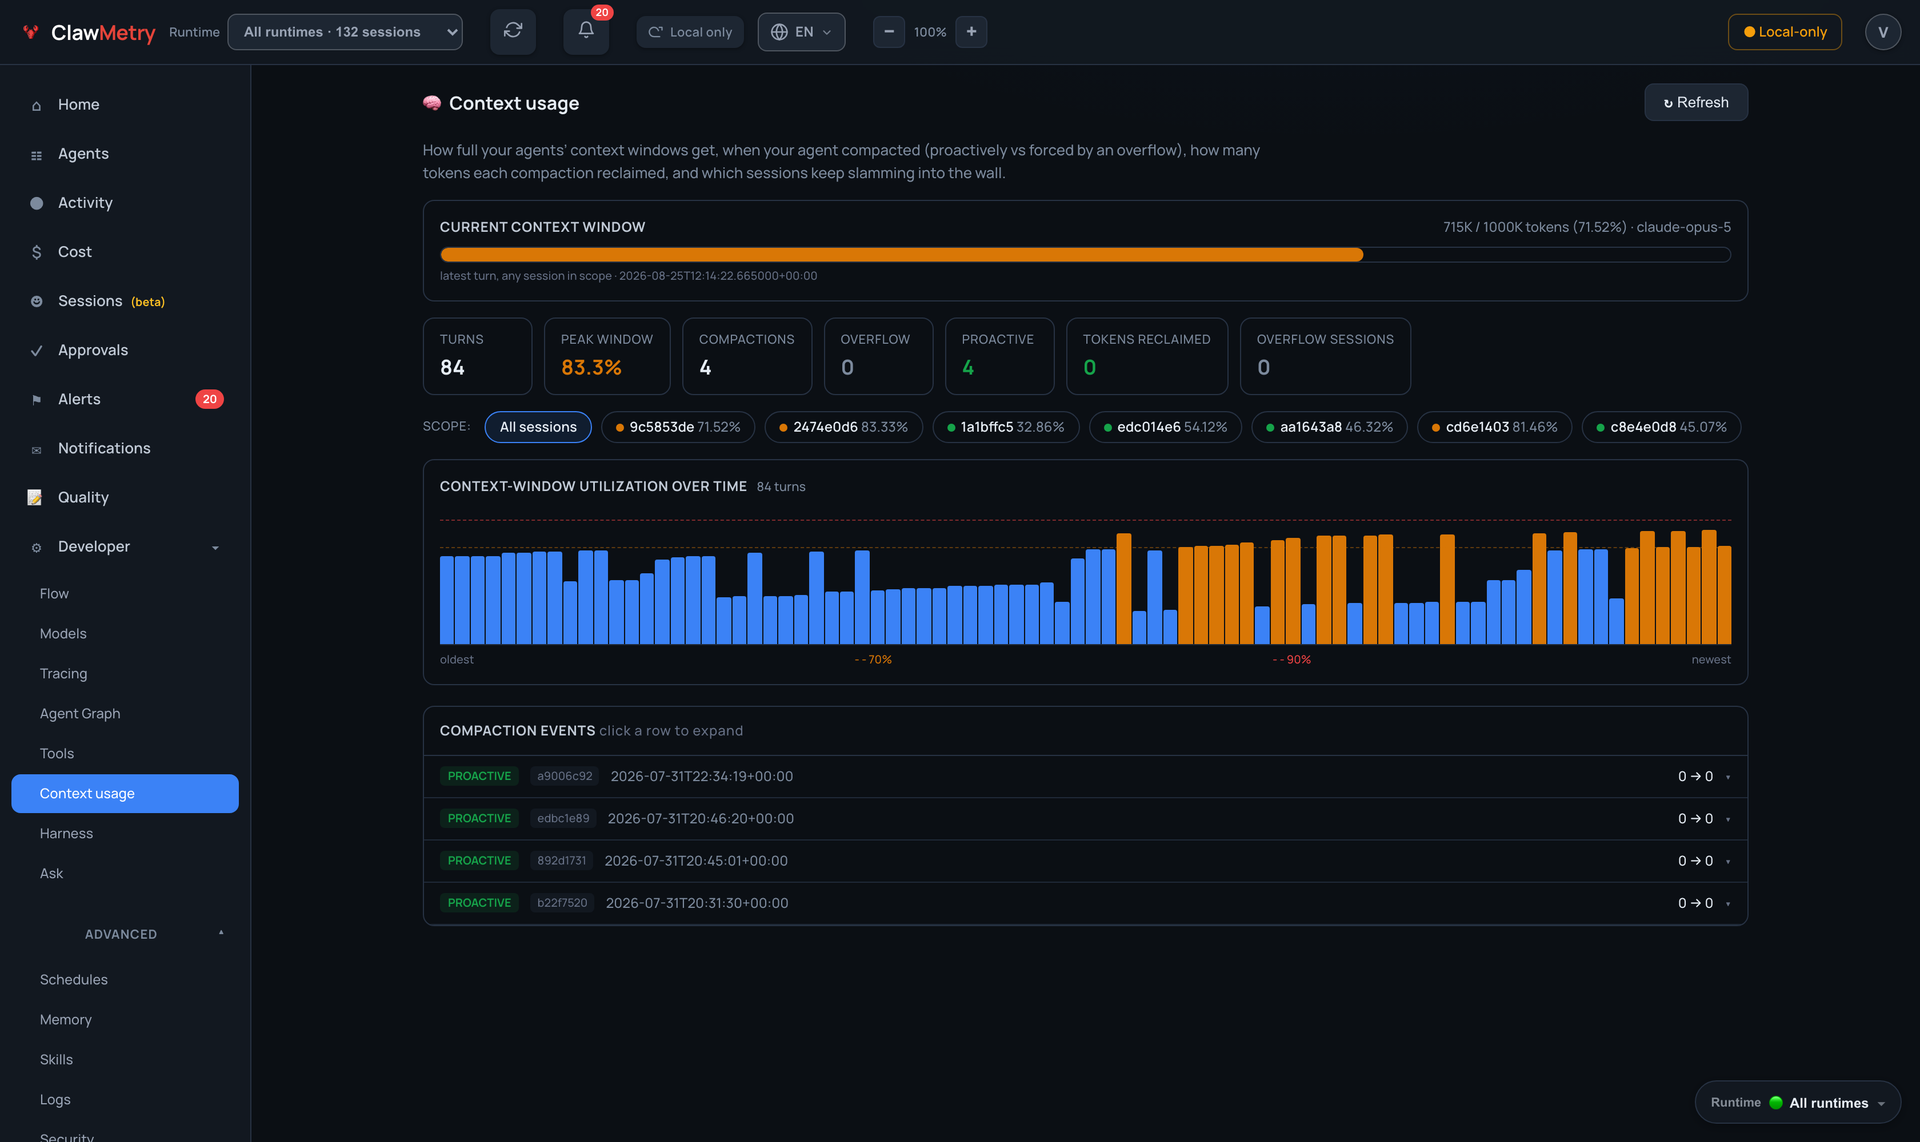
Without an SDK, a proxy, or a single line of agent code changed, ClawMetry reads the session files your AI agents already write and puts every session, tool call, token, and dollar on one live dashboard. The sessions view replays a run turn by turn, with a timeline that gives each tool call its own duration and cost, so a four-minute shell command stands apart from a call that took milliseconds. Usage charts split tokens and spend by runtime, model, session, and day. A live flow diagram follows messages from chat channels through the gateway to models and tools, and a context view tracks window use per turn along with compaction events. The Brain tab streams reasoning, tool calls, and errors as they happen, while memory, skills, health, logs, and cron jobs each get a tab of their own. OTLP receivers accept traces, metrics, and logs from runtimes that keep no local files. The MIT-licensed app reads OpenClaw, NVIDIA NemoClaw, Goose, and Qwen Code for free. Paid plans add the other 28 runtimes, including Claude Code, Codex, and Cursor, plus approval queues for risky tool calls, budget limits, anomaly detection, and a cost optimizer. Session data stays on your server unless you choose to run cloud sync. Running on a dedicated VPS on RepoCloud with guaranteed CPU, RAM, and SSD, full root SSH access, and a browser serial console. MIT licensed.
Benefits
- See Every Agent In One Place
- Sessions, tool calls, tokens, and costs from every supported runtime on the machine land in one dashboard, and a header switcher re-scopes each tab to a single runtime.
- No SDK Or Code Changes
- ClawMetry tails the session files and logs that agents already write, so it runs as a separate process and adds zero overhead to the agent in its default setup.
- Spot Stuck Runs And Cost Spikes
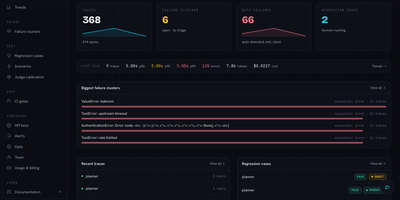
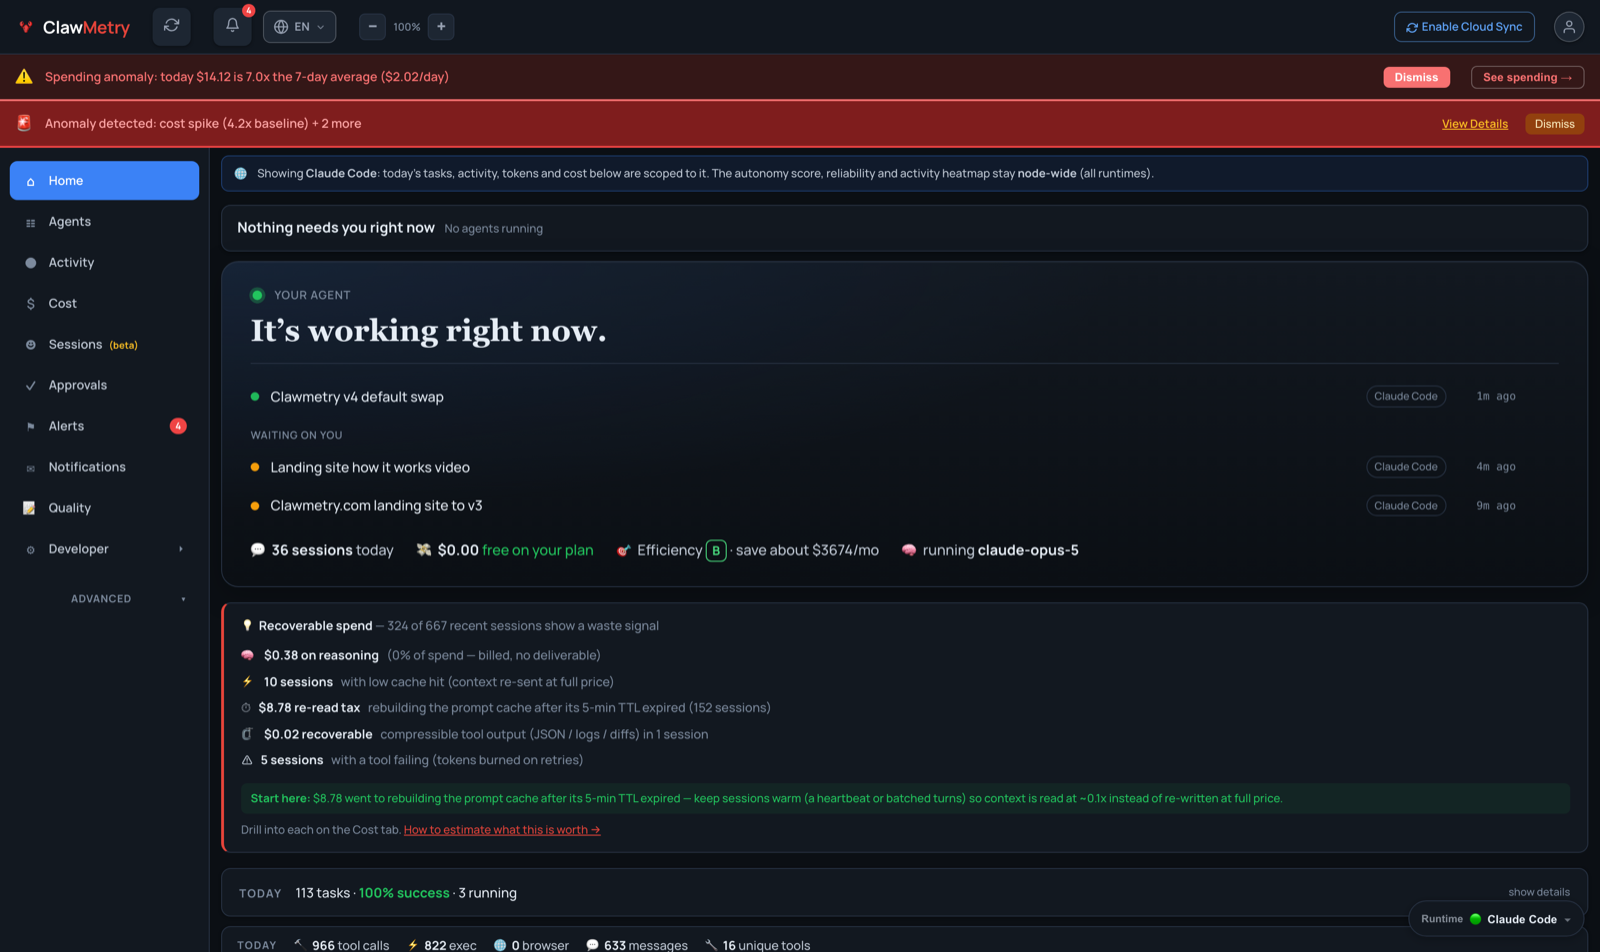
- Per-turn timelines, looping and repeated-failure signals, context-window gauges, and built-in detectors for quiet agents, cost spikes, token bursts, and error climbs show trouble before the bill arrives.
- Keep Session Data On Your Server
- Reading happens locally and no session data leaves the machine unless you run clawmetry connect, and the free tier needs no account or license key to observe OpenClaw.
Features
- Session Replay Timeline
- Replay each run turn by turn with transcripts, sub-agent trees, compaction views, and a per-tool timeline that shows the duration and cost of every Bash call and model call.
- Cost And Token Tracking
- Charts split tokens and spend by runtime, model, provider, skill, and day, with today, week, and month totals; paid plans add anomaly detection and a cost optimizer.
- Live Flow Diagram
- A real-time diagram animates messages from chat channels through the gateway to models and tools, while the Brain tab streams every reasoning event, tool call, and error with filters.
- Context Window Insight
- Utilization gauges size each window per provider, separate proactive compaction from forced overflow, and report per runtime whether a zero means a clean run or a blind spot.
- Alerts And Approvals
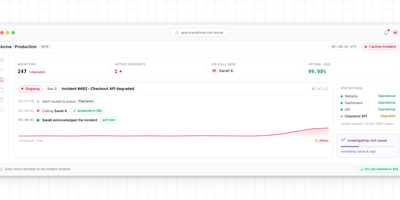
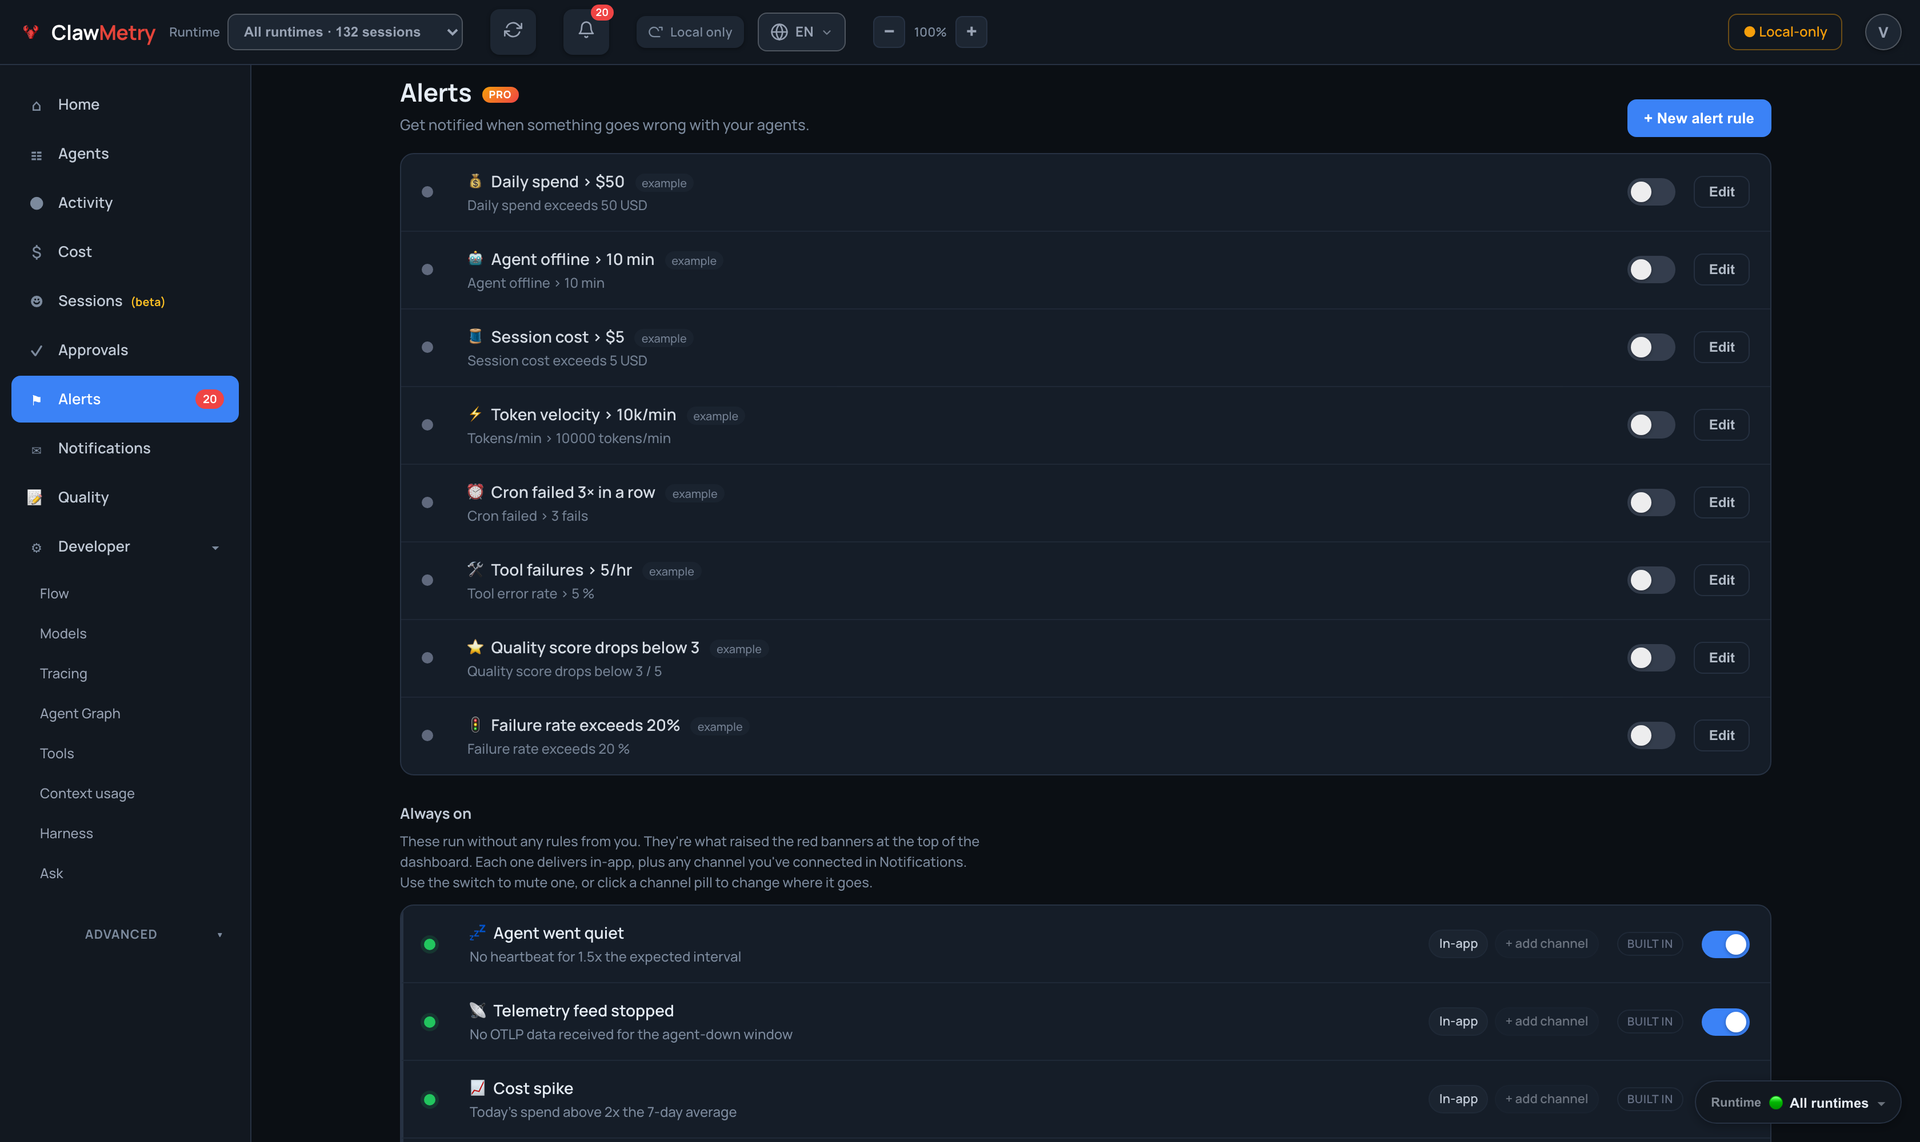
- Built-in detectors flag quiet agents, cost spikes, and error bursts for delivery to Slack, Discord, PagerDuty, Telegram, or email; opt-in rules on paid plans pause risky tool calls.
- Pip Or Docker Install
- Run pip install clawmetry and open port 8900, or build the included Dockerfile and mount agent data directories read-only; OTLP receivers accept telemetry from runtimes without local files.