SaaS Alternative
Google PhotosCategories
Self-Hosted Data Visualization Photo Management Immich Companion Photo Analytics Statistics Dashboard Year In ReviewStars
Forks
Watchers
Developer links
Immich Insights
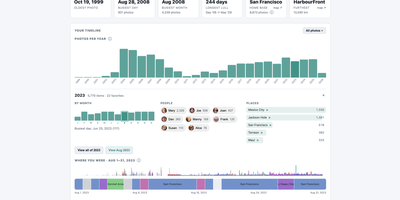
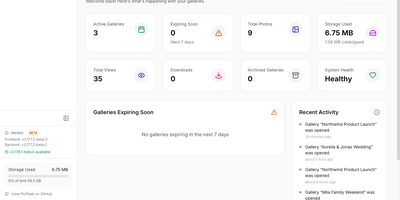
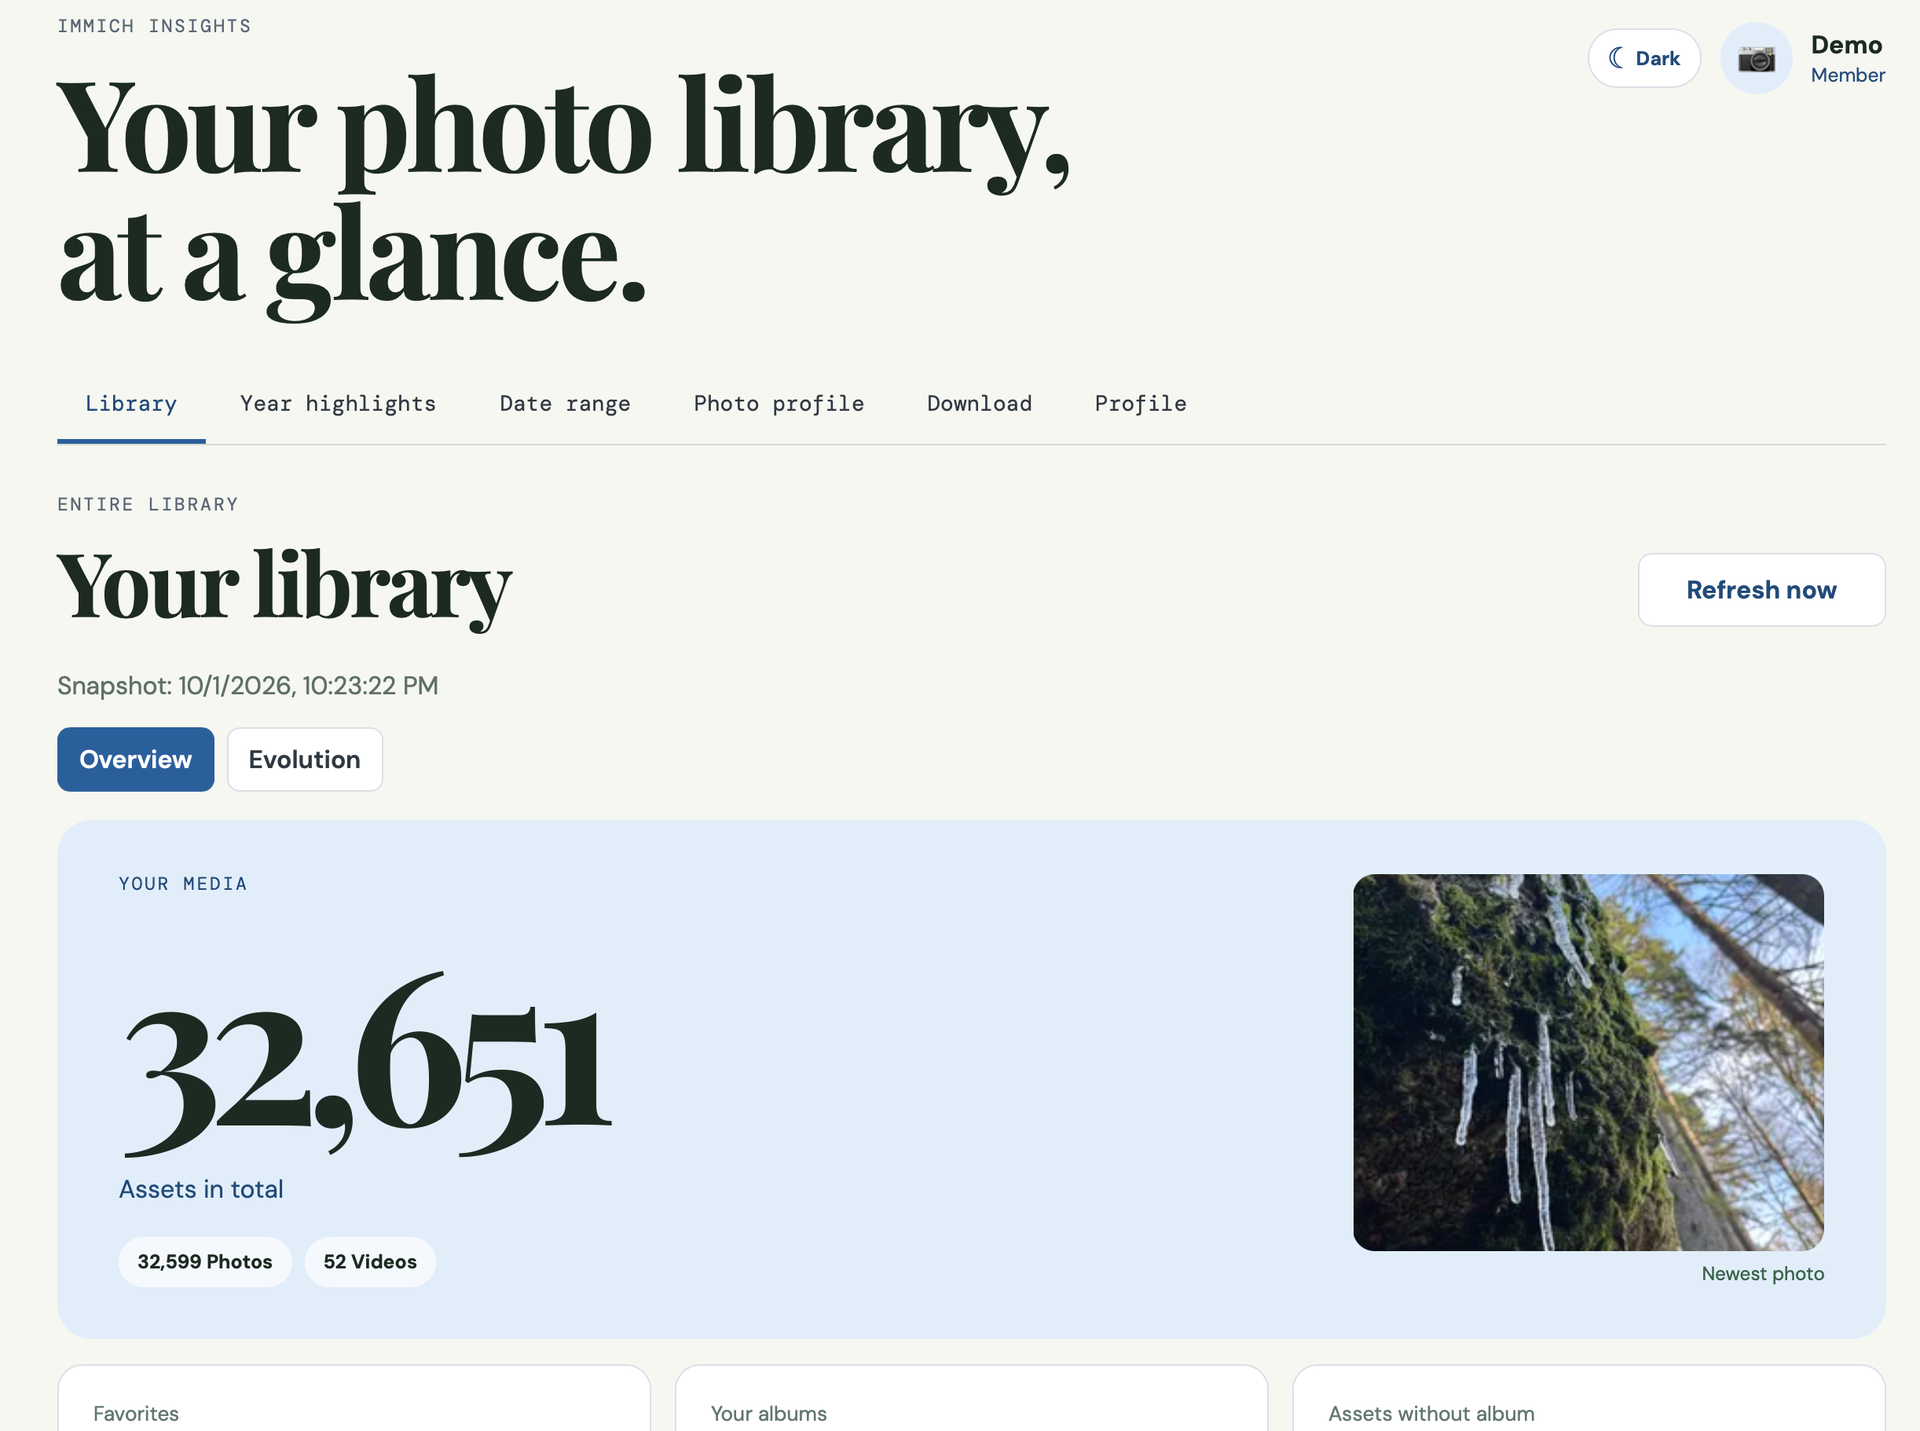
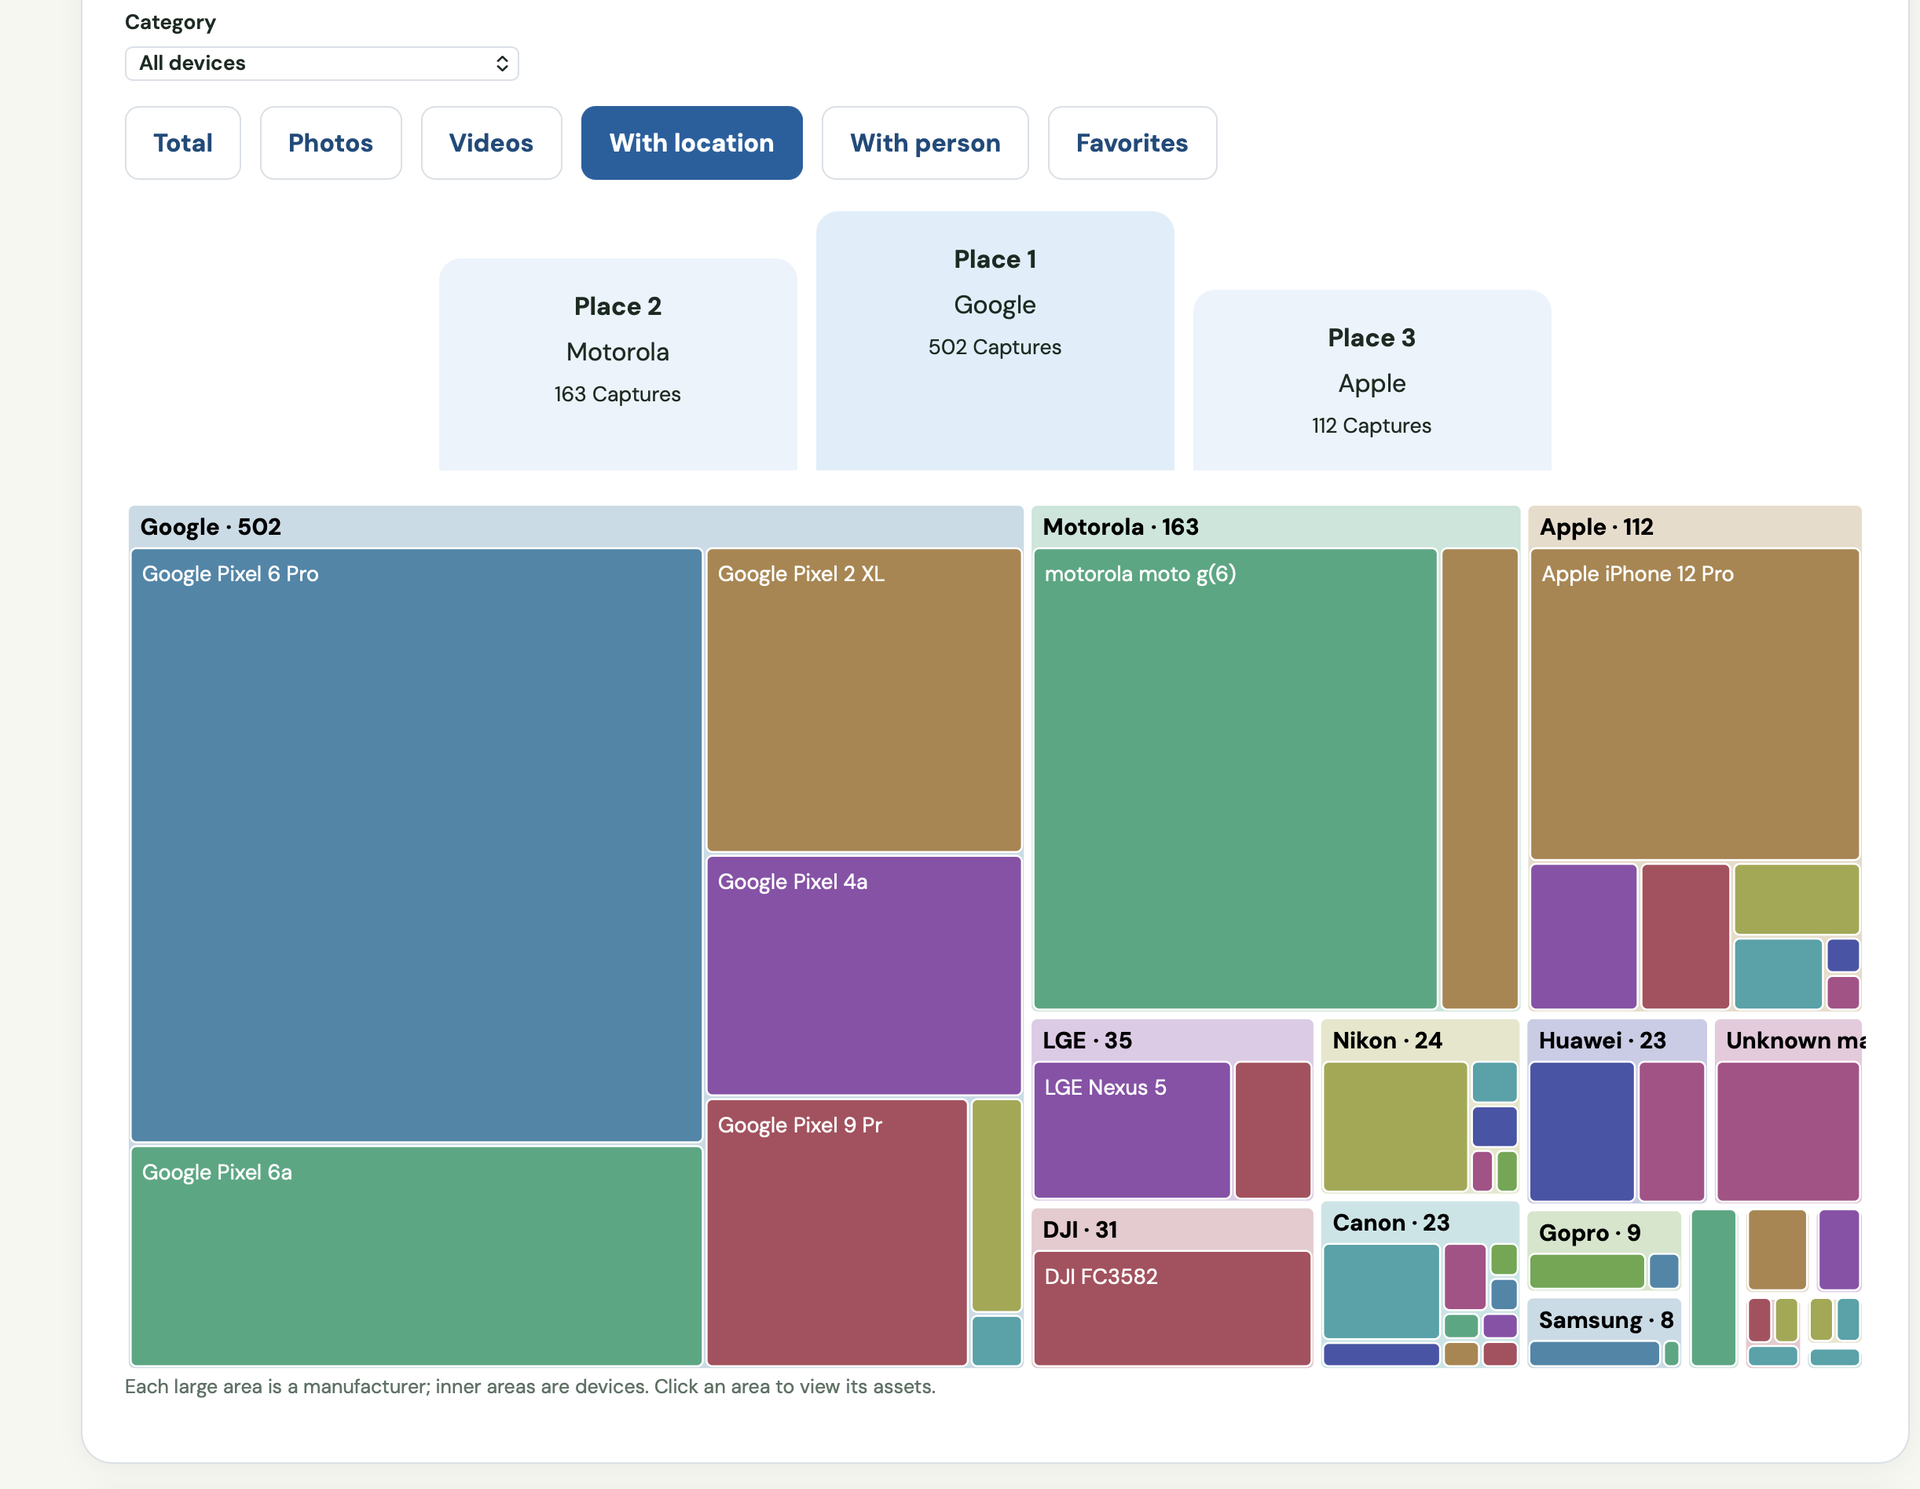
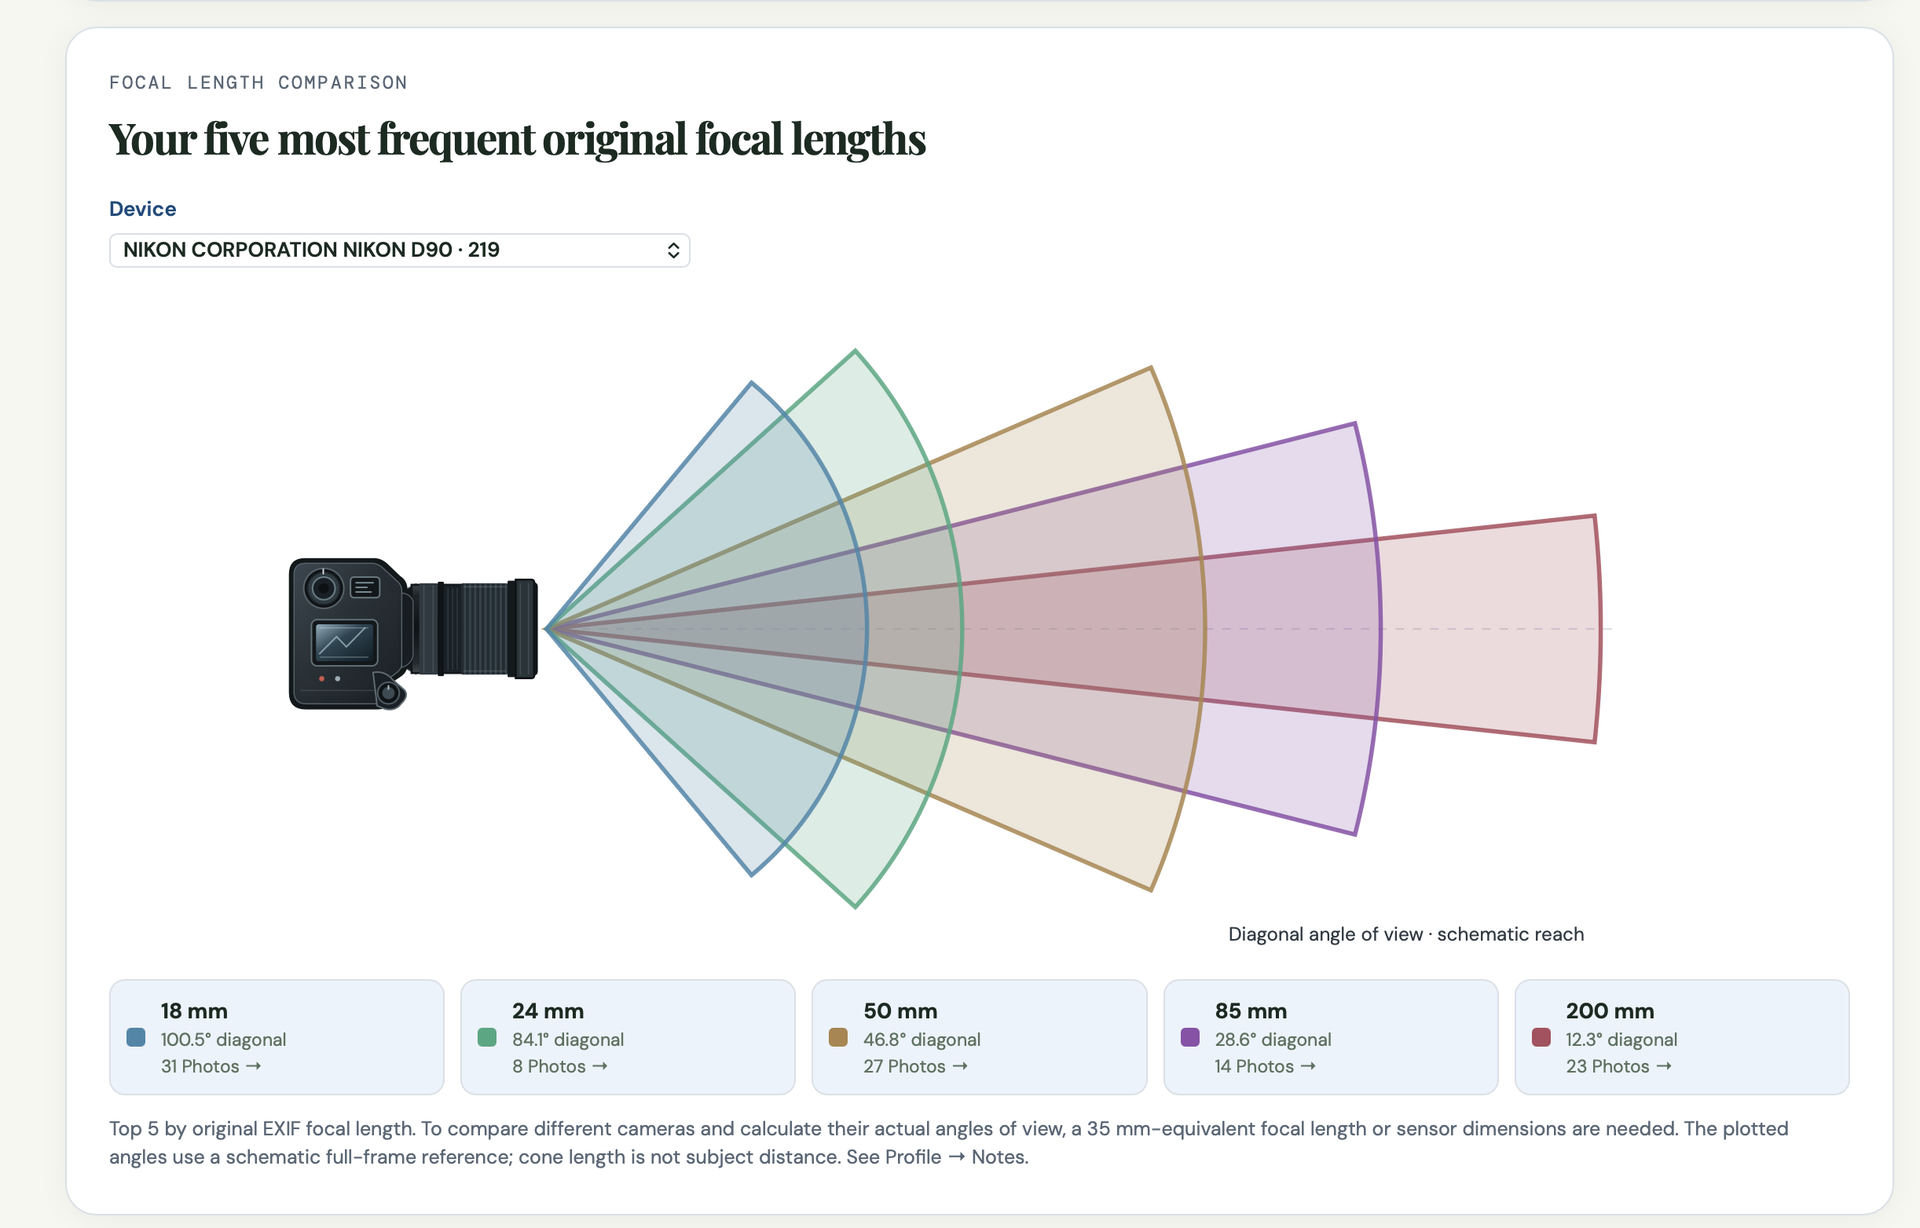
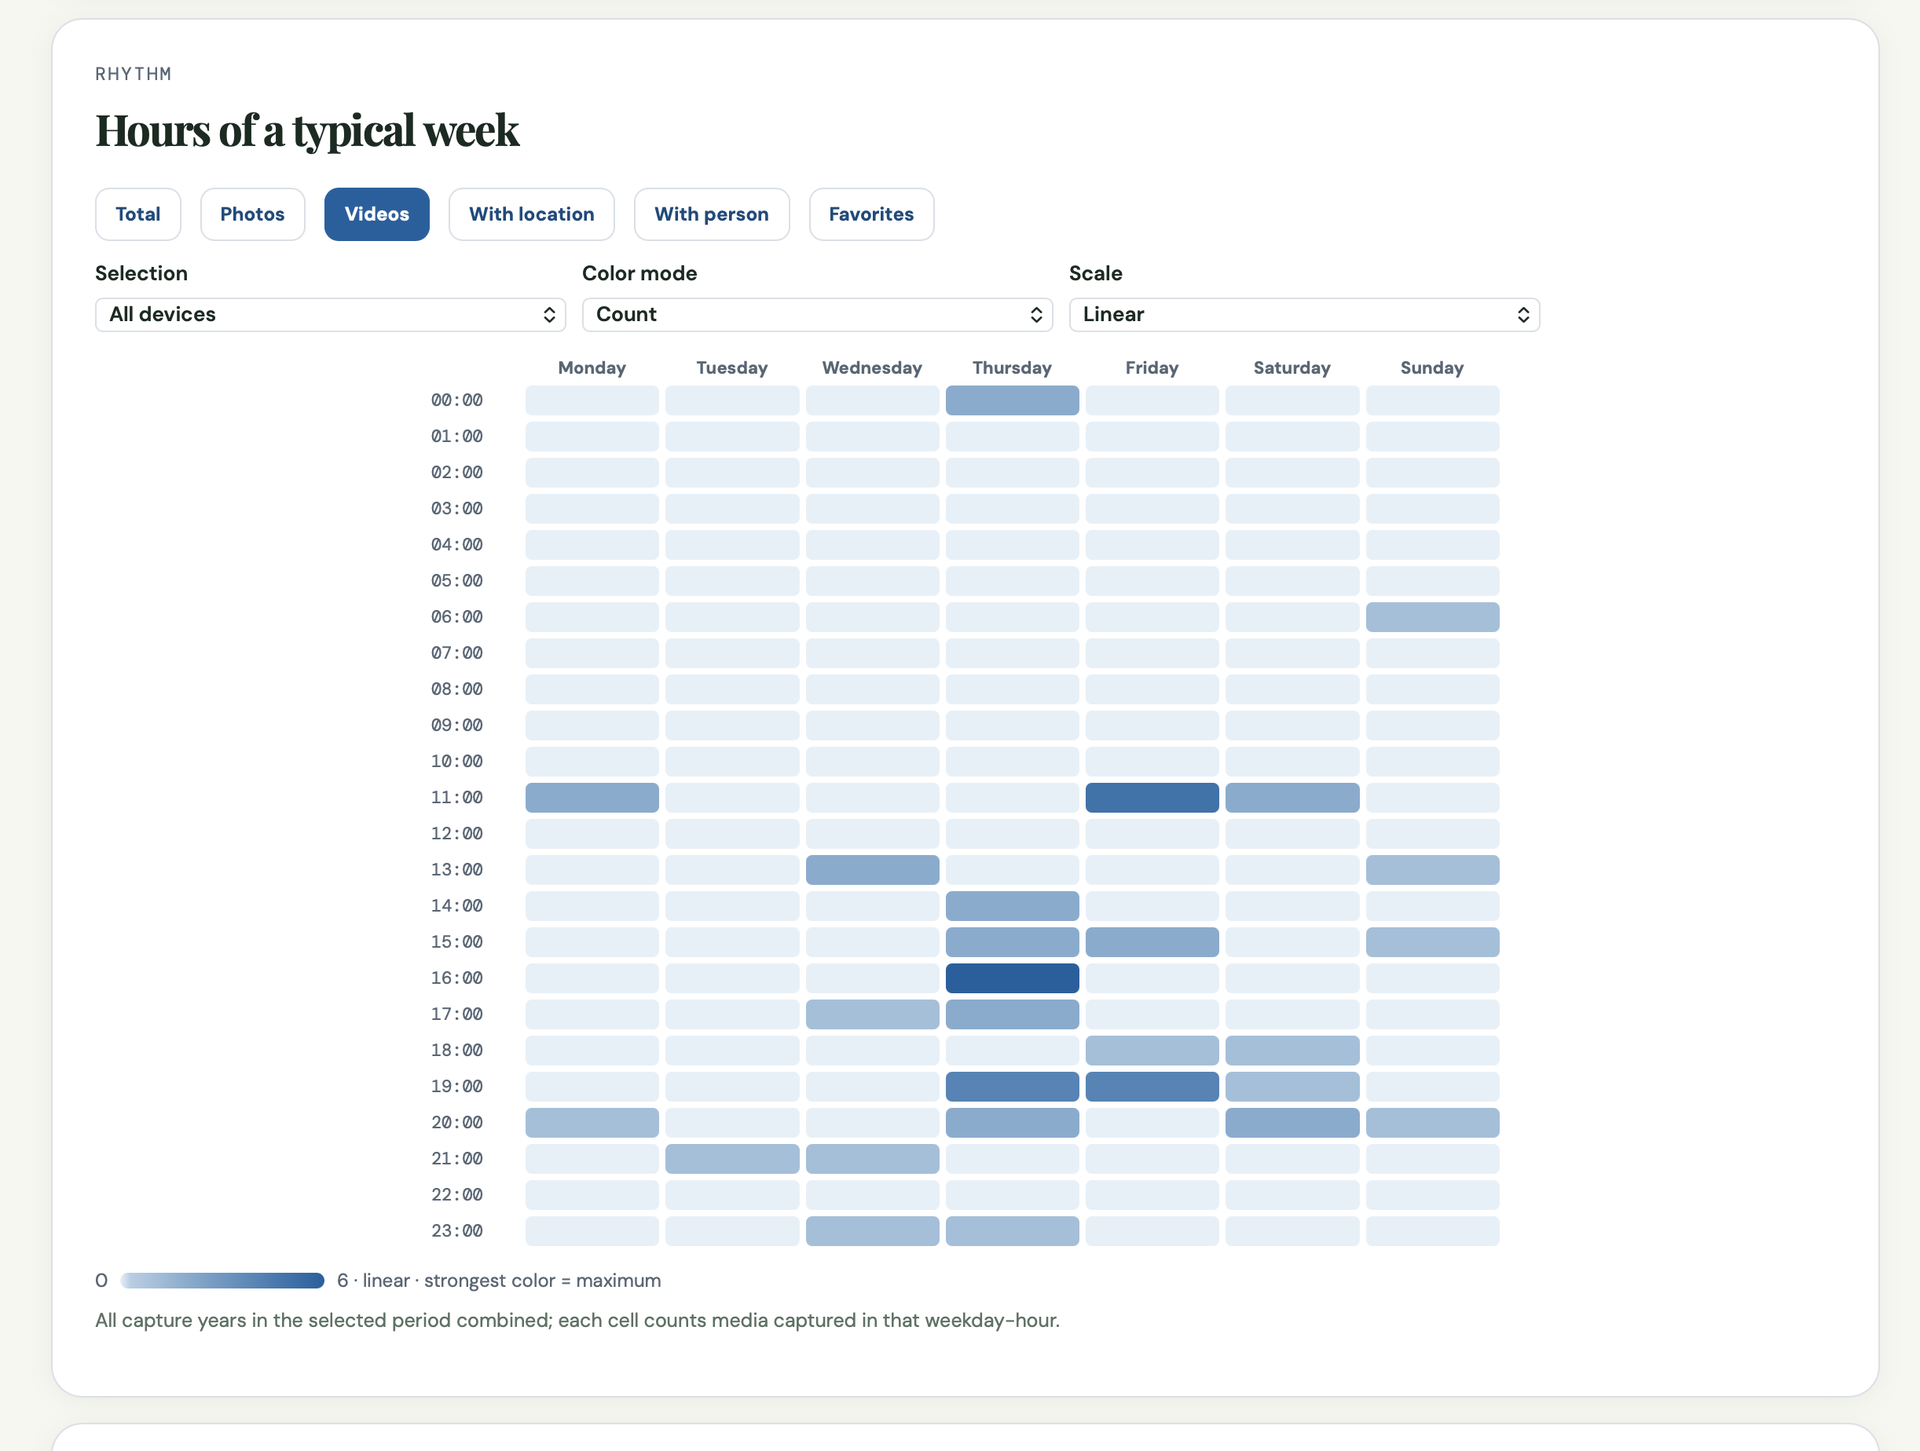
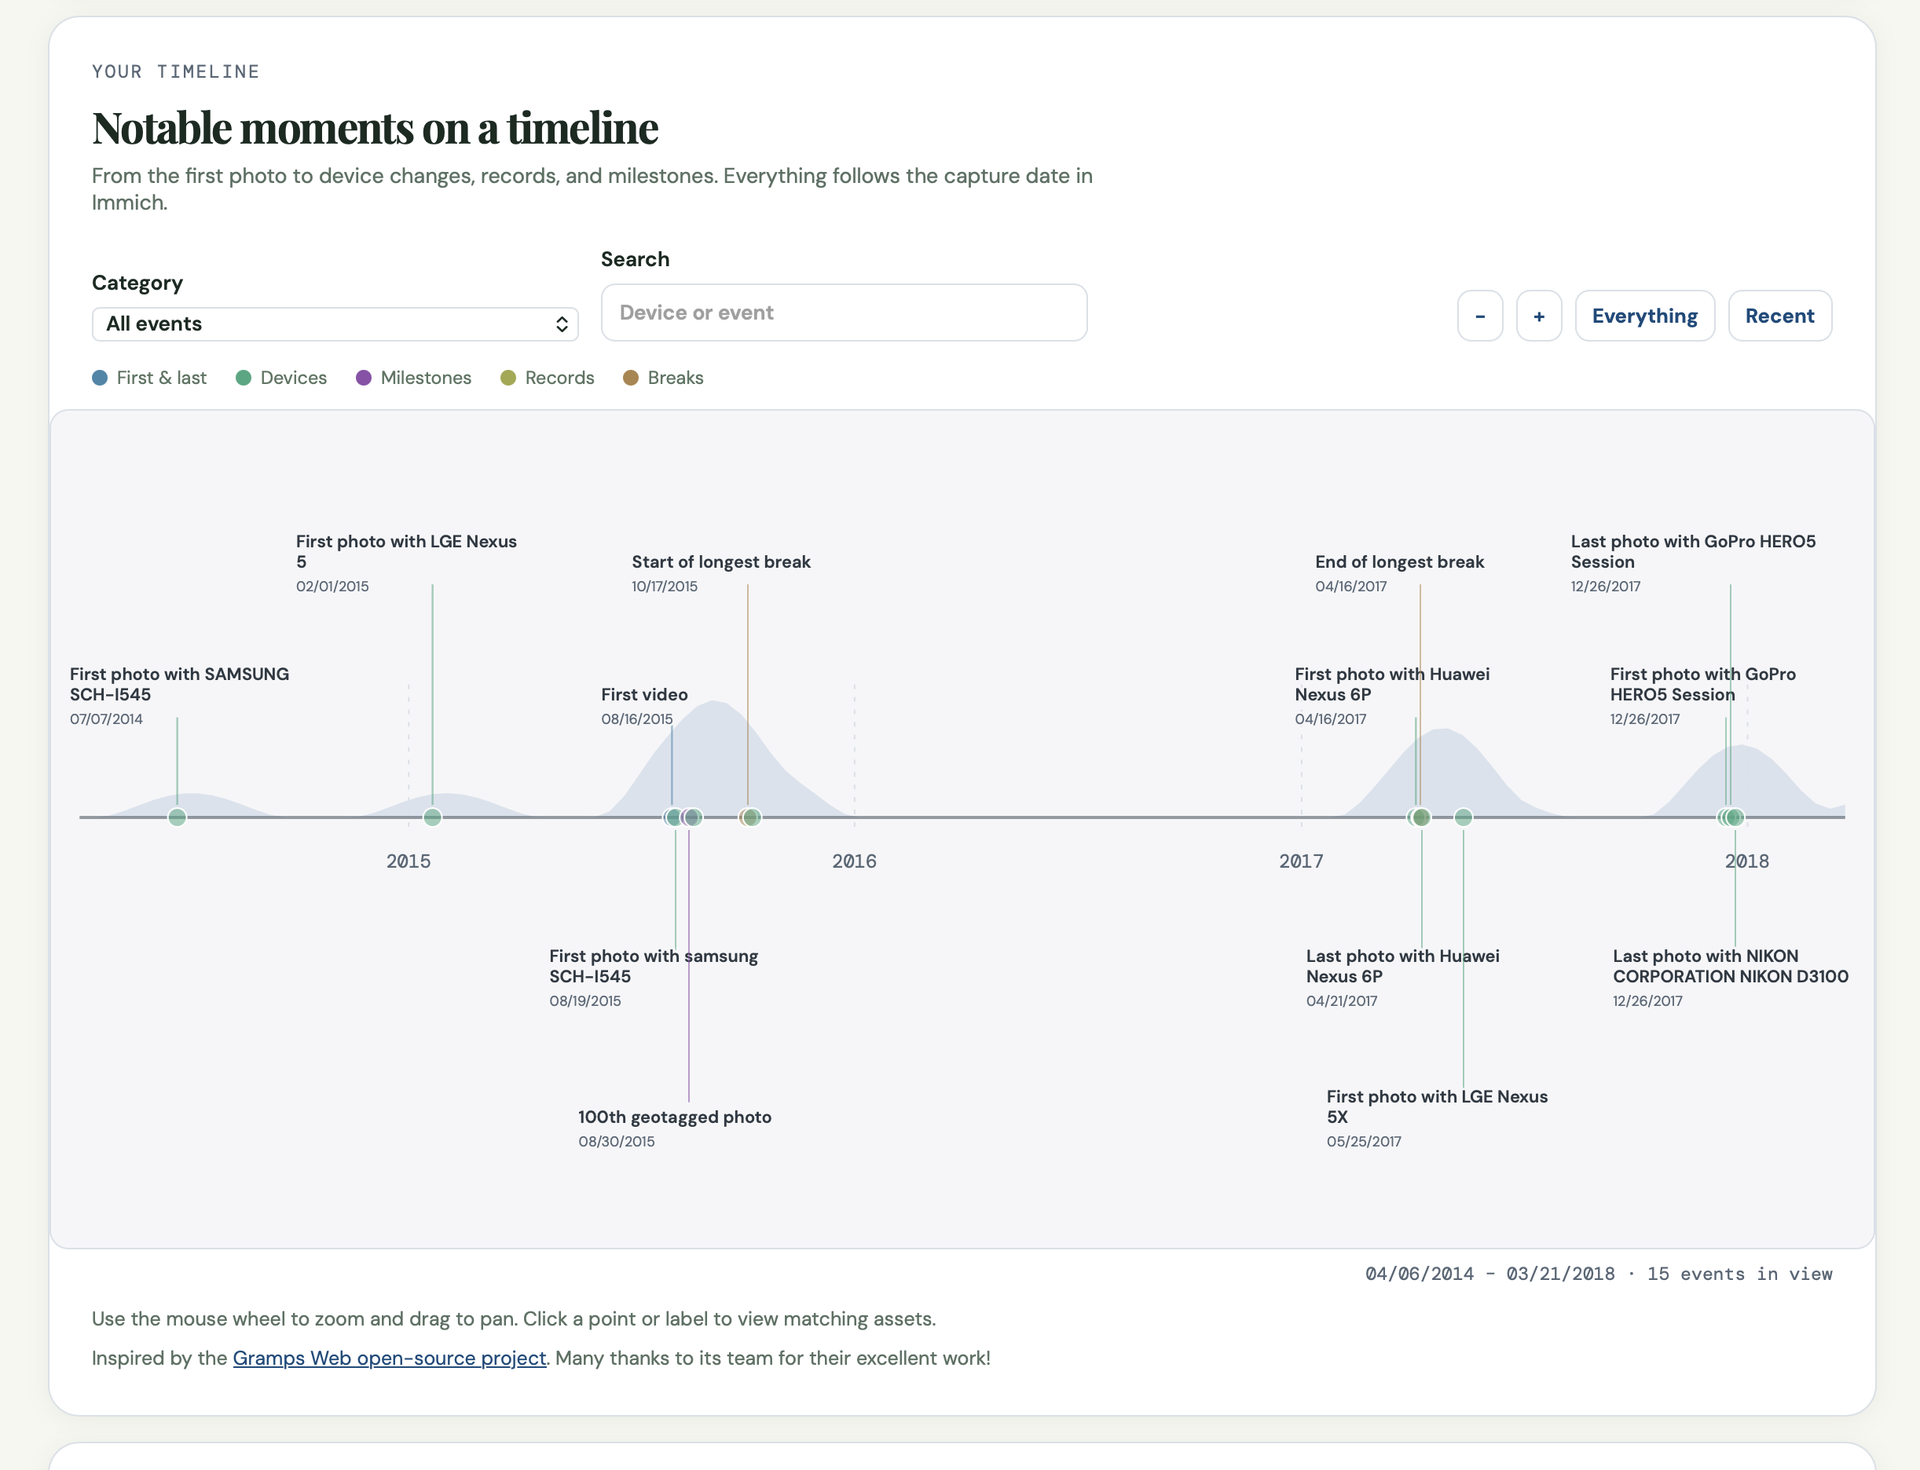
Immich Insights turns the photo library you already keep in Immich into a year-in-review style dashboard of how you actually shoot. Connect it with your own Immich API key and it reads your asset metadata into a local snapshot, without copying your original photos, then builds the overview Immich itself never shows: total photos and videos, storage used, favorites, albums, and your newest additions. Pick any year or a custom date range and see that period's shooting volume, favorites, albums, and devices. Camera statistics break your library down by device and manufacturer, with leaderboards you can correct when the same camera appears under different names. Exposure analysis shows your ISO, focal length, and shutter speed distributions, the focal lengths you reach for most, and how your settings shift by hour of day. Rhythm charts map your shooting by month, weekday, and hour, with a calendar heatmap of your most active days. A zoomable timeline marks the moments that matter: first photo, a new device joining the library, your longest gap, your busiest day ever. People and location views count faces and mapped places by country and continent, and a photography profile scores your habits. Clicking any chart value opens the matching photo thumbnails, and reports export as PDF, CSV, or JPG. Running on a dedicated VPS on RepoCloud with guaranteed CPU, RAM, and SSD, full root SSH access, and a browser serial console. MIT licensed.
Benefits
- Your Library, Reviewed Yearly
- Any year or custom range becomes a review of shooting volume, favorites, albums, and devices, giving Immich the retrospective view that photo services use to keep you subscribed.
- Originals Never Copied
- Insights reads asset metadata through your own Immich API key and keeps a local snapshot, loading thumbnails from Immich on demand, so the dashboard adds no second copy of your photos.
- Habits Made Measurable
- Device leaderboards, focal length and ISO distributions, hour-of-day patterns, and a photography profile turn vague impressions about how you shoot into numbers you can act on.
- Every Chart Opens Photos
- Clicking a value in any chart shows the thumbnails behind it, and finished reports export as PDF, CSV, or JPG, so statistics stay connected to the pictures they describe.
Features
- Library And Year Overview
- See photo and video totals, storage, favorites, albums, and unalbumed assets for the whole library, then narrow to any year or custom range for that period's highlights.
- Camera And Exposure Stats
- Break shooting down by device and manufacturer with correctable device names, plus ISO, focal length, exposure time, and video duration distributions and exposure triangle analysis.
- Shooting Rhythm Charts
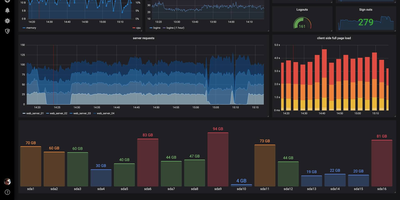
- View activity by month, weekday, and hour with a yearly calendar heatmap, and watch ISO, focal length, and aperture change across the hours you typically shoot.
- Timeline And Places
- A zoomable timeline marks your first photo, new devices, longest break, and busiest day, while people and location views count faces, countries, and continents across the library.
- Exports And Snapshots
- Save the metadata snapshot as SQLite and export reports as PDF, CSV, or JPG, in English, German, or Spanish, with light and dark themes for the dashboard.