Stars
Forks
Watchers
Developer links
Jaeger
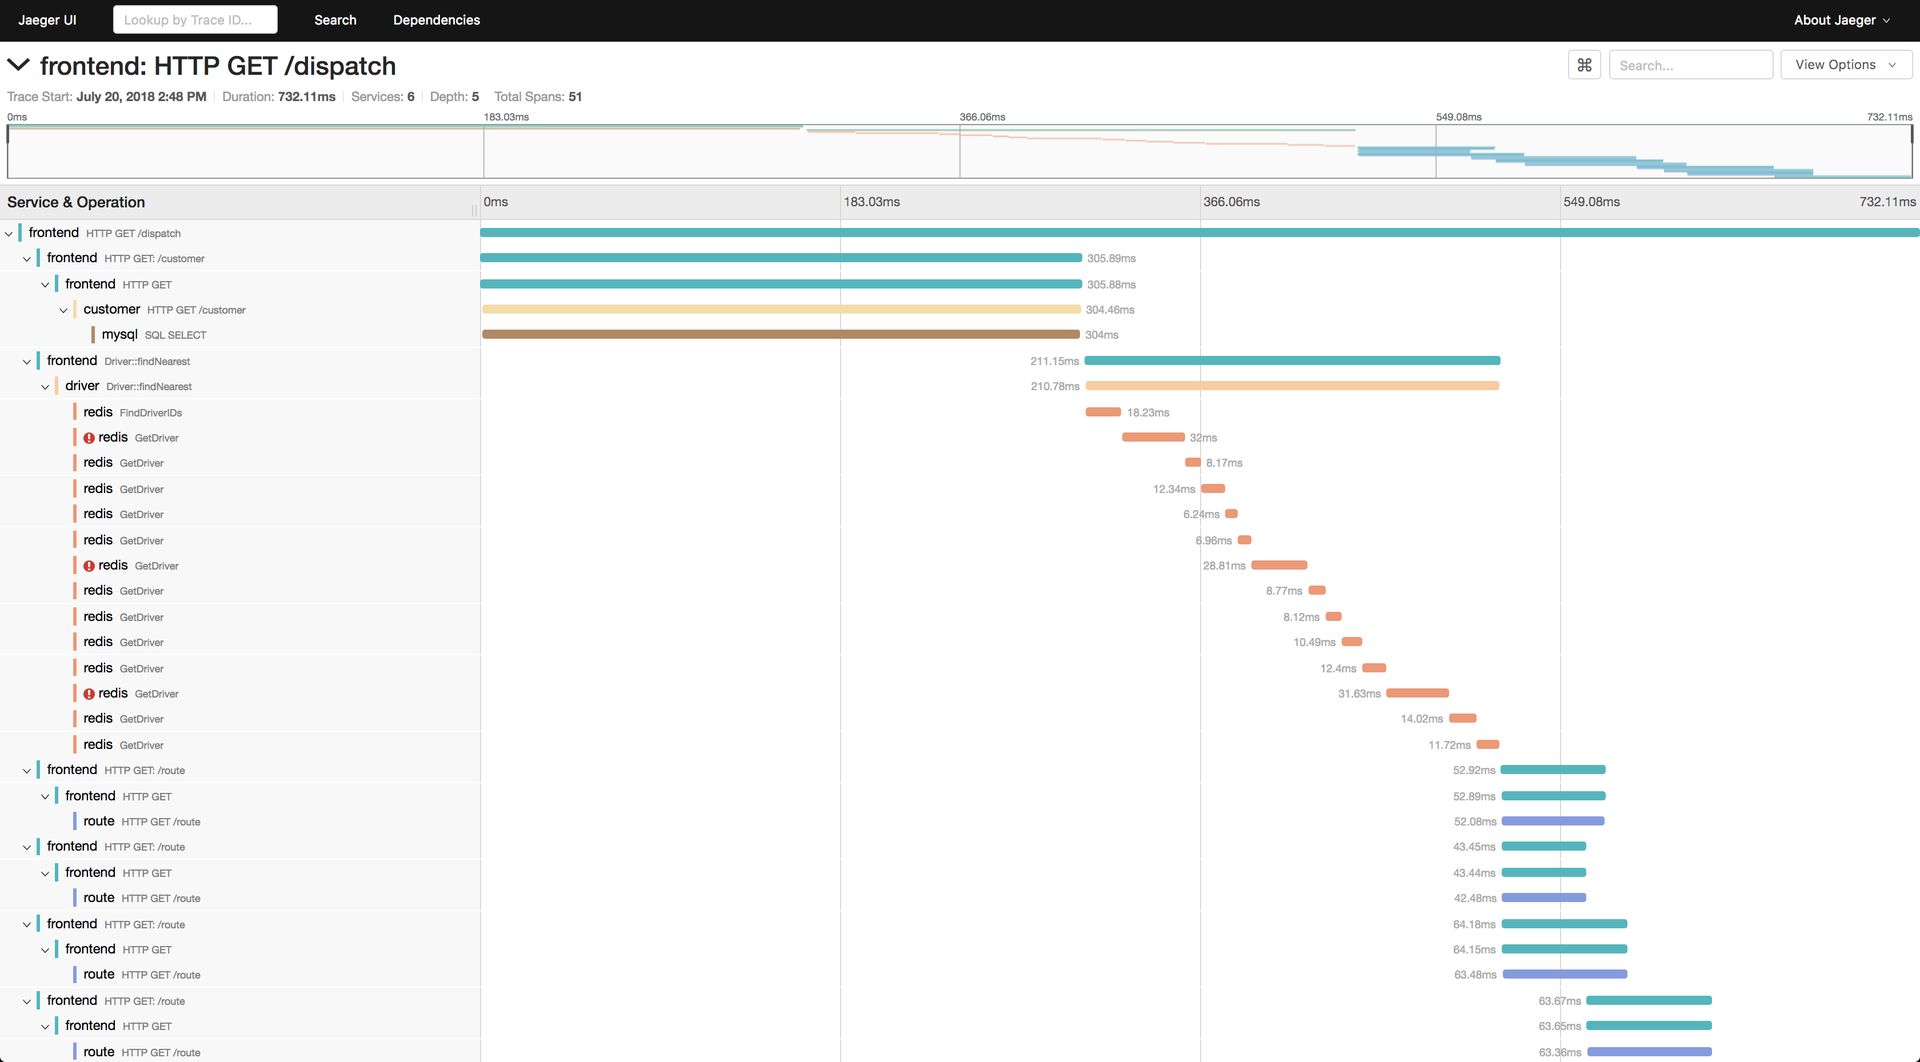
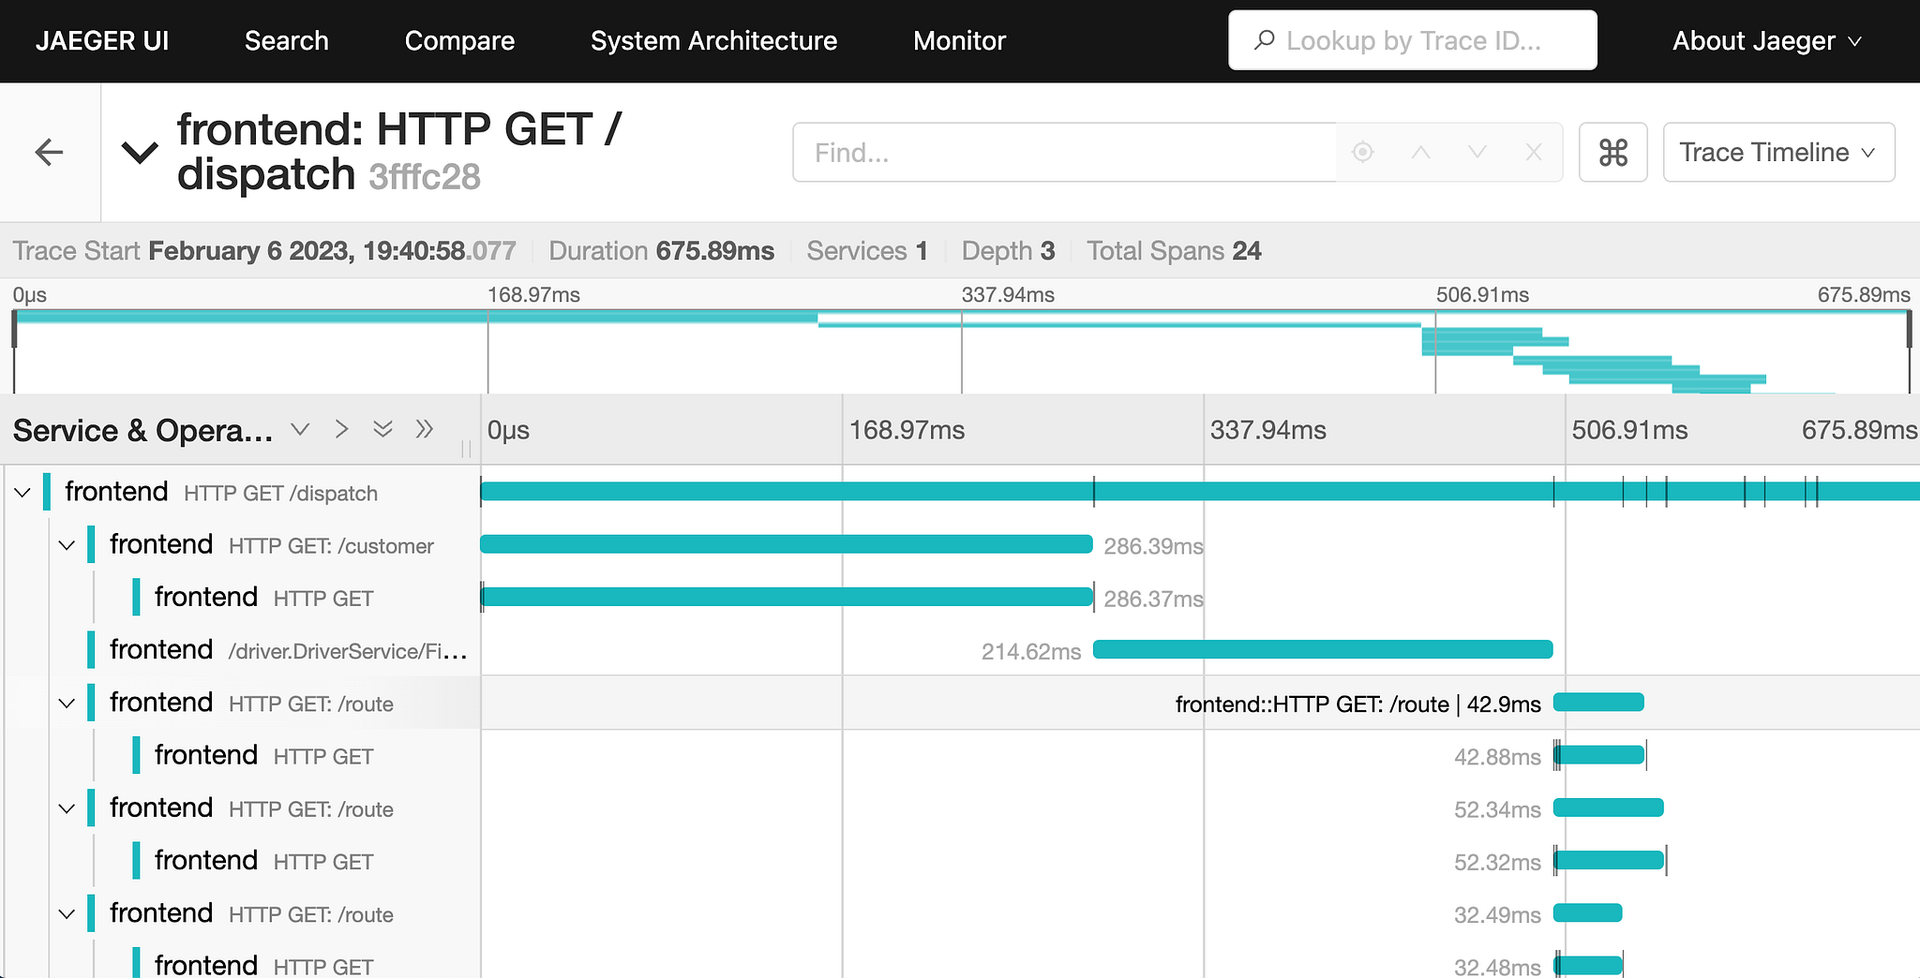
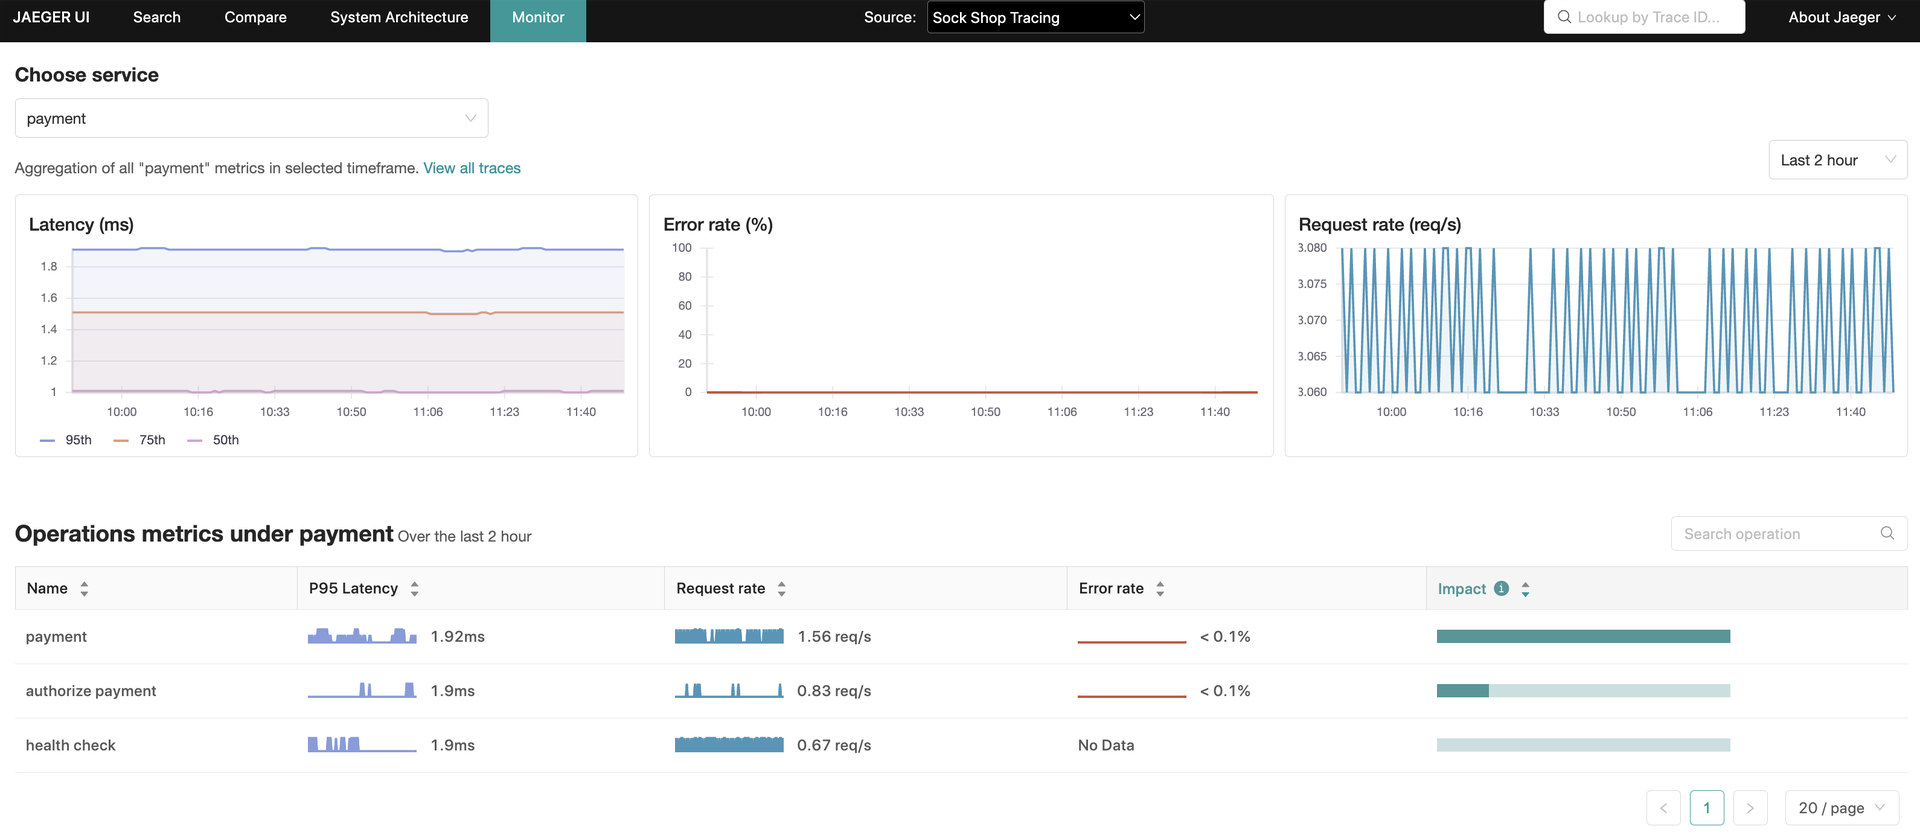
Created by Uber Technologies and graduated as the seventh CNCF top-level project in October 2019 with over 23,000 GitHub stars, Jaeger has become one of the most widely deployed open-source distributed tracing platforms, processing billions of spans per day in production environments at organizations including Uber, Red Hat, and Shopify. Version 2 rebuilt the platform on the OpenTelemetry Collector framework, inheriting its extensible pipeline architecture while implementing Jaeger-specific features as extensions and components, enabling seamless integration with the OpenTelemetry ecosystem through native OTLP protocol support. The platform stores traces in Cassandra 4.0+, Elasticsearch 7.x/8.x, OpenSearch 1.0+, ClickHouse, or the embedded Badger database for development setups. Three sampling strategies control trace volume: head-based sampling with constant, probabilistic, and rate-limiting modes, tail-based sampling using the OpenTelemetry Collector processor that evaluates complete traces before storage decisions, and adaptive sampling that dynamically adjusts probabilities based on observed traffic patterns. Service Performance Monitoring computes RED metrics directly from spans, displaying request rates, error rates, and latency percentiles in the Monitor tab with drill-down from aggregate service views to individual traces. The web UI provides trace search with multi-field filtering, trace detail views with span timeline visualization, trace comparison across services, and dependency graphs mapping service relationships from actual traffic. Deployment options range from a single all-in-one binary for development to distributed collector-ingester-query configurations with Kafka intermediate buffering for production scale. Running on a dedicated VPS on RepoCloud with guaranteed CPU, RAM, and SSD, full root SSH access, and a browser serial console. Apache 2.0 licensed.

Benefits
- OpenTelemetry Native Architecture
- Built on the OpenTelemetry Collector framework with native OTLP support, inheriting extensible pipelines, auth, health checks, and seamless integration with the OpenTelemetry instrumentation ecosystem.
- Flexible Storage Backend Options
- Store traces in Cassandra, Elasticsearch, OpenSearch, or ClickHouse for production, with embedded Badger database for development and testing requiring zero external dependencies.
- Advanced Sampling Strategies
- Control trace volume with head-based constant and probabilistic sampling, tail-based evaluation of complete traces, and adaptive sampling that dynamically adjusts rates based on traffic patterns.
- Service Performance Monitoring
- Compute RED metrics from spans to visualize request rates, error rates, and latency percentiles per service and operation with drill-down to individual traces.
Features
- Trace Search UI
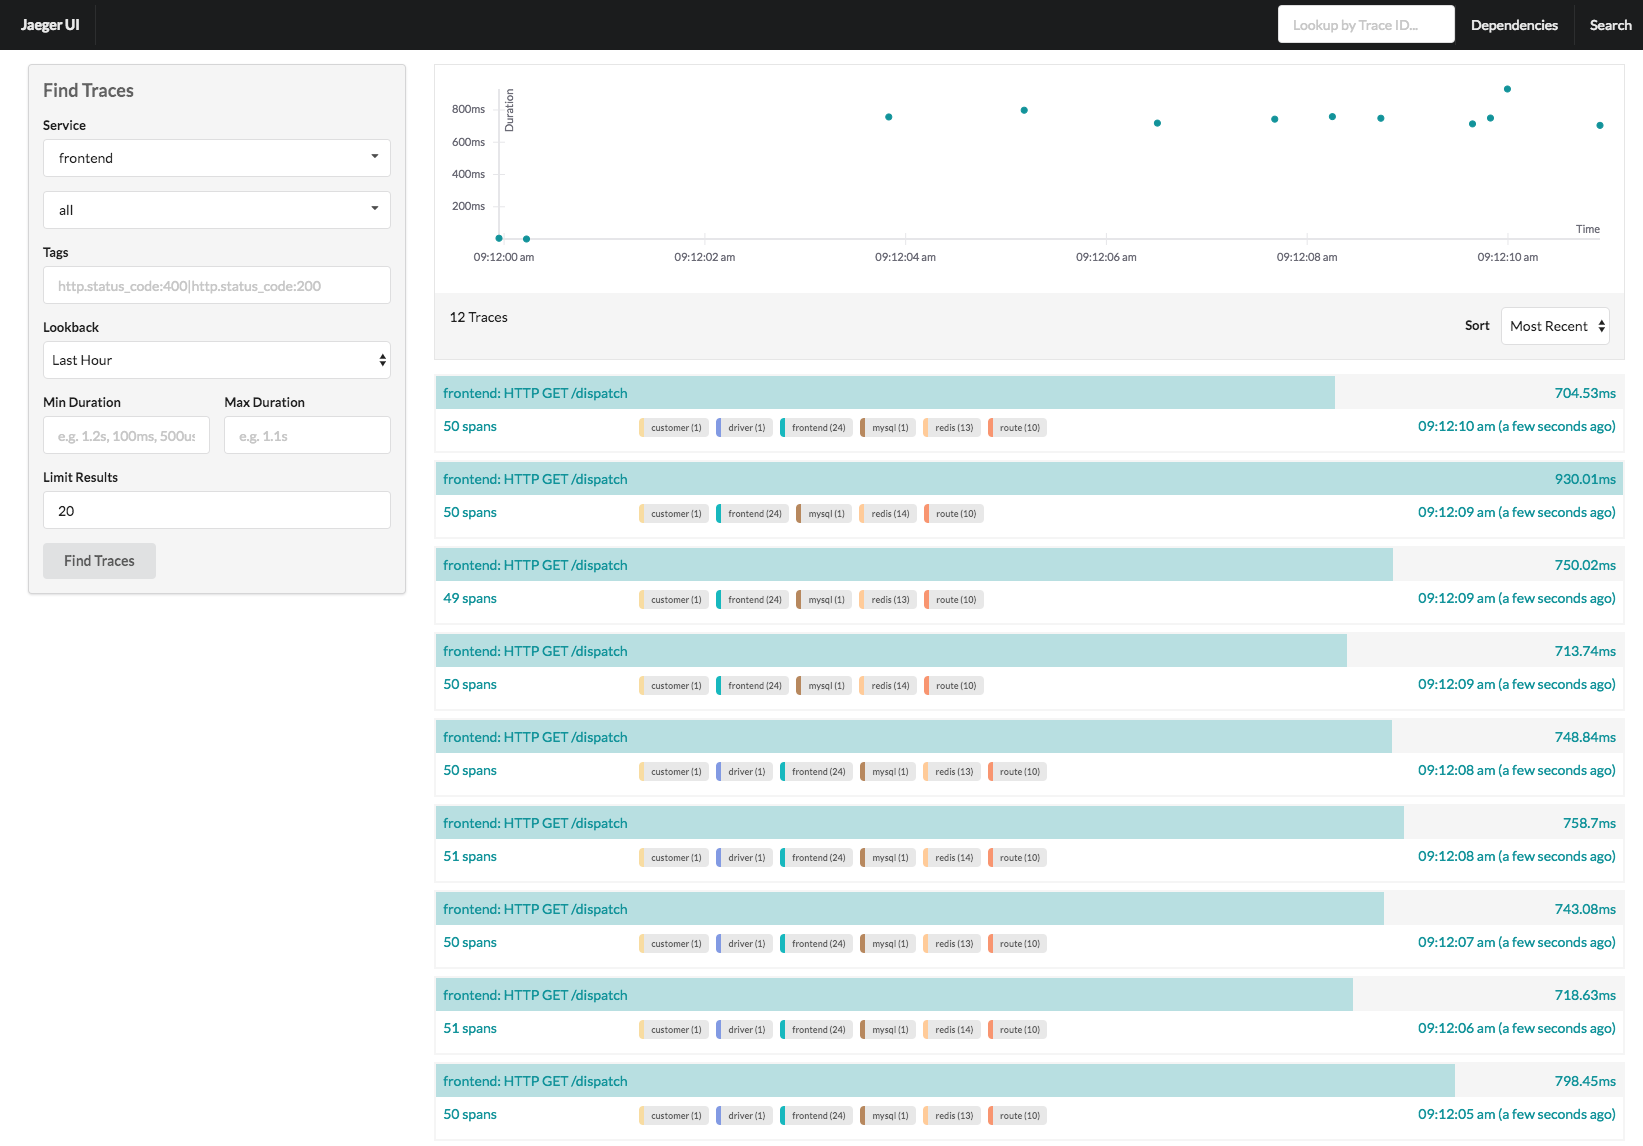
- Query traces with multi-field filters for service, operation, tags, duration, and time range with results displaying span counts, duration, and service names.
- Dependency Graph
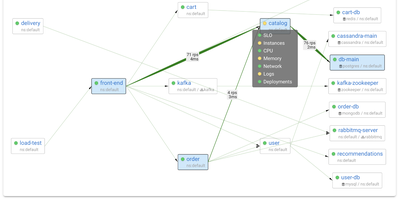
- Automatically map service relationships from observed trace data to visualize request flows, dependencies, and error propagation across distributed systems.
- Trace Comparison
- Compare two traces side by side to identify performance regressions, latency differences, and structural changes across service calls.
- Kubernetes Deployment
- Deploy with Helm charts or the OpenTelemetry Operator on Kubernetes, supporting sidecar, DaemonSet, and standalone collector topologies with horizontal scaling.
- Zipkin Compatibility
- Accept traces from Zipkin-instrumented applications in Thrift, JSON v1/v2, and Protobuf formats without requiring re-instrumentation of existing services.