Categories
Self-Hosted RAG Data Visualization Business Intelligence Data Analytics Text-to-SQL AI Data Exploration Jupyter IntegrationStars
Forks
Watchers
Developer links
Lumen
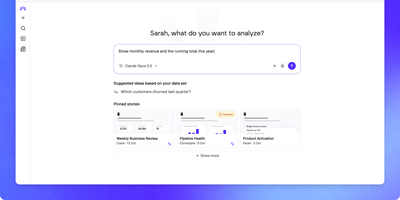
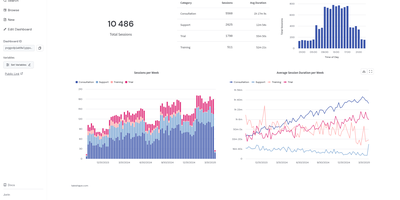
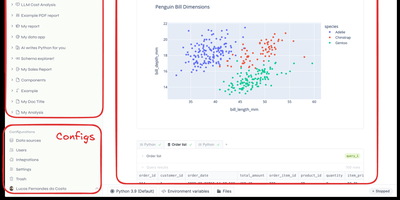
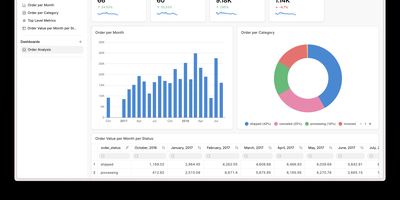
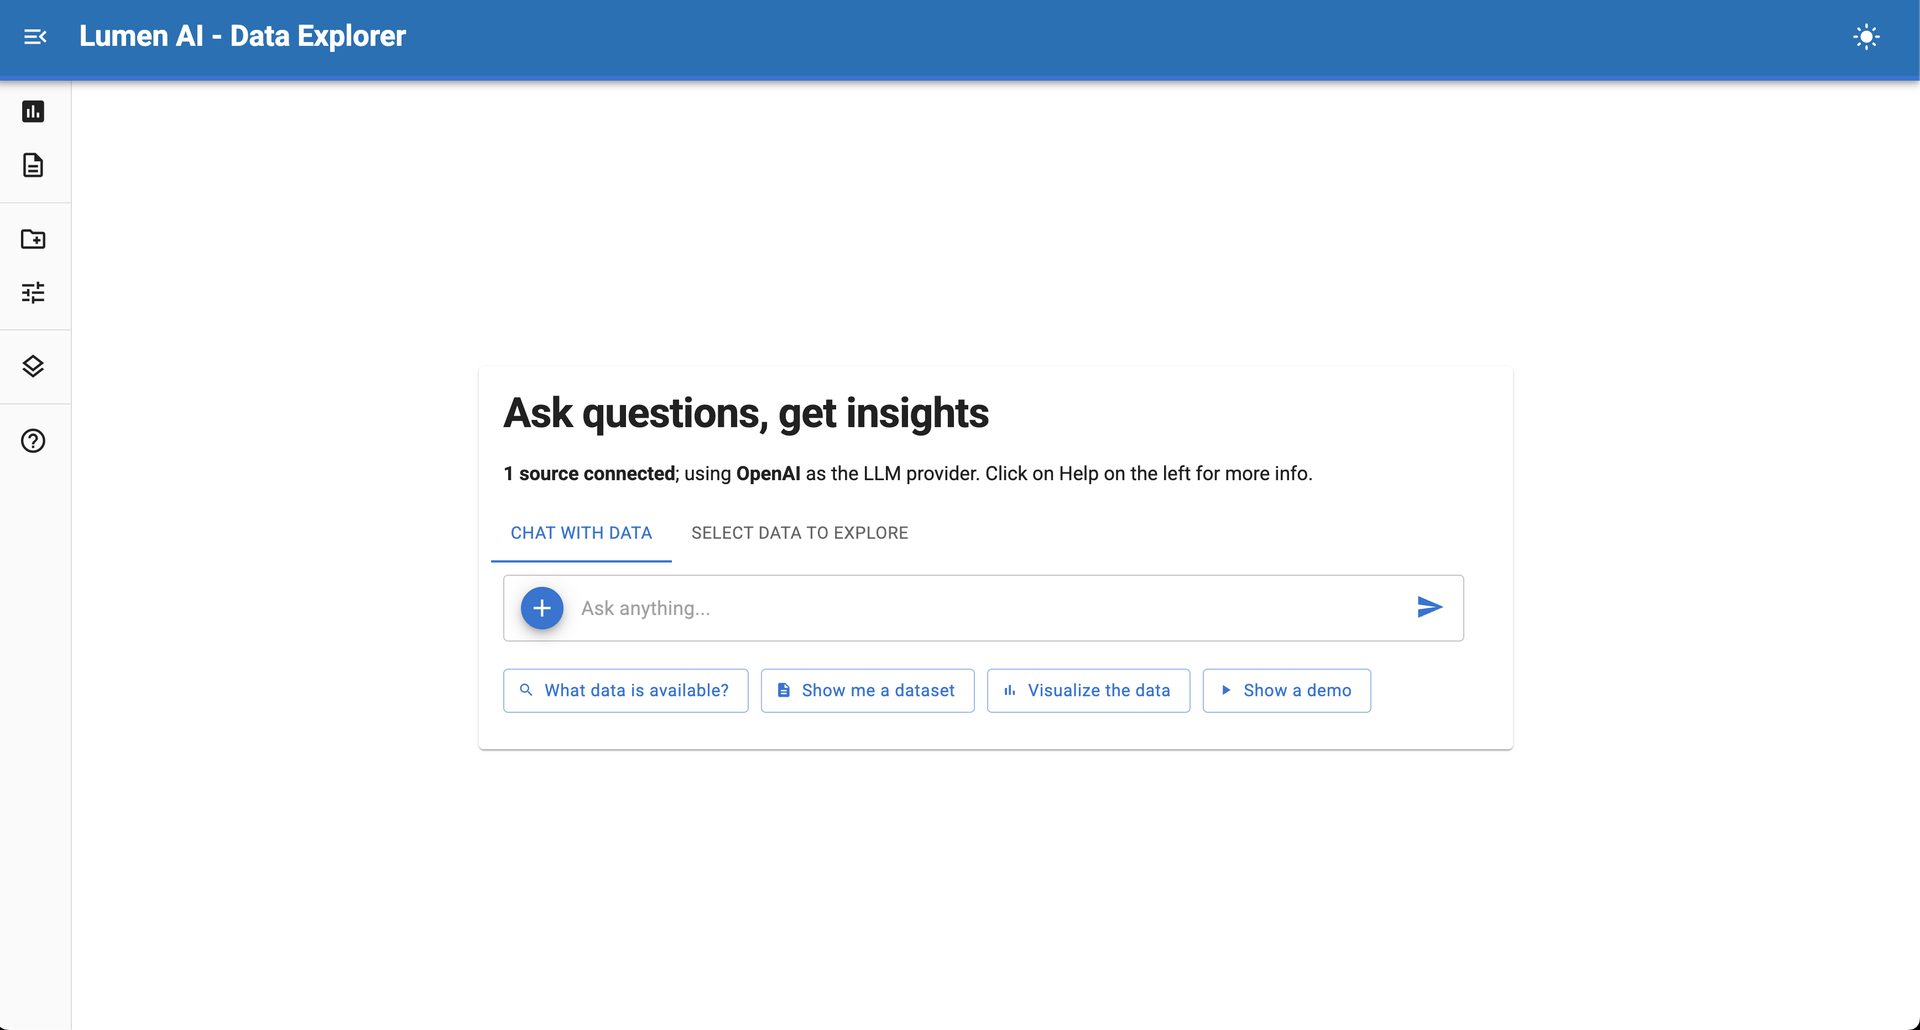
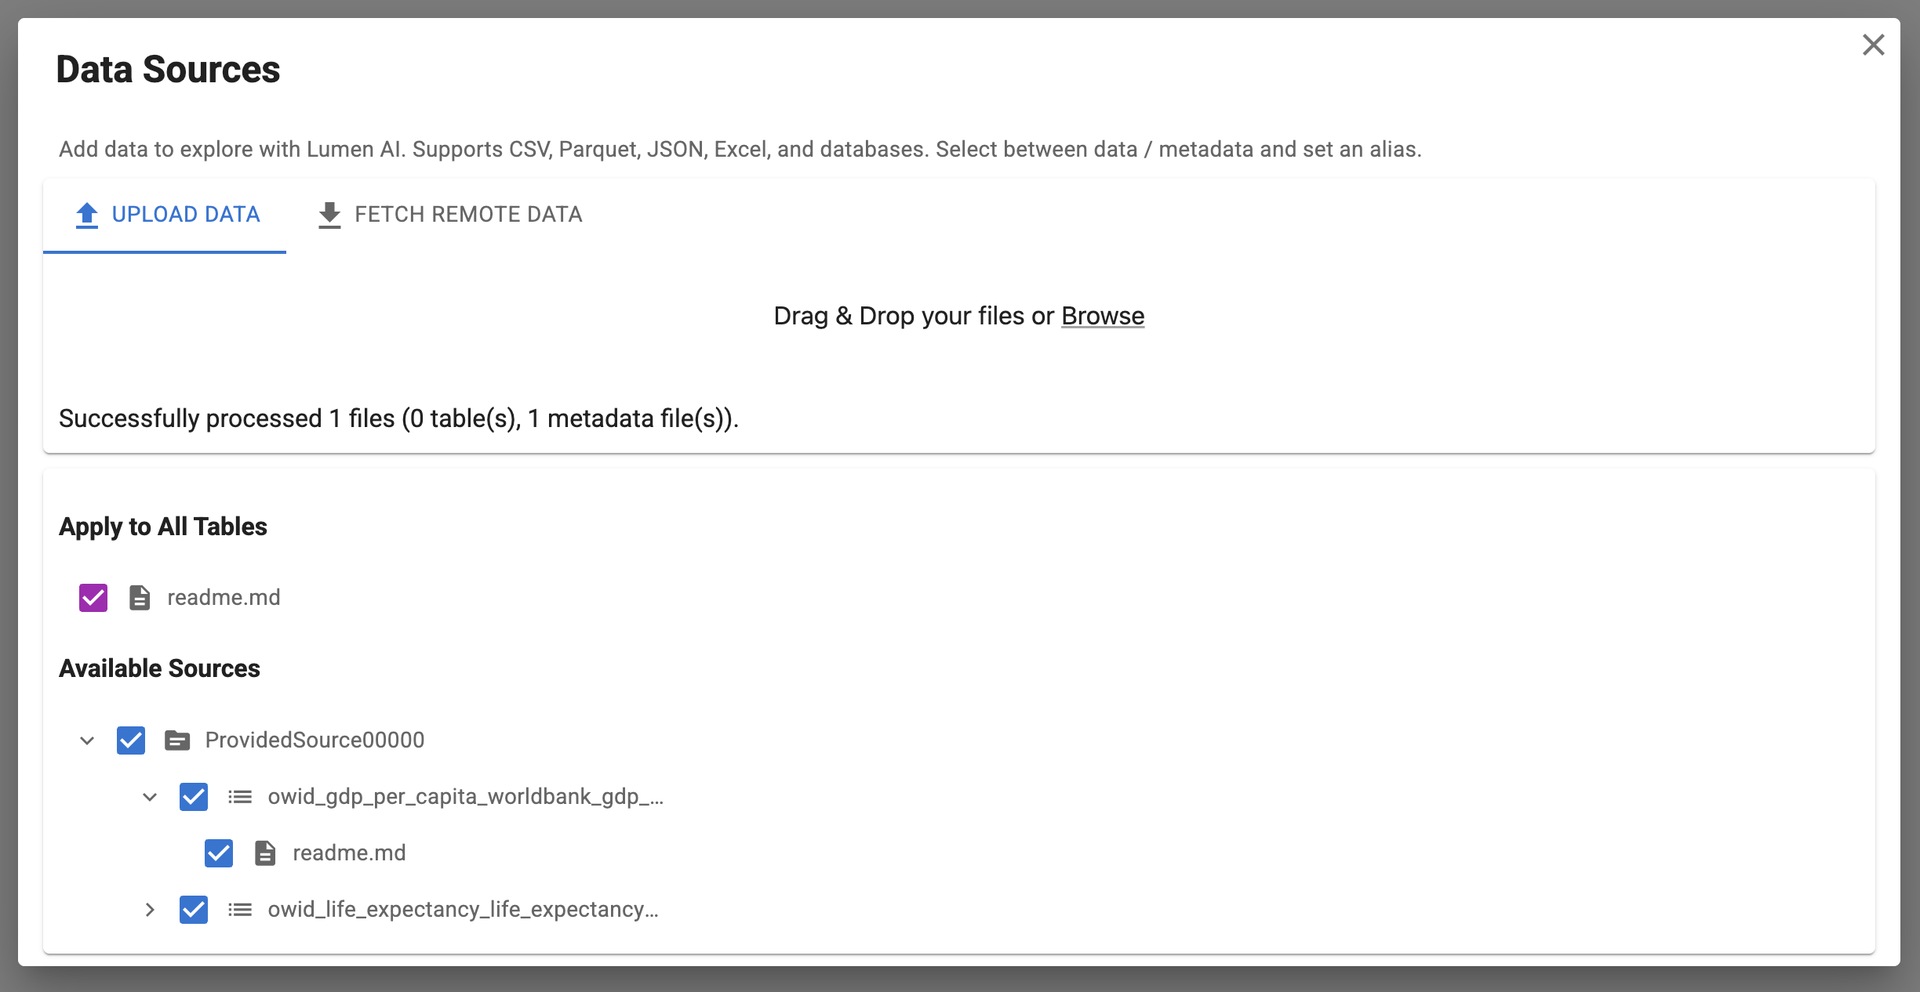
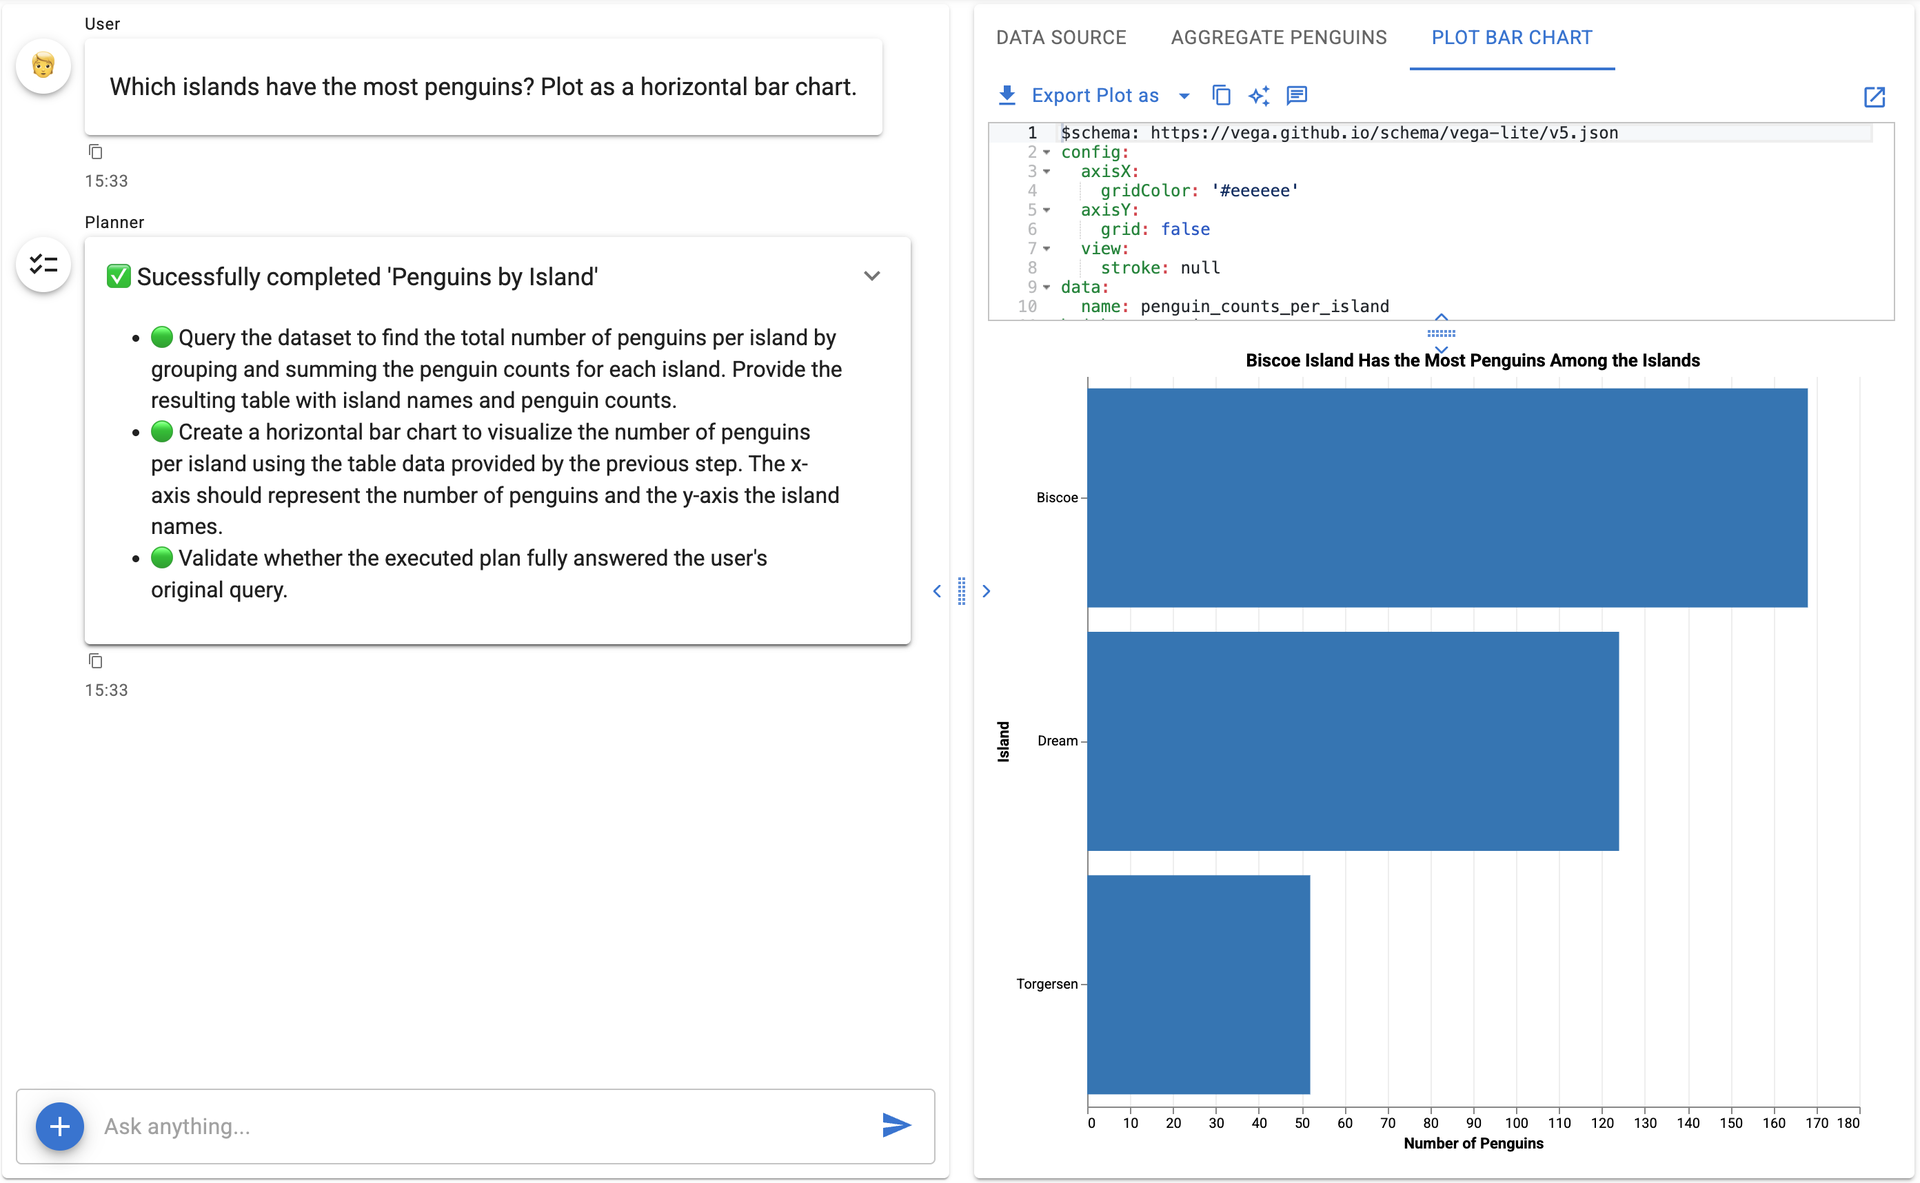
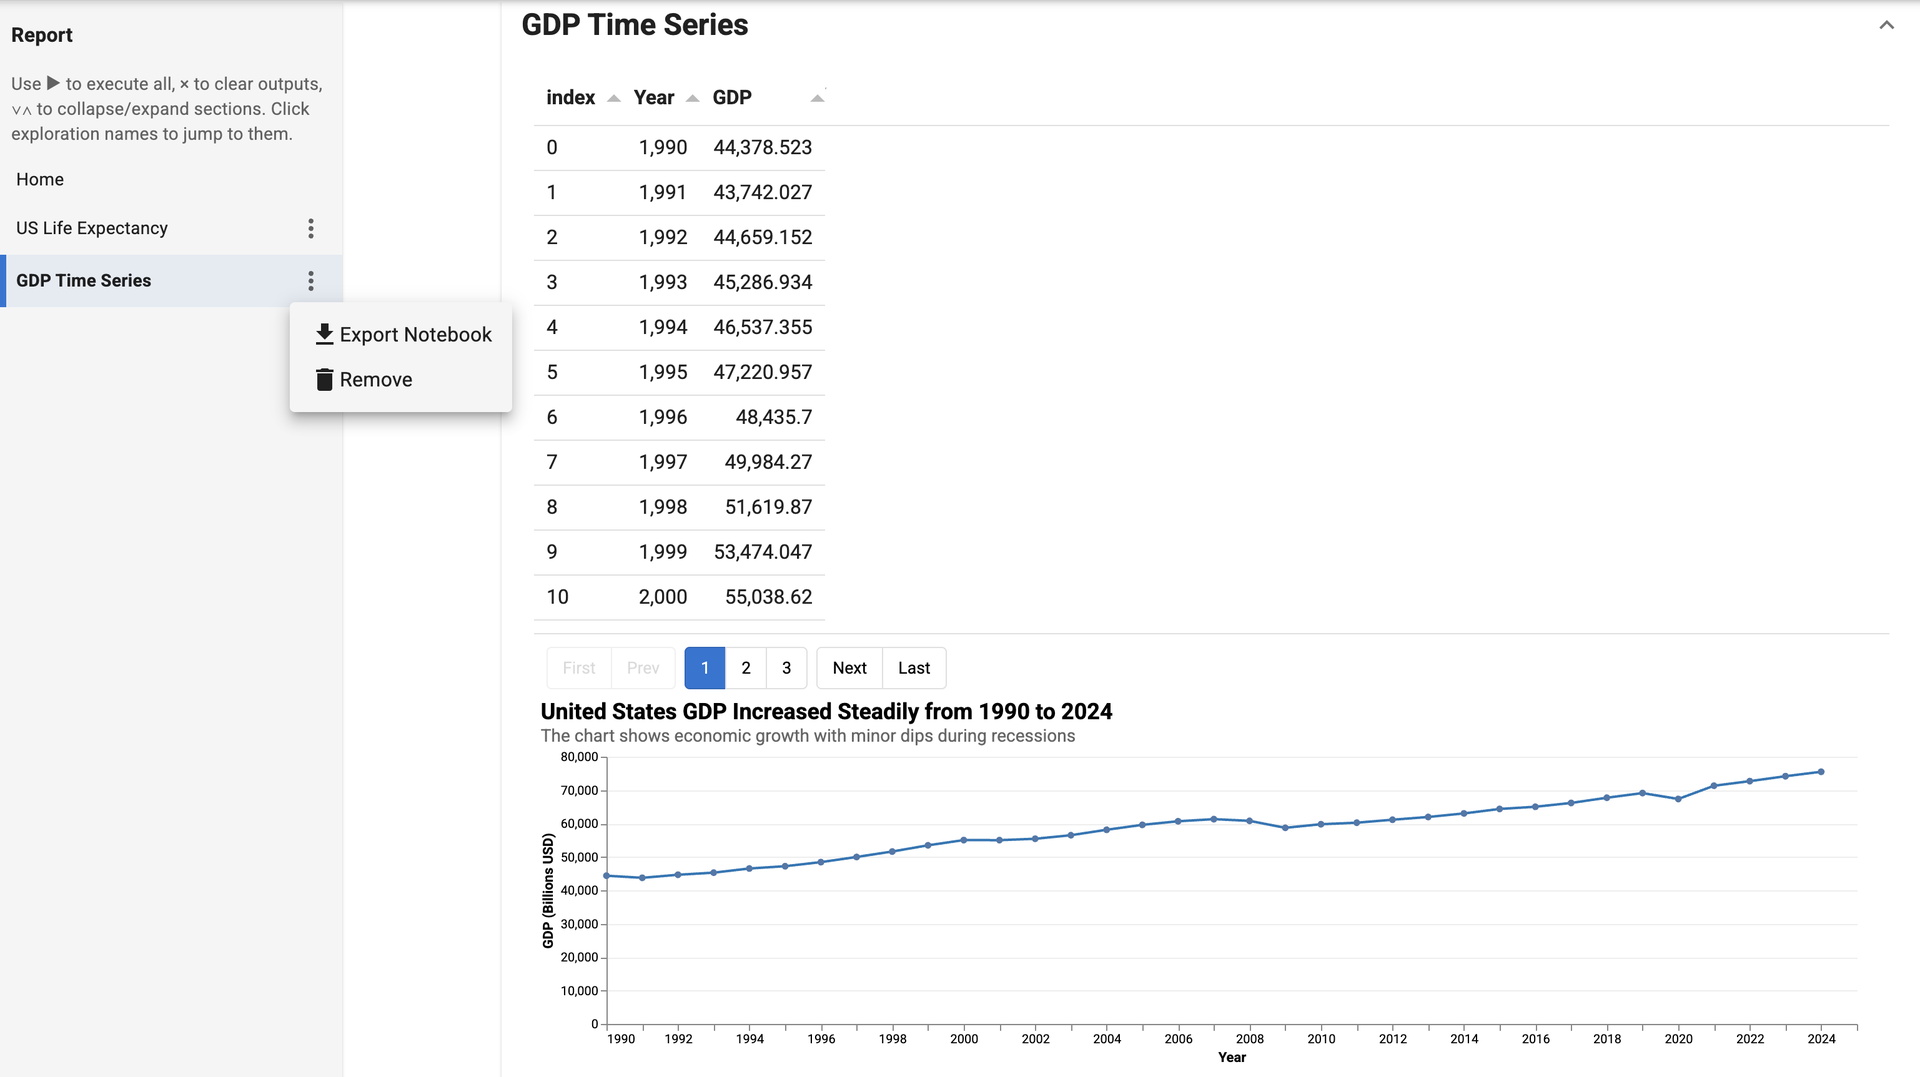
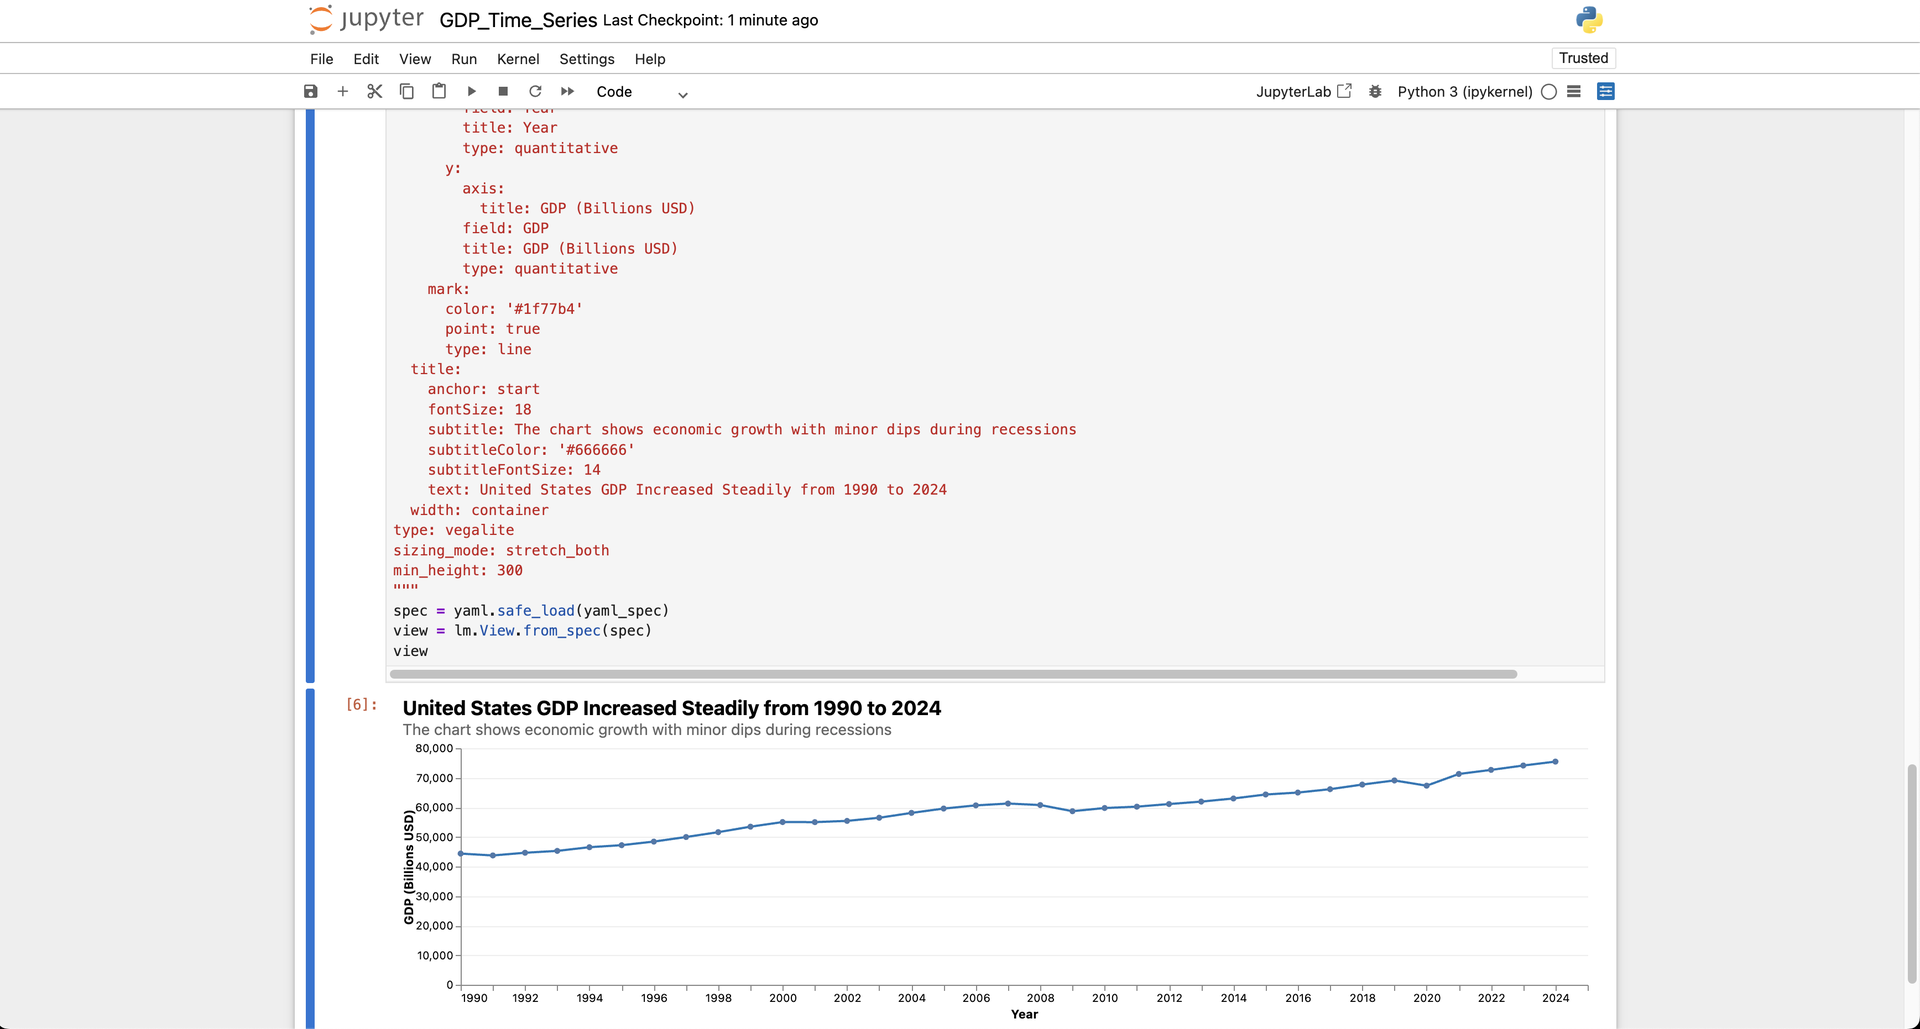
Ask Lumen which islands have the most penguins and it writes the SQL, runs it, and draws the chart in a split-screen explorer. Drag in CSV, Parquet, JSON, or Excel files, or point it at a database, and mark extra files as metadata so the model understands what each column means. Every answer lands in its own exploration, with follow-up questions nested beneath it, and the generated SQL or Vega-Lite chart specification sits in an editor you can change to update the view instantly. Tables sort, filter, and paginate, charts carry tooltips and annotations, and results export as CSV, Excel, PNG, or PDF. Report mode gathers all explorations into one document that downloads as a notebook with every question, query, and visualization ready to rerun. A planner agent breaks hard questions into steps, a validation pass checks that the answer matches the request, and settings choose among OpenAI, Anthropic, Ollama, and other language model providers. Developers can add custom agents, tools, and analyses, or write declarative specifications that become shareable dashboards. Running on a dedicated VPS on RepoCloud with guaranteed CPU, RAM, and SSD, full root SSH access, and a browser serial console. BSD-3-Clause licensed.
Benefits
- Answers From Plain-English Questions
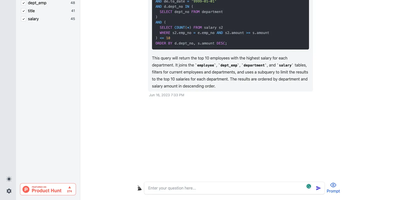
- Analysts and non-programmers can query tables by asking questions, then read the generated SQL, so insights arrive quickly without hiding how each number was produced.
- Edit Every Generated Result
- SQL and chart specifications open in a live editor, so when the model is slightly wrong you fix the query by hand rather than starting the analysis over.
- Keep Your Own Language Model
- Connect OpenAI, Anthropic, Ollama, or another provider from the settings panel, so sensitive datasets can stay on a local model whenever your policy demands it.
- Hand Off Work As Notebooks
- Export a single exploration or an entire report as a Jupyter notebook, giving colleagues reproducible code, charts, and questions they can run and extend themselves.
Features
- Chat With Your Data
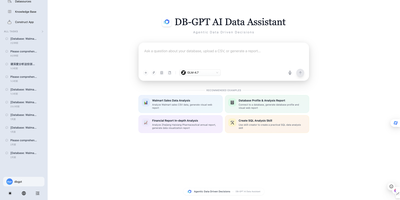
- Type a question on the splash screen and a planner agent writes the queries and builds the visualizations, with quick-start prompts for first-time users.
- Multi-Format Data Sources
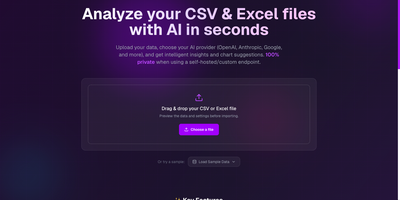
- Upload CSV, Parquet, JSON, and Excel files or fetch remote URLs, then toggle which tables the model may access and attach metadata documents.
- Explorations With Follow-Ups
- Each query creates a persistent workspace, and follow-up questions nest beneath it, so a long investigation stays organized and easy to revisit later.
- Live Code Editor
- Review and modify the SQL or Vega-Lite specification behind any result, and watch tables and charts refresh as soon as your change is applied.
- Report Mode
- Combine all explorations into one consolidated view and export the whole analysis as a single notebook for sharing, review, or scheduled reruns.
- Custom Agents And Tools
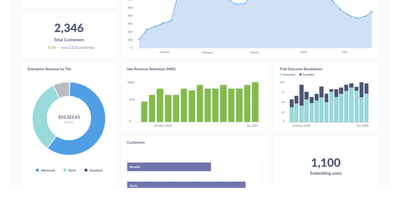
- Extend Lumen with your own agents, tools, and analyses, or declare dashboards in YAML specifications that the model can populate and teammates can share.