Categories
DevOps Monitoring Infrastructure Status Page Incident Management Server Monitoring Uptime MonitoringStars
Forks
Watchers
Developer links
Checkcle
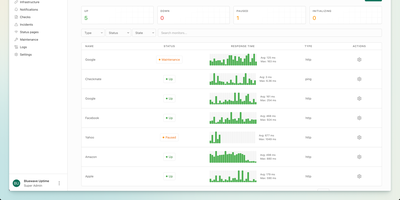
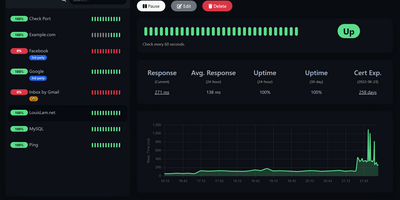
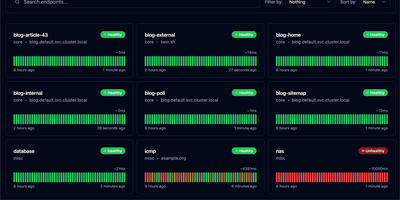
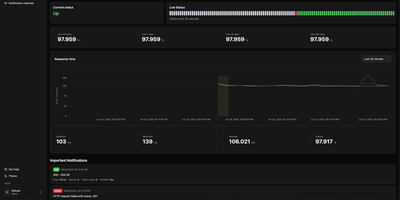
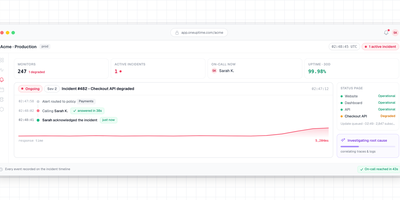
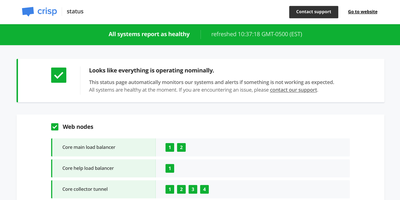
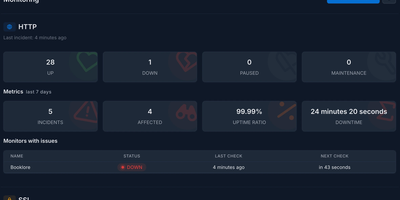
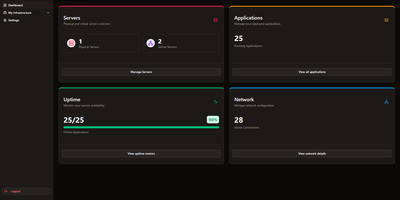
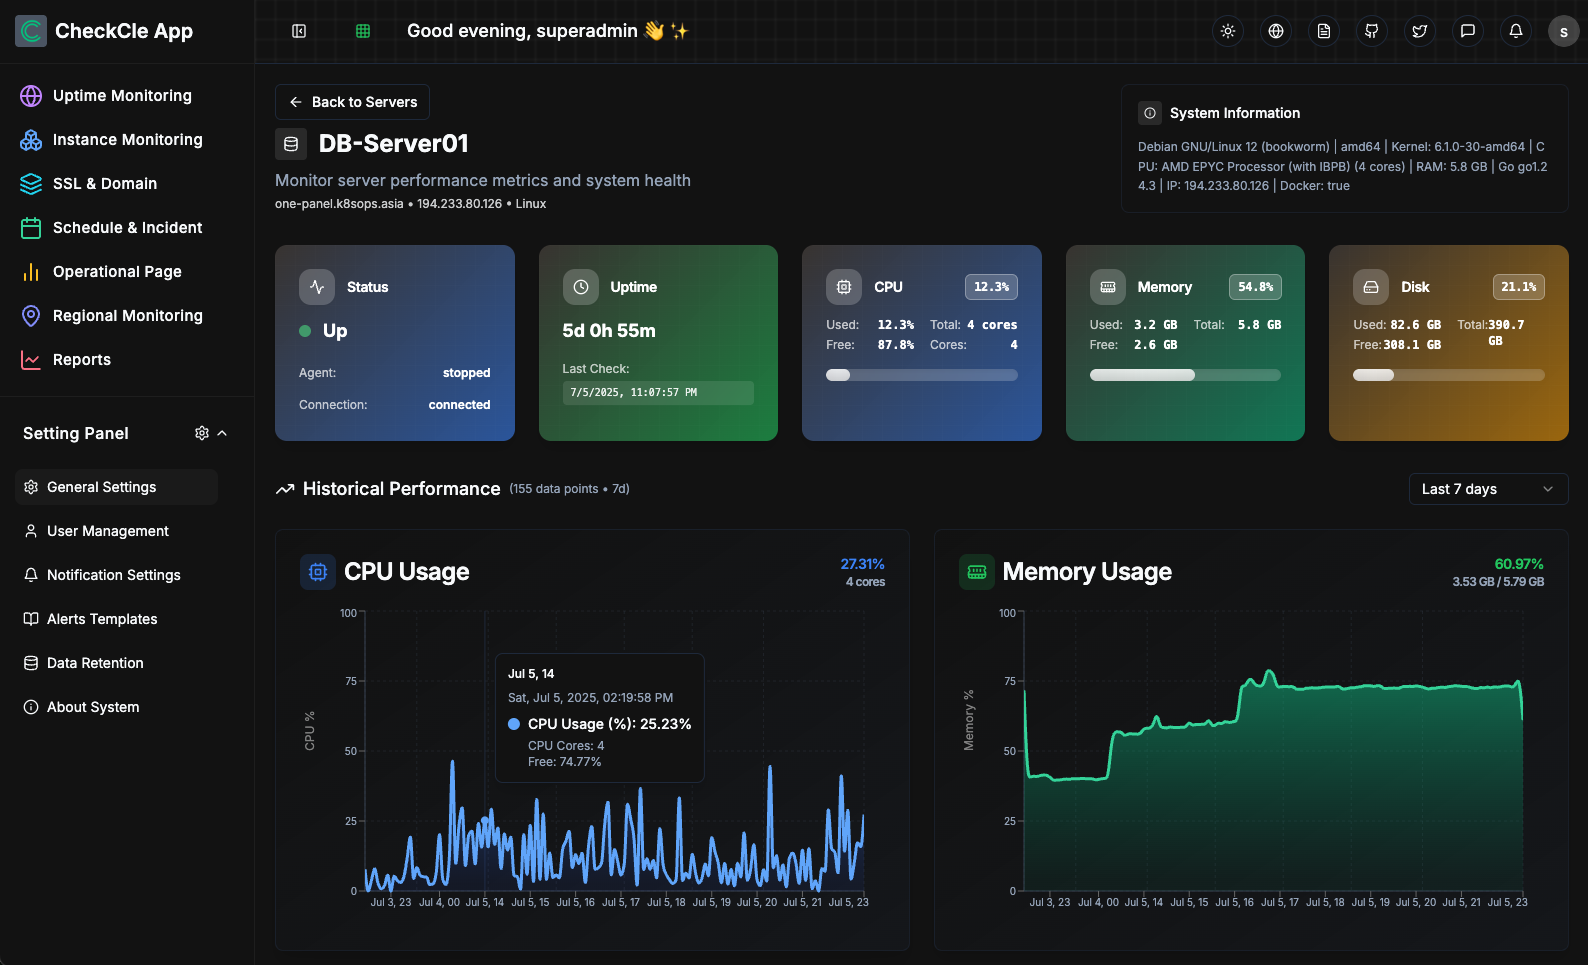
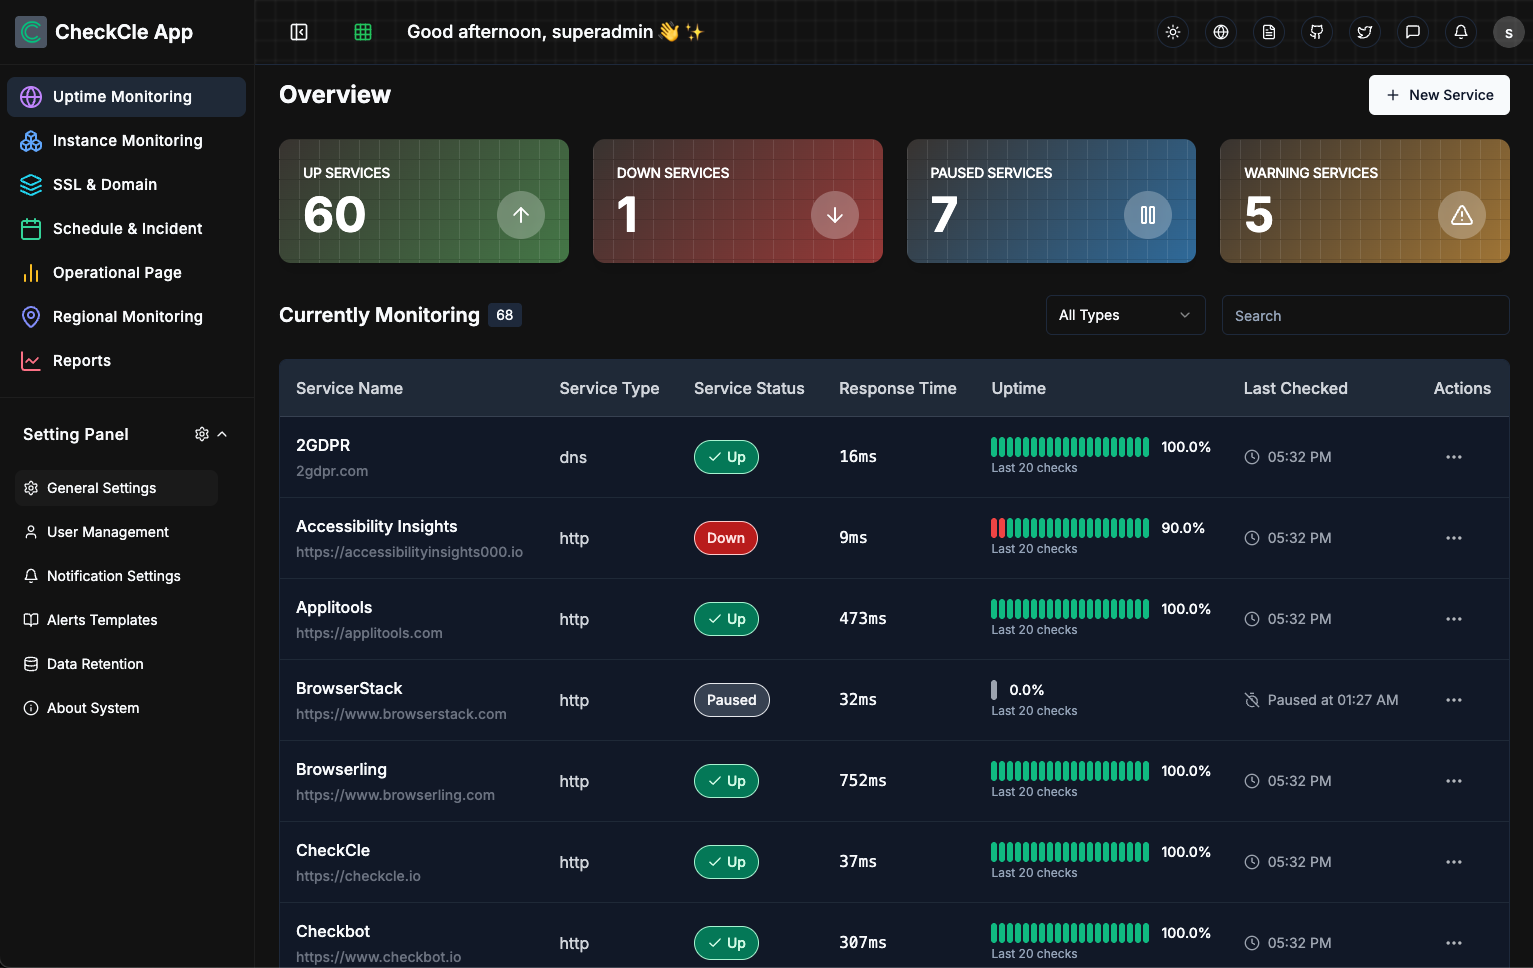
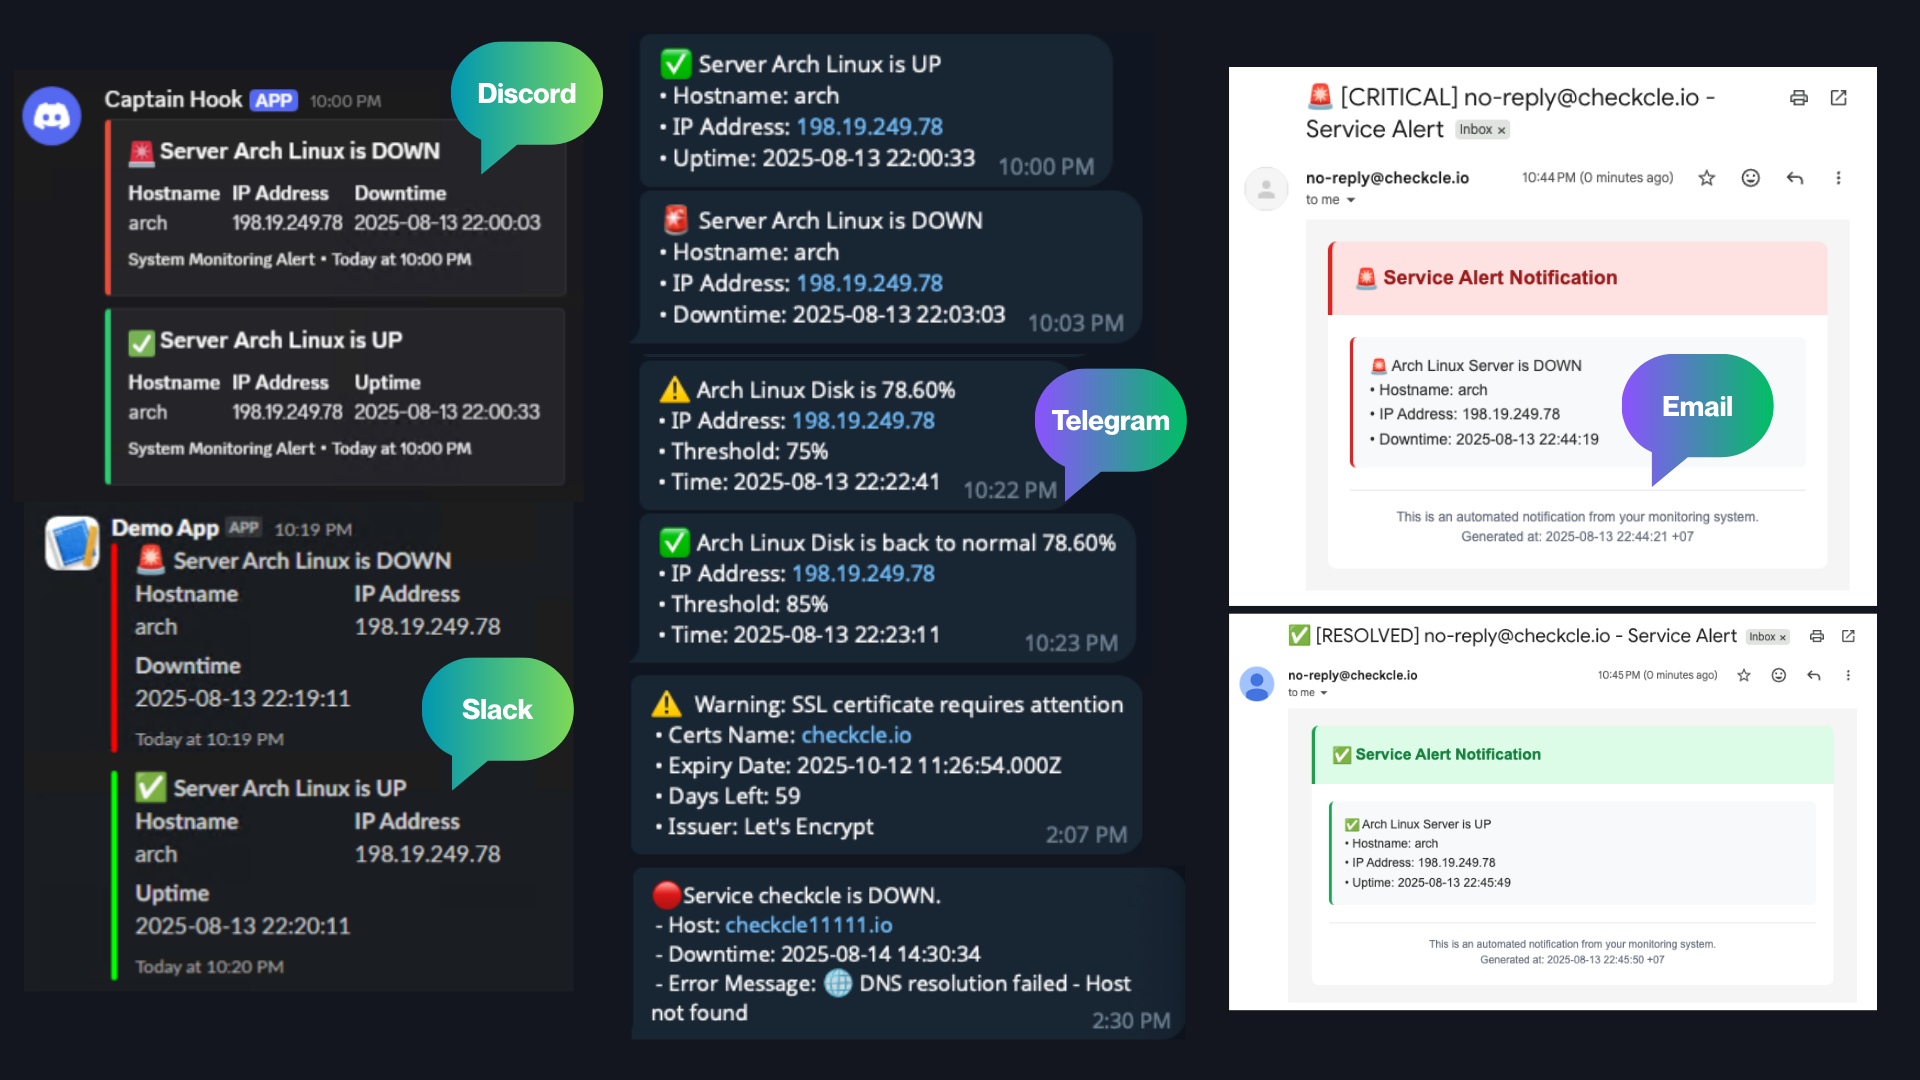
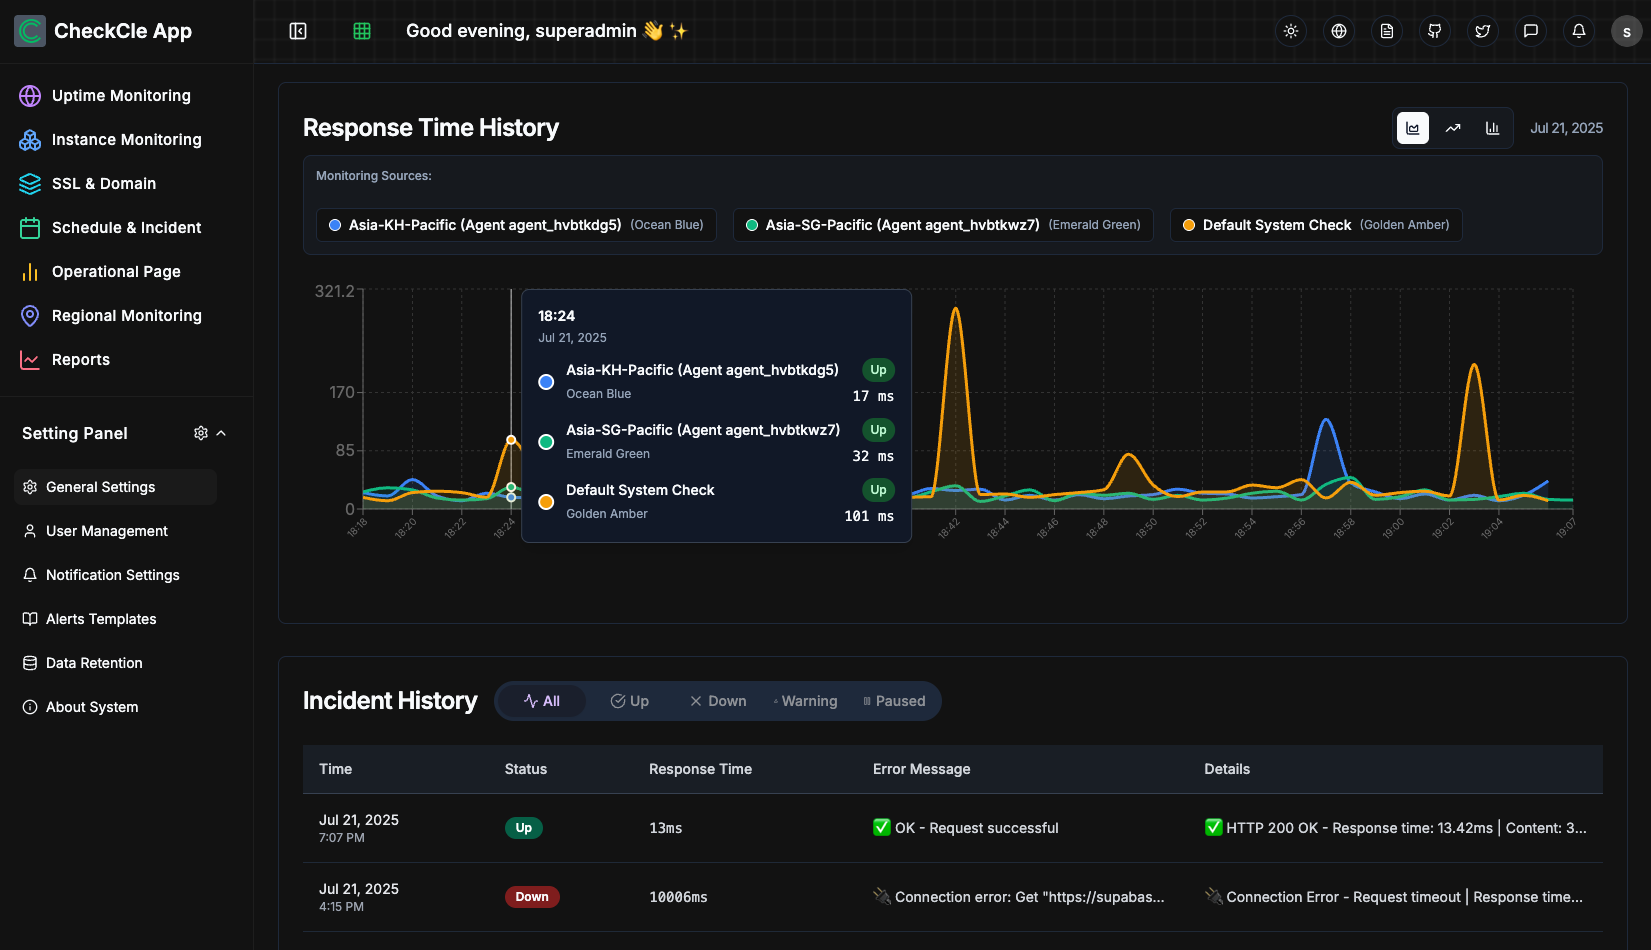
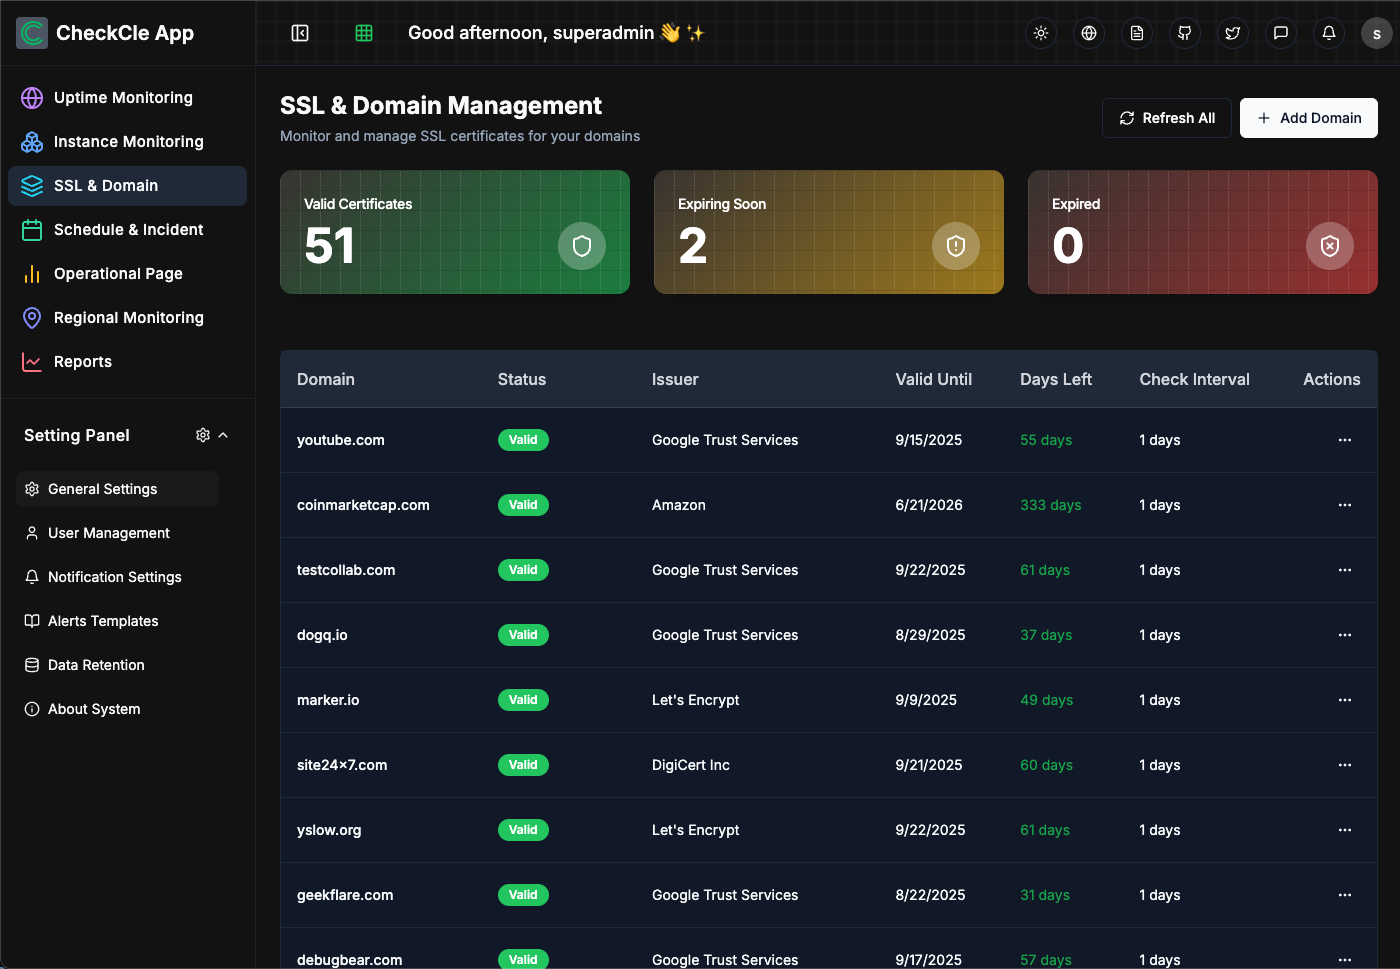
CheckCle provides a complete uptime monitoring and infrastructure observability platform that deploys with a single Docker container and stores all data in embedded SQLite via PocketBase. The Go backend runs three microservices — a service operation engine handling HTTP, HTTPS, DNS, Ping, and TCP checks at configurable intervals, a distributed regional check agent for multi-location network testing, and a server monitoring agent collecting CPU, RAM, disk usage, and network metrics via gRPC. The React frontend built with Vite, TypeScript, Tailwind CSS, and shadcn-ui subscribes to PocketBase WebSocket endpoints for real-time dashboard updates without polling. SSL and domain monitoring tracks certificate issuers, expiration dates, days remaining, and validation status. The incident management system records UP, DOWN, WARNING, and PAUSE states with full history, while scheduled maintenance windows prevent false alerts during planned downtime. Public status pages provide external stakeholders with live service health information. Health heatmaps visualize uptime performance and outage patterns over time. Notification channels include email, Telegram, Discord, and Slack, with multiple alert targets per monitored service. The one-click agent installation script supports Debian, Ubuntu, CentOS, Red Hat, Alpine, and Windows in beta. Docker deployment runs on port 8090 with a single persistent volume at /mnt/pb_data, requiring minimum 1 vCPU and 500MB RAM. On RepoCloud, deploy CheckCle on a dedicated VPS with root SSH access, persistent storage for your monitoring database, and complete control over agent endpoints and notification configurations, all under the MIT license.
Benefits
- Single Binary Monitoring Stack
- PocketBase bundles the REST API, authentication, real-time WebSocket subscriptions, and SQLite database into one executable, eliminating the need for external databases, message queues, or separate API servers.
- Distributed Multi-Region Checks
- Deploy lightweight regional agents across geographic locations to verify service availability from multiple network perspectives, detecting routing issues and regional outages that single-point monitoring misses.
- Full Infrastructure Visibility
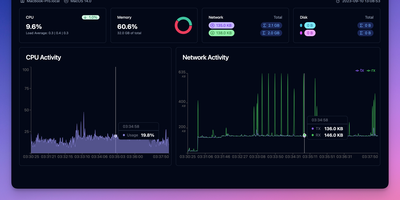
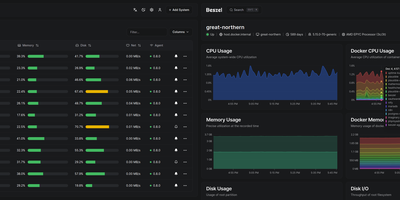
- Server monitoring agents collect CPU utilization, memory usage, disk I/O, and network activity metrics via gRPC, providing infrastructure-level observability alongside application uptime tracking in one unified dashboard.
- Instant Alert Notifications
- Route downtime alerts through email, Telegram, Discord, and Slack channels with support for multiple notification targets per service, ensuring the right team members receive immediate incident notifications.
Features
- Multi-Protocol Monitoring
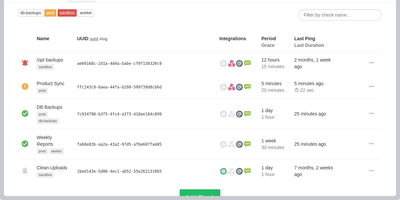
- Monitor HTTP, HTTPS, DNS, Ping, TCP, FTP, and SMTP services with configurable check intervals, response time tracking, and health heatmap visualizations.
- SSL Certificate Tracking
- Track certificate issuer, expiration date, days remaining, and validation status for up to 200 domains with automated renewal alerts.
- Public Status Pages
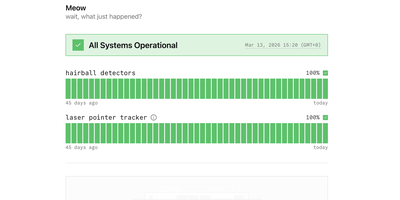
- Publish real-time service health dashboards for external stakeholders showing current uptime percentages, incident history, and scheduled maintenance windows.
- Incident Management
- Record service state transitions through UP, DOWN, WARNING, and PAUSE with full incident history, error details, and scheduled maintenance windows to suppress false alerts.
- Server Metrics Collection
- Install lightweight agents on Linux and Windows servers via one-line scripts to collect CPU, RAM, disk, and network metrics with gRPC streaming.