Categories
Data Visualization Data Collection Analytics Dashboard Public Health GIS Mapping Health Information System Health ManagementStars
Forks
Watchers
Developer links
DHIS2
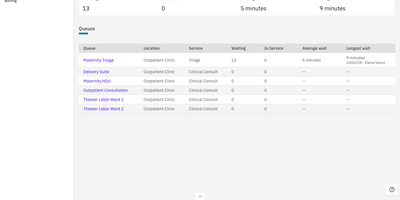
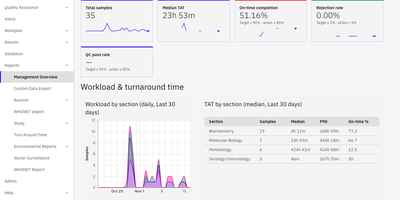
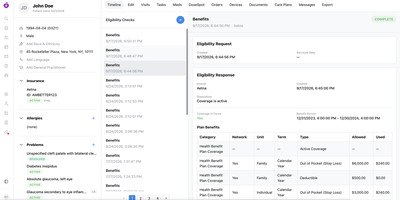
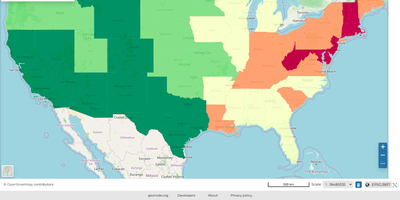
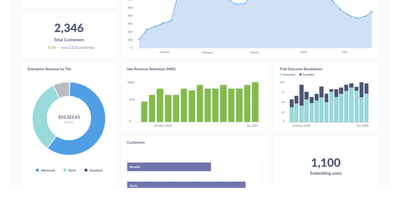
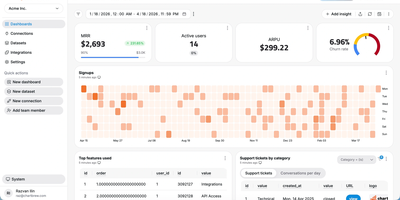
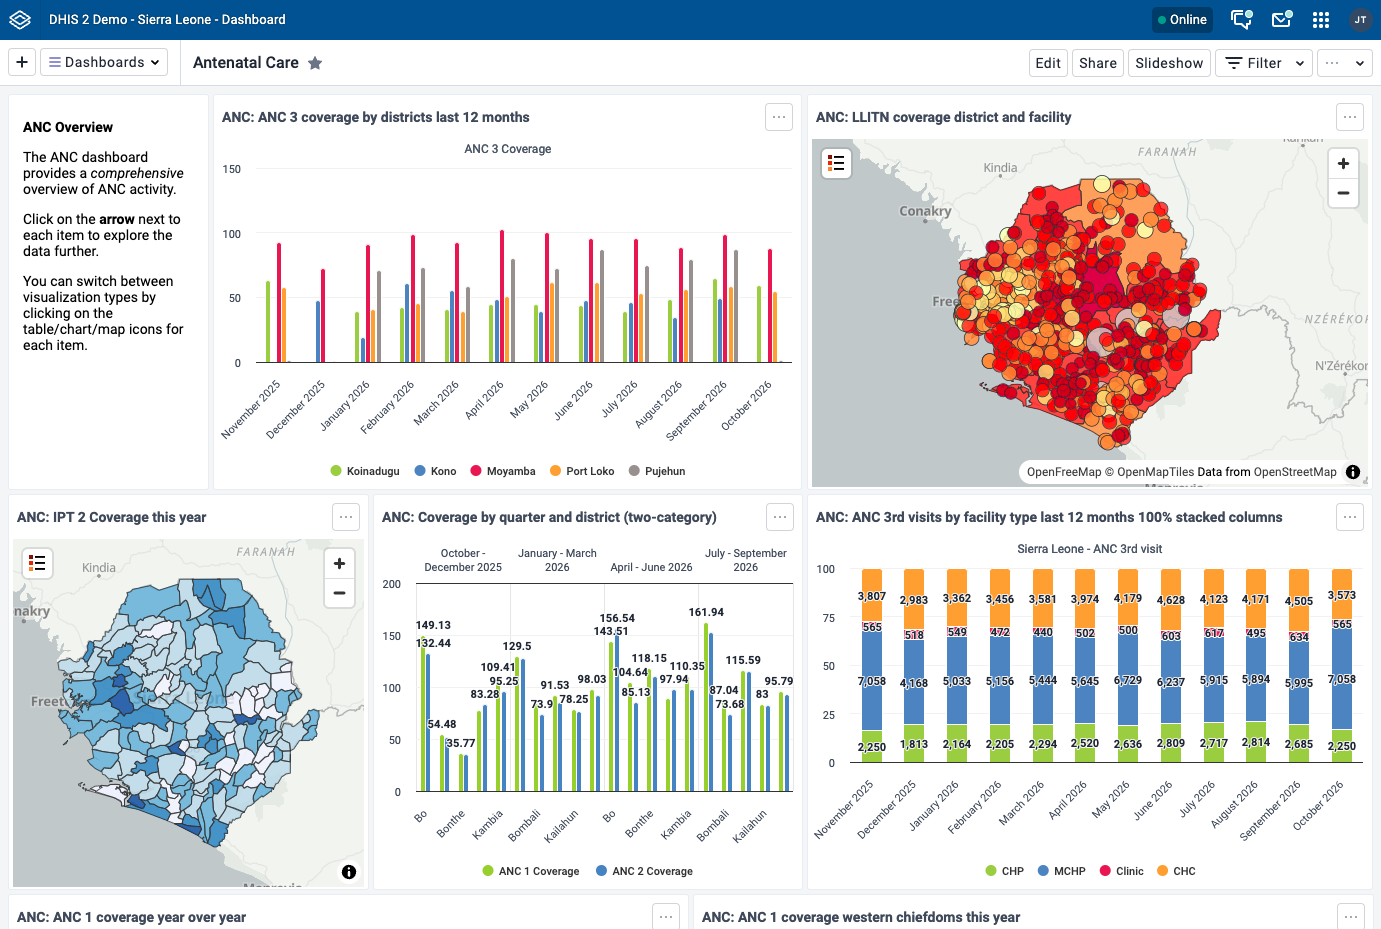
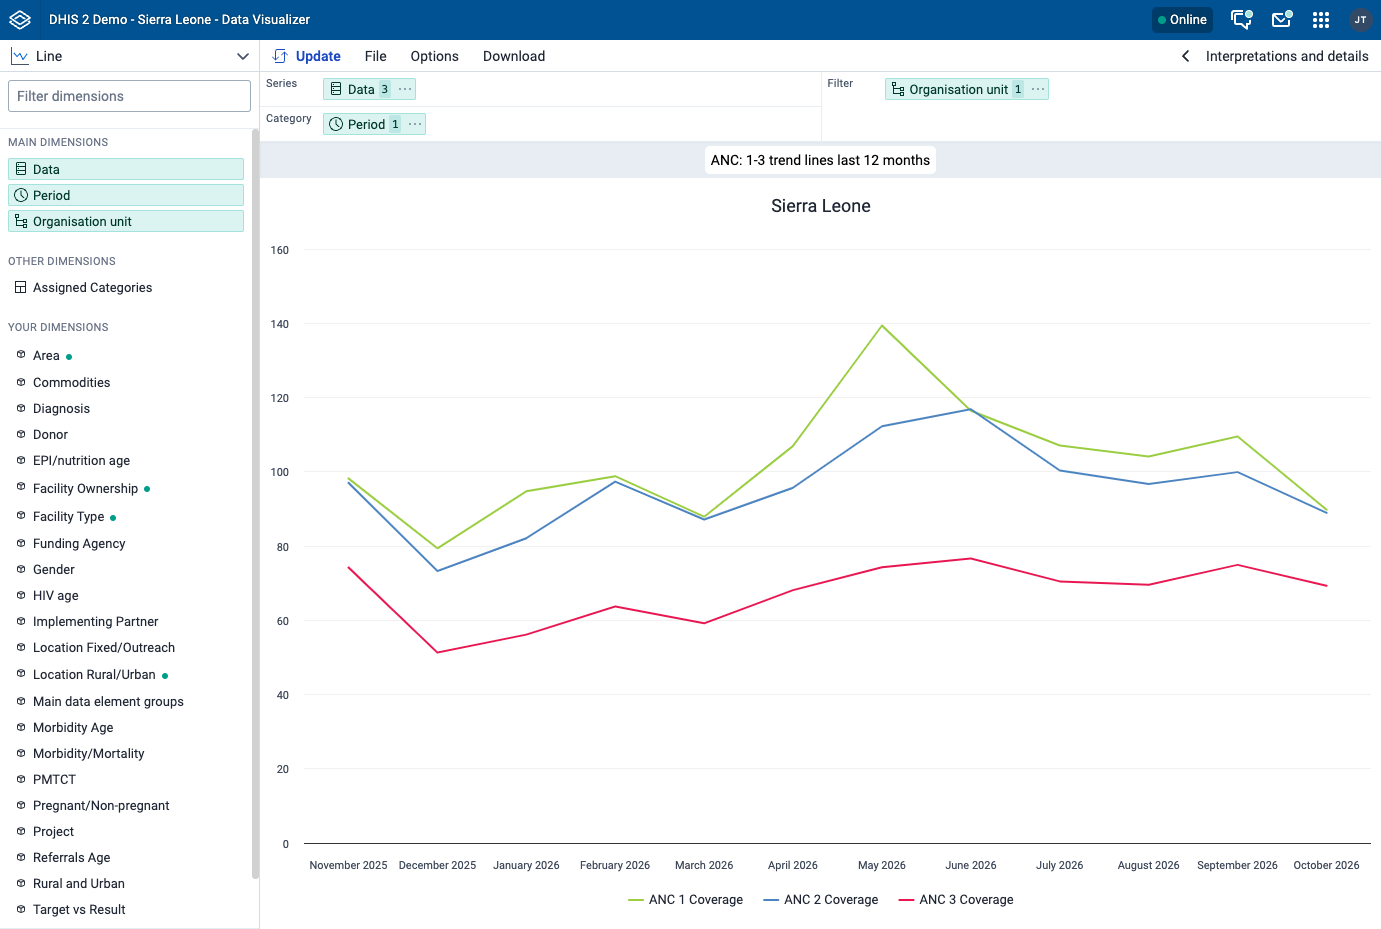
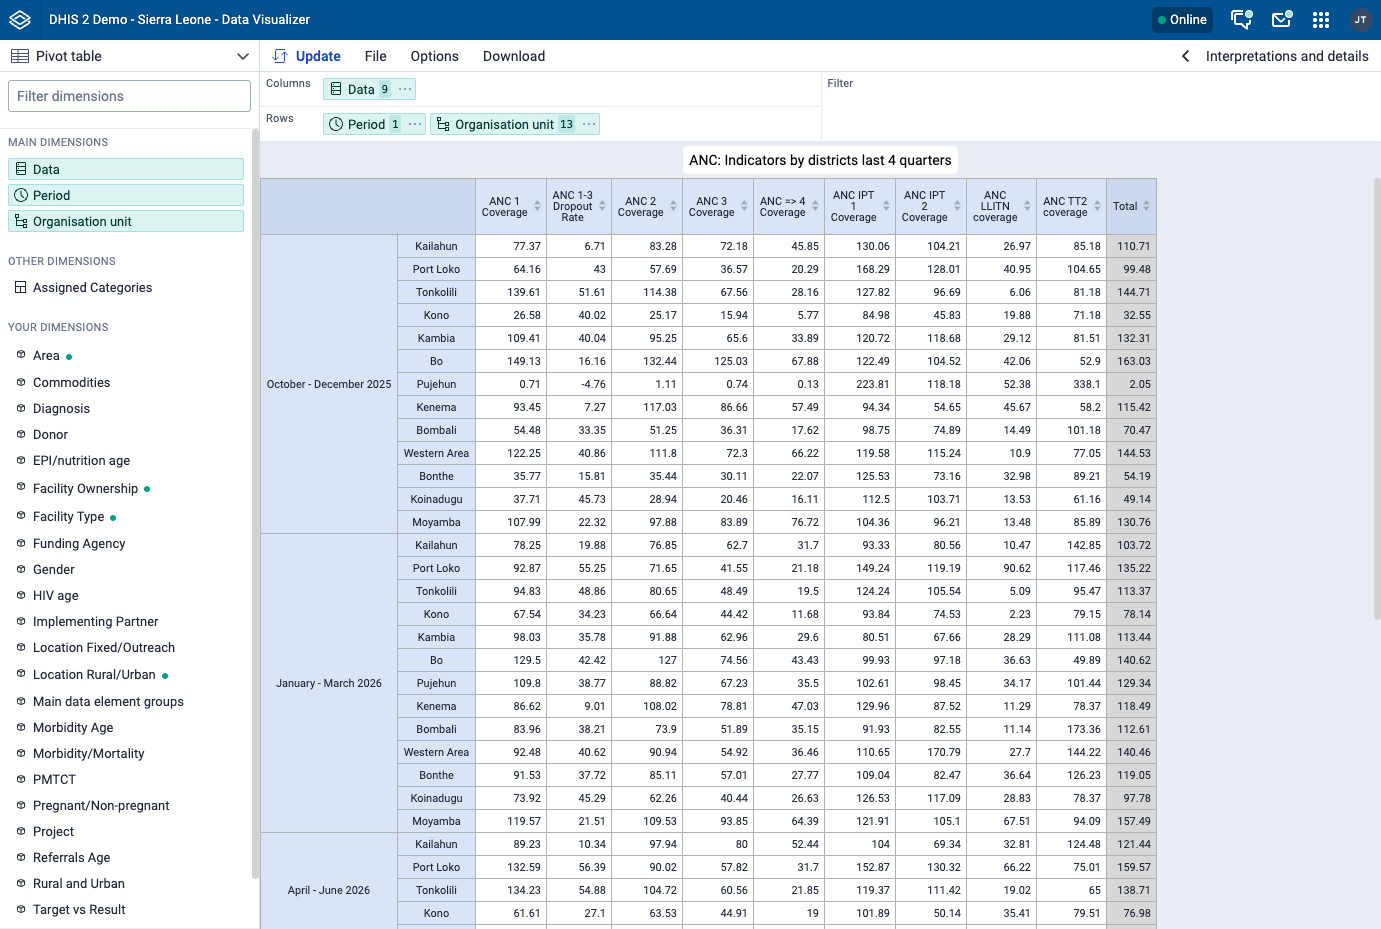
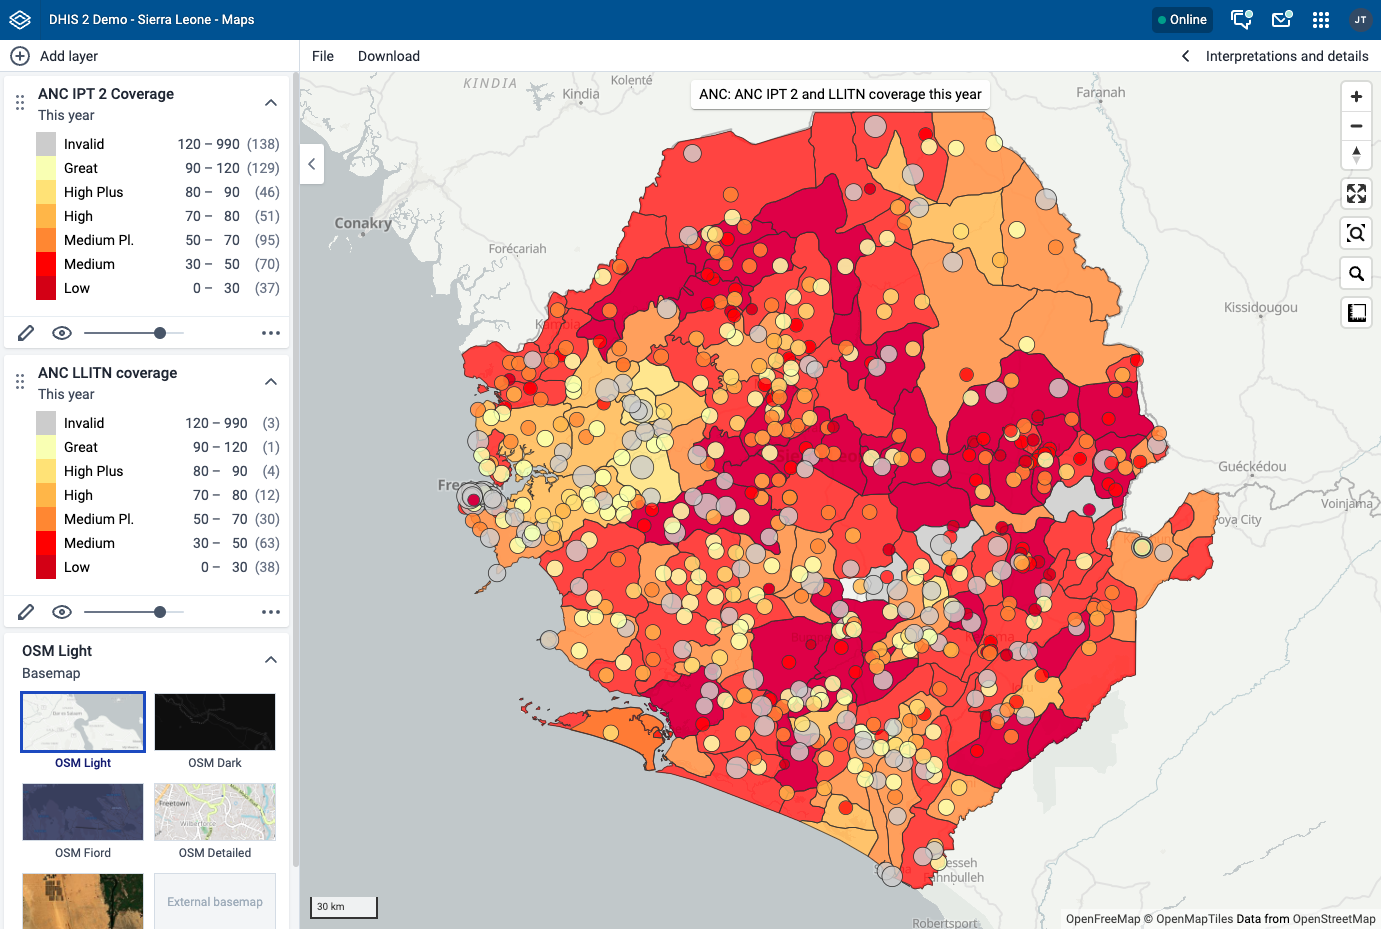
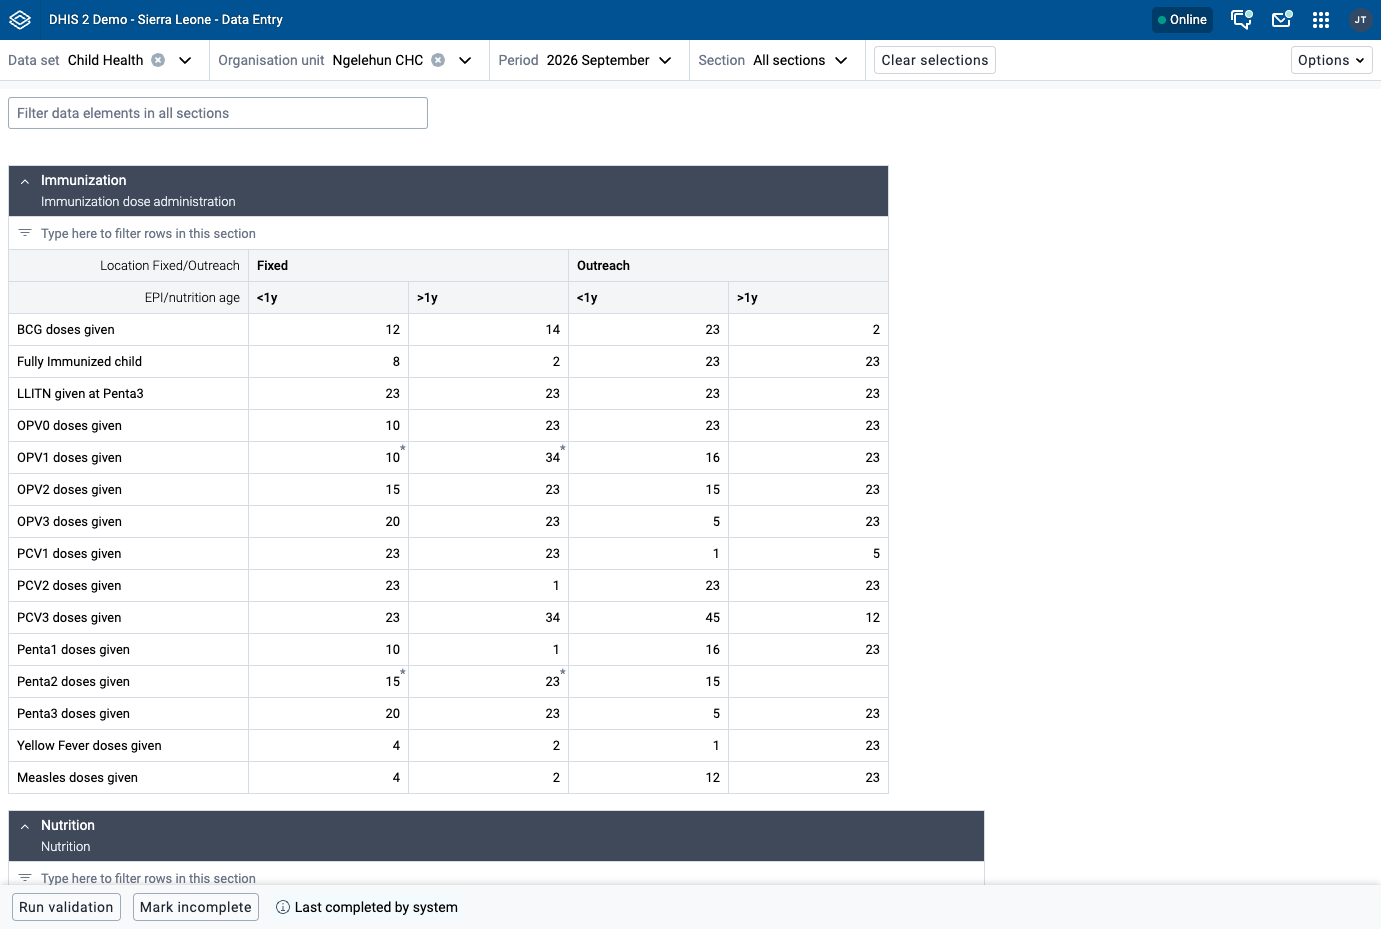
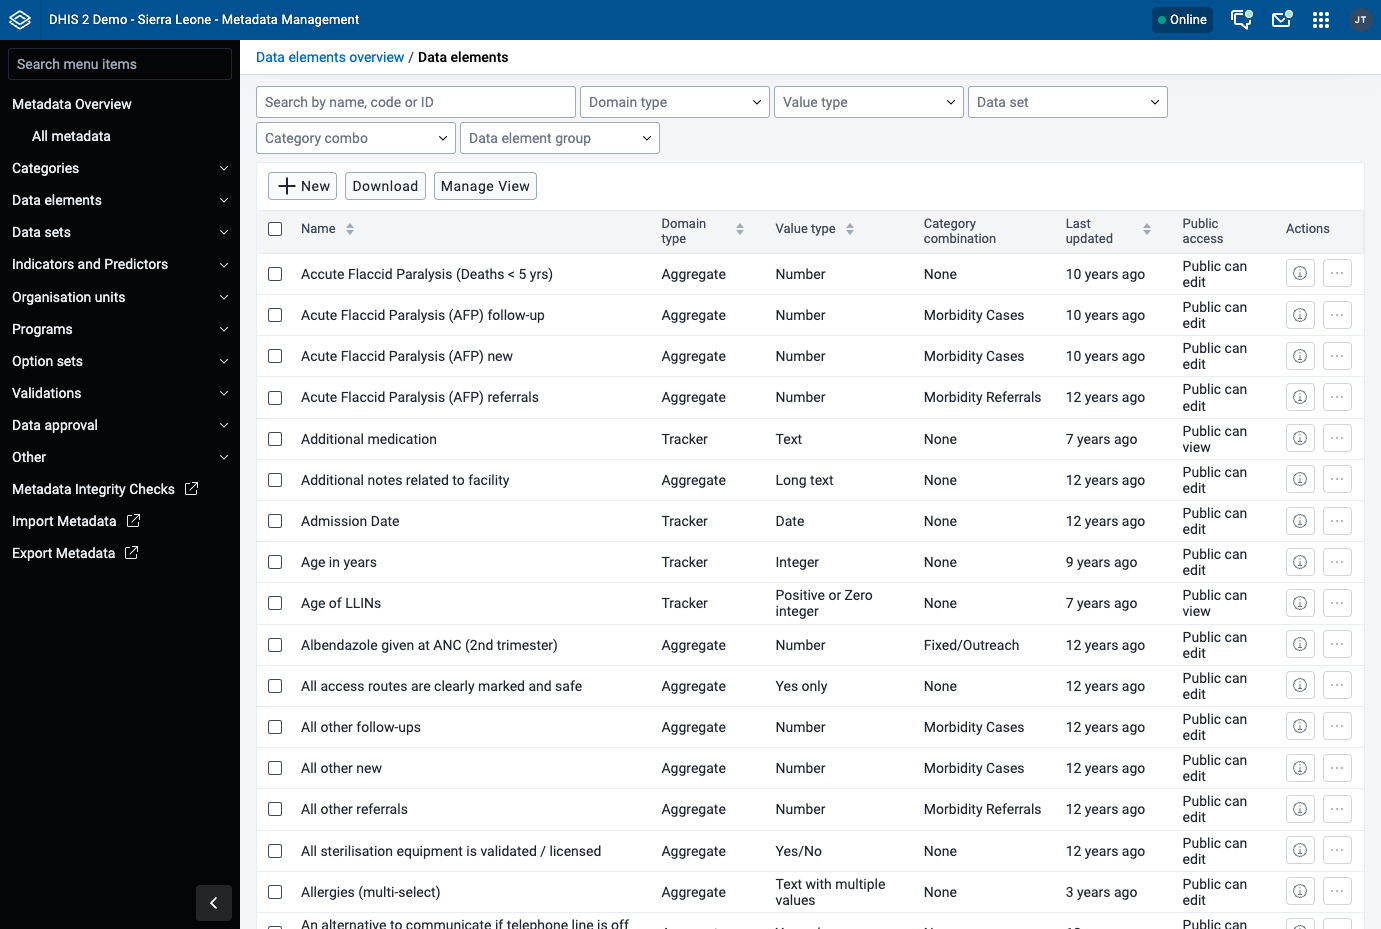
Health programs that tally clinic visits, vaccine doses, and disease cases on paper or in spreadsheets can switch to DHIS2, which turns those routine reports into live dashboards, maps, and charts. Data Entry opens a form for each facility and reporting period, grouped into sections like Immunization and Nutrition, with validation checks and a mark for complete or incomplete reports; Capture follows registered people through program stages like Birth and Baby Postnatal, with scheduled events, notes, and relationships. Dashboards gather charts, maps, tables, and text into one page per topic, with a filter bar, a slideshow mode, sharing, and interpretations, and the Data Visualizer builds column, line, pie, gauge, scatter, and radar charts or pivot tables from indicators, data elements, periods, and organisation units. Maps overlays thematic layers, facility markers, and boundaries on a choice of basemaps, with legends that count the areas in each class, and Metadata Management defines data elements, data sets, indicators, organisation units, programs, option sets, validation rules, and approval workflows from one sidebar. Users, roles, and groups control access; Messaging, Scheduler, Data Quality, and Import/Export apps cover notifications, jobs, checks, and bulk exchange; and Android devices, SMS, and a RESTful API bring in data from remote sites and other systems. Running on a dedicated VPS on RepoCloud with guaranteed CPU, RAM, and SSD, full root SSH access, and a browser serial console. BSD-3-Clause licensed.
Benefits
- Turn Reports Into Decisions
- Routine facility reports flow into dashboards, charts, pivot tables, and maps, so program managers can see which districts lag on coverage and where to send supplies or staff next.
- Collect Data At Every Level
- Facilities enter monthly forms in the browser, Android and SMS clients reach remote sites, and the RESTful API connects other systems, so reports arrive from clinics of every size.
- Model Your Own Health Programs
- Define data elements, data sets, indicators, organisation hierarchies, and tracker programs through the interface, so a new disease, program, or reporting form goes live without writing code.
- Check Quality Before Sharing
- Validation rules, completion marks, data approval, and a Data Quality app catch mistakes at the facility or district level, so the numbers on shared dashboards are ones people can trust.
Features
- Aggregate Data Entry
- Section-based forms for each facility, month, and data set, with validation checks, completion marking, and a filter that narrows the data elements inside every section.
- Tracker And Event Capture
- Register people, schedule events, write notes, and follow each enrollment through program stages, or log single events in working lists with filters, columns, and status.
- Charts And Pivot Tables
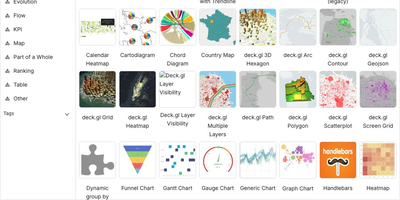
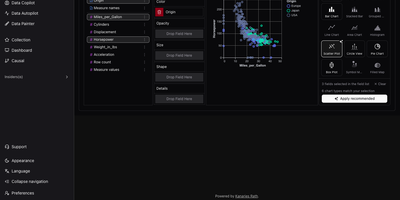
- Data Visualizer produces column, line, pie, gauge, scatter, and radar charts or pivot tables from indicators, data elements, periods, and organisation units, ready to reuse on dashboards.
- Maps With Thematic Layers
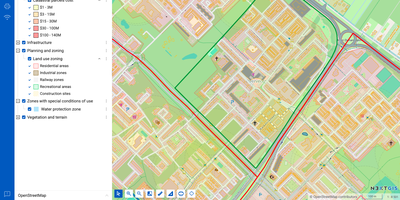
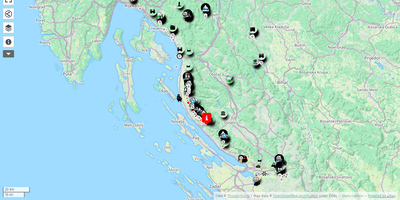
- Maps combines thematic, facility, and boundary layers over selectable basemaps, with class legends, per-layer opacity controls, and saved maps that dashboards can display.
- Dashboards And Slideshows
- Dashboards place charts, maps, tables, and text on one page, with filters, sharing options, a slideshow mode, and an interpretations panel for discussing results.
- Metadata Management Console
- A sidebar organizes categories, data elements, data sets, indicators, organisation units, programs, option sets, validation rules, and approval settings, with search, filters, and downloads.