SaaS Alternative
TestRail Allure TestOps BrowserStack Test Reporting & Analytics Datadog Test OptimizationCategories
CI/CD Quality Assurance Test Automation QA Dashboard Defect Triage Test Reporting Test Analytics TestOpsStars
Forks
Watchers
Developer links
ReportPortal
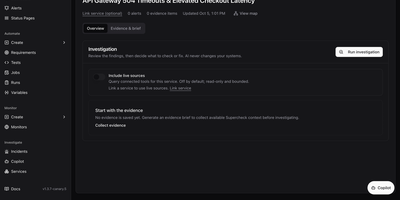
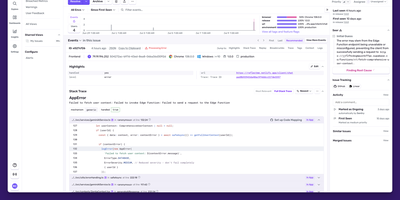
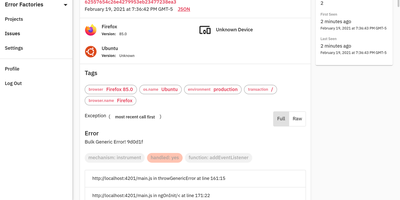
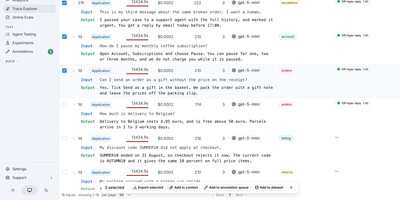
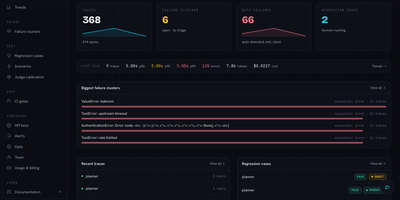
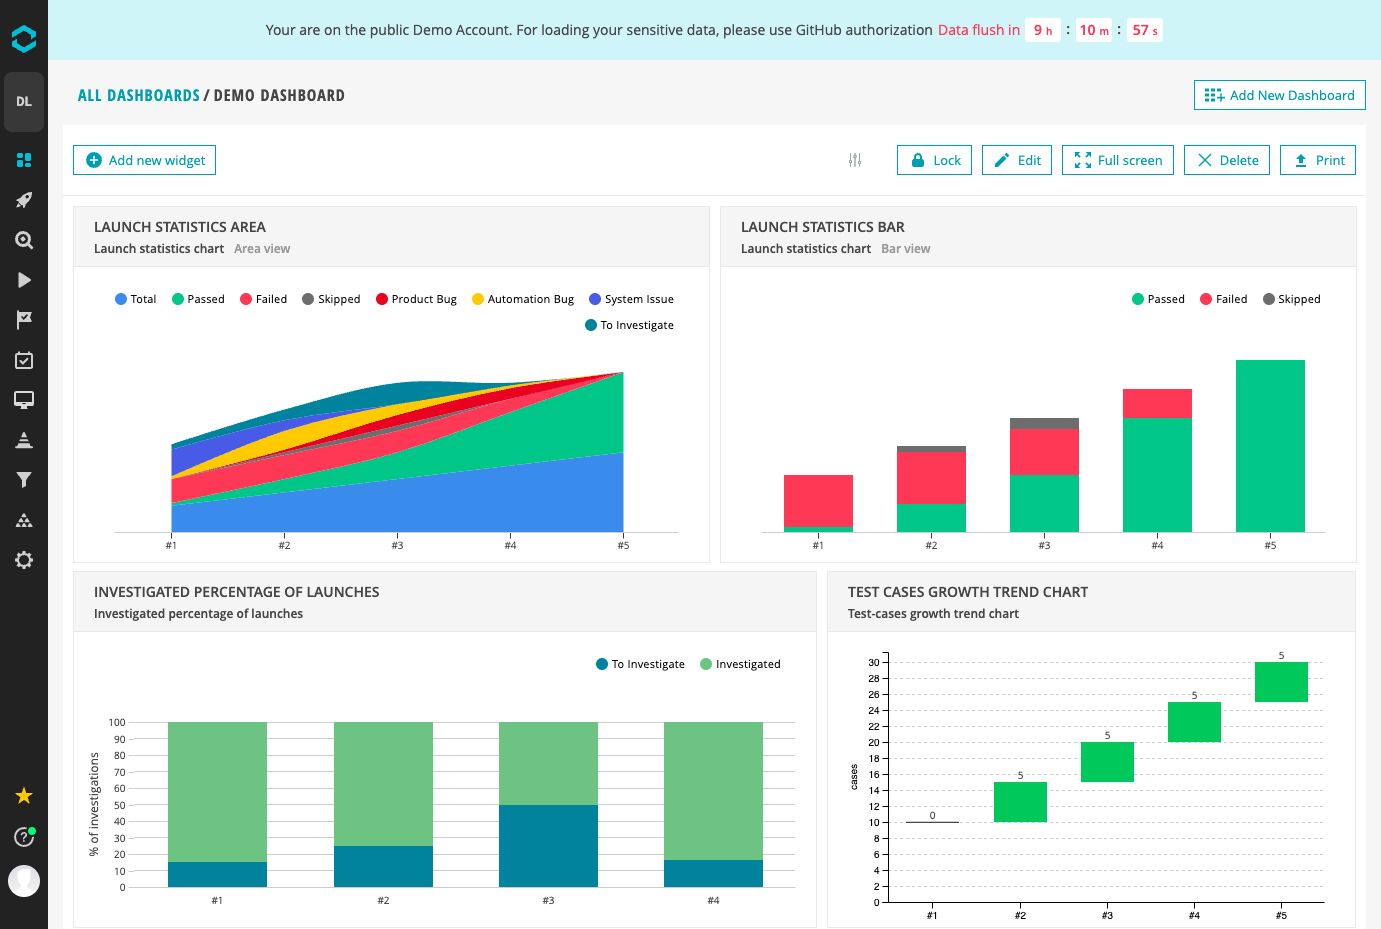
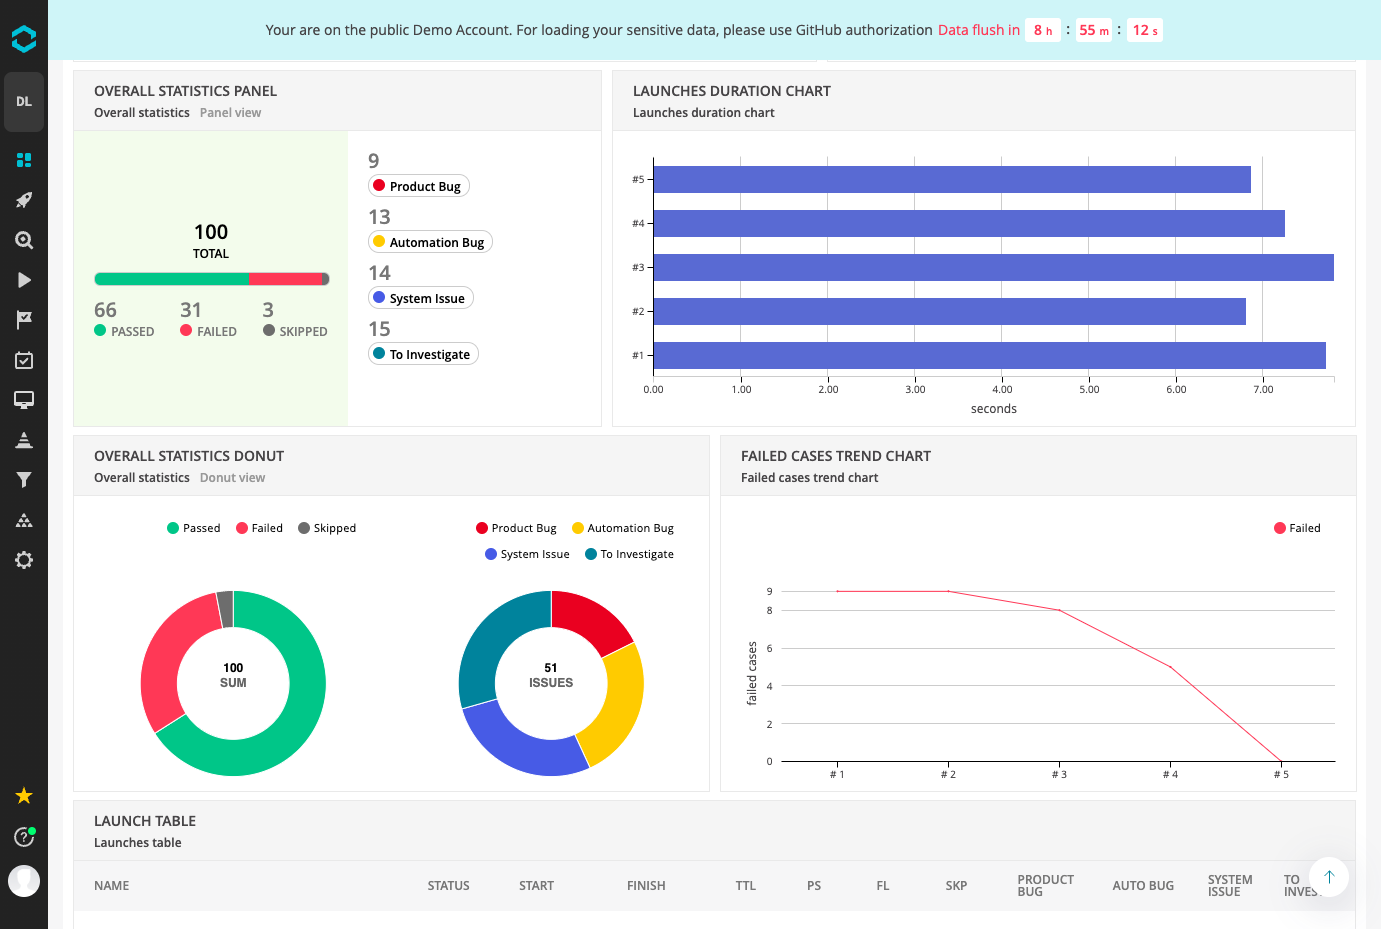
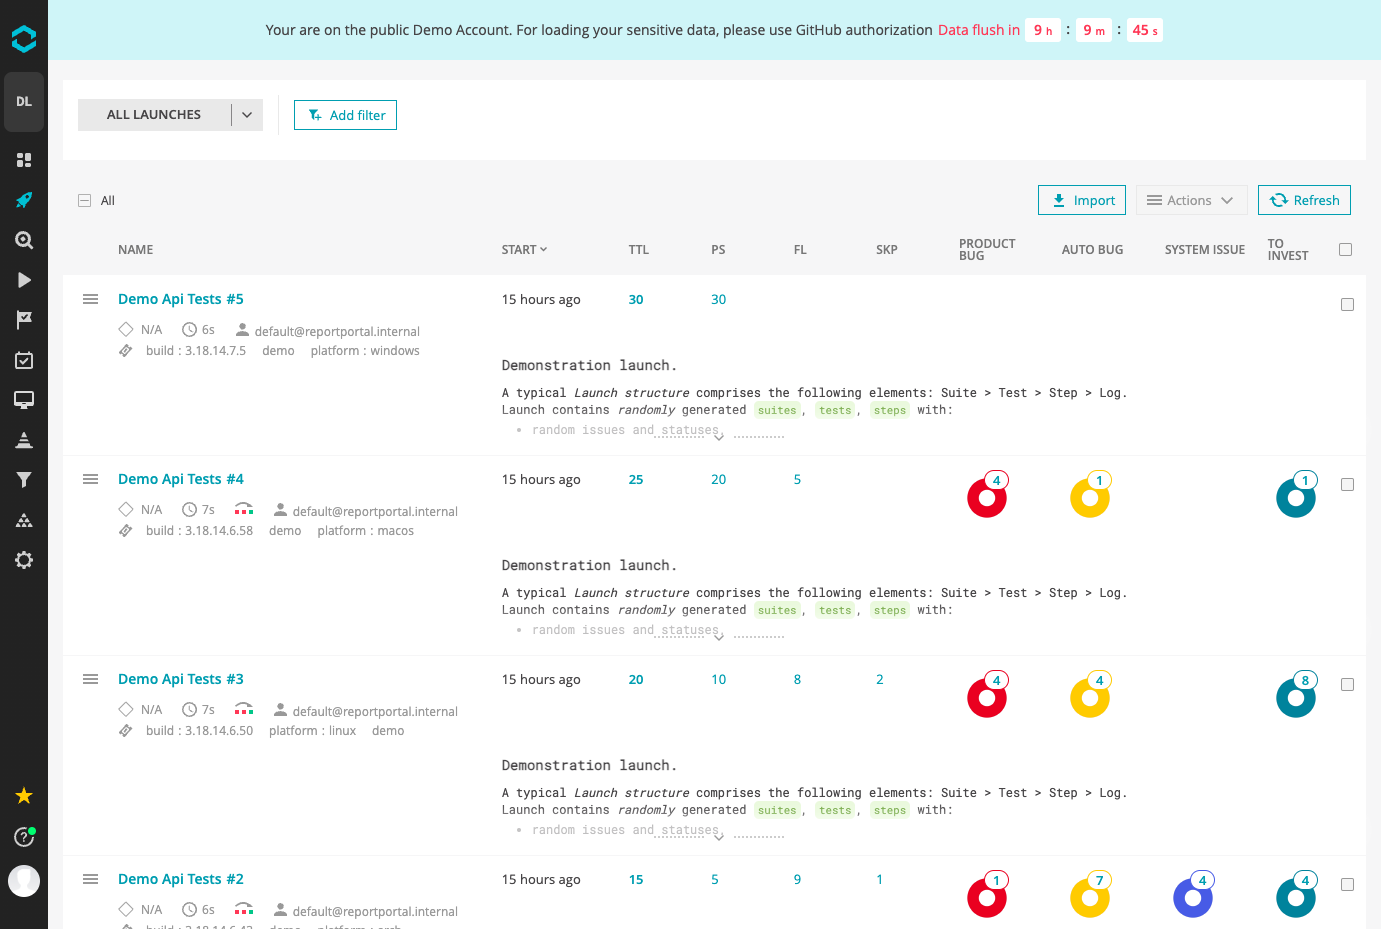
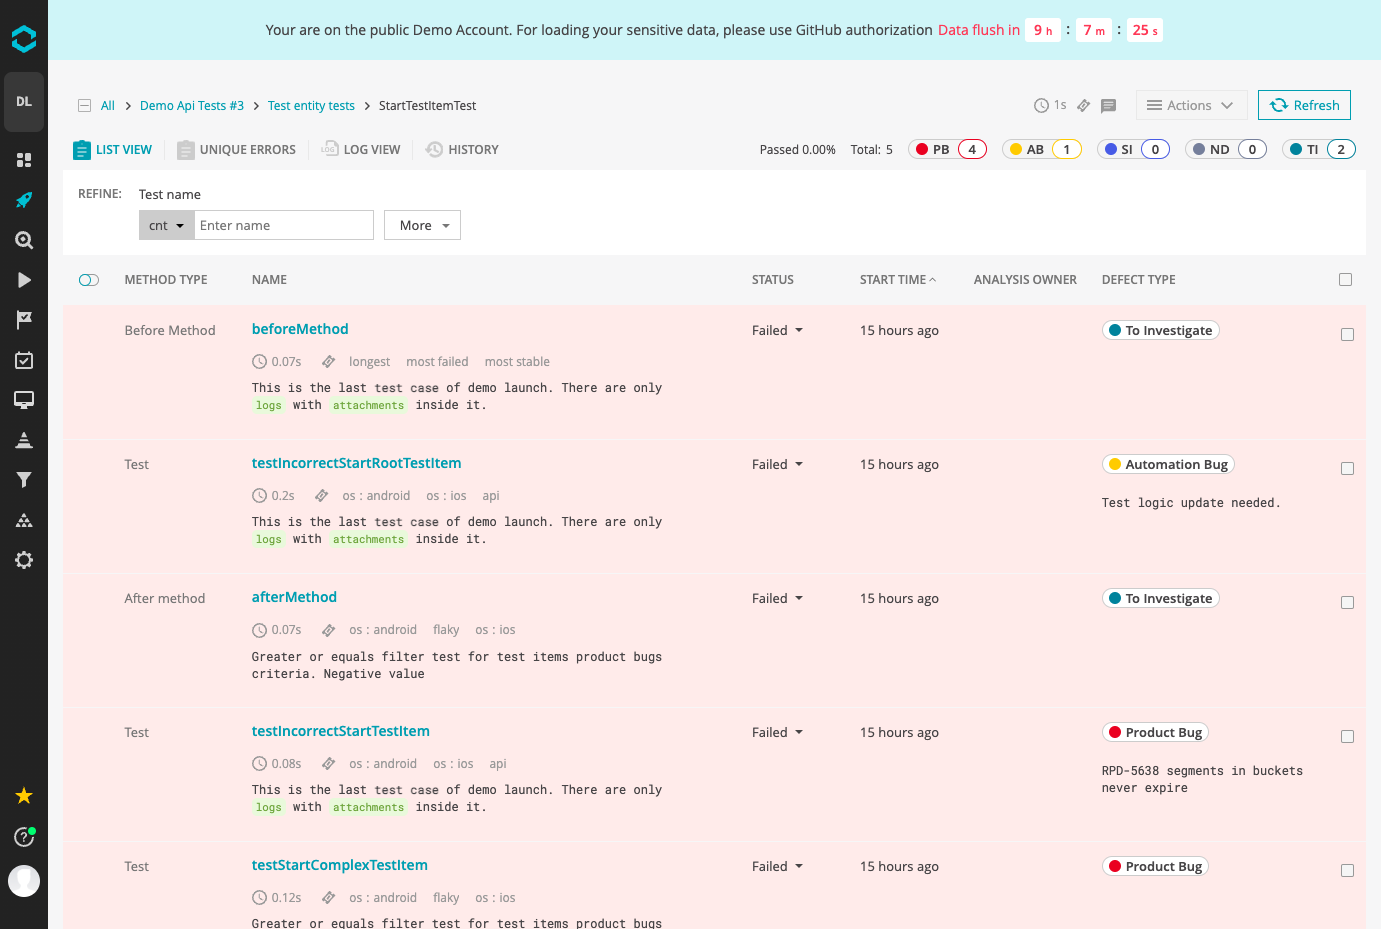
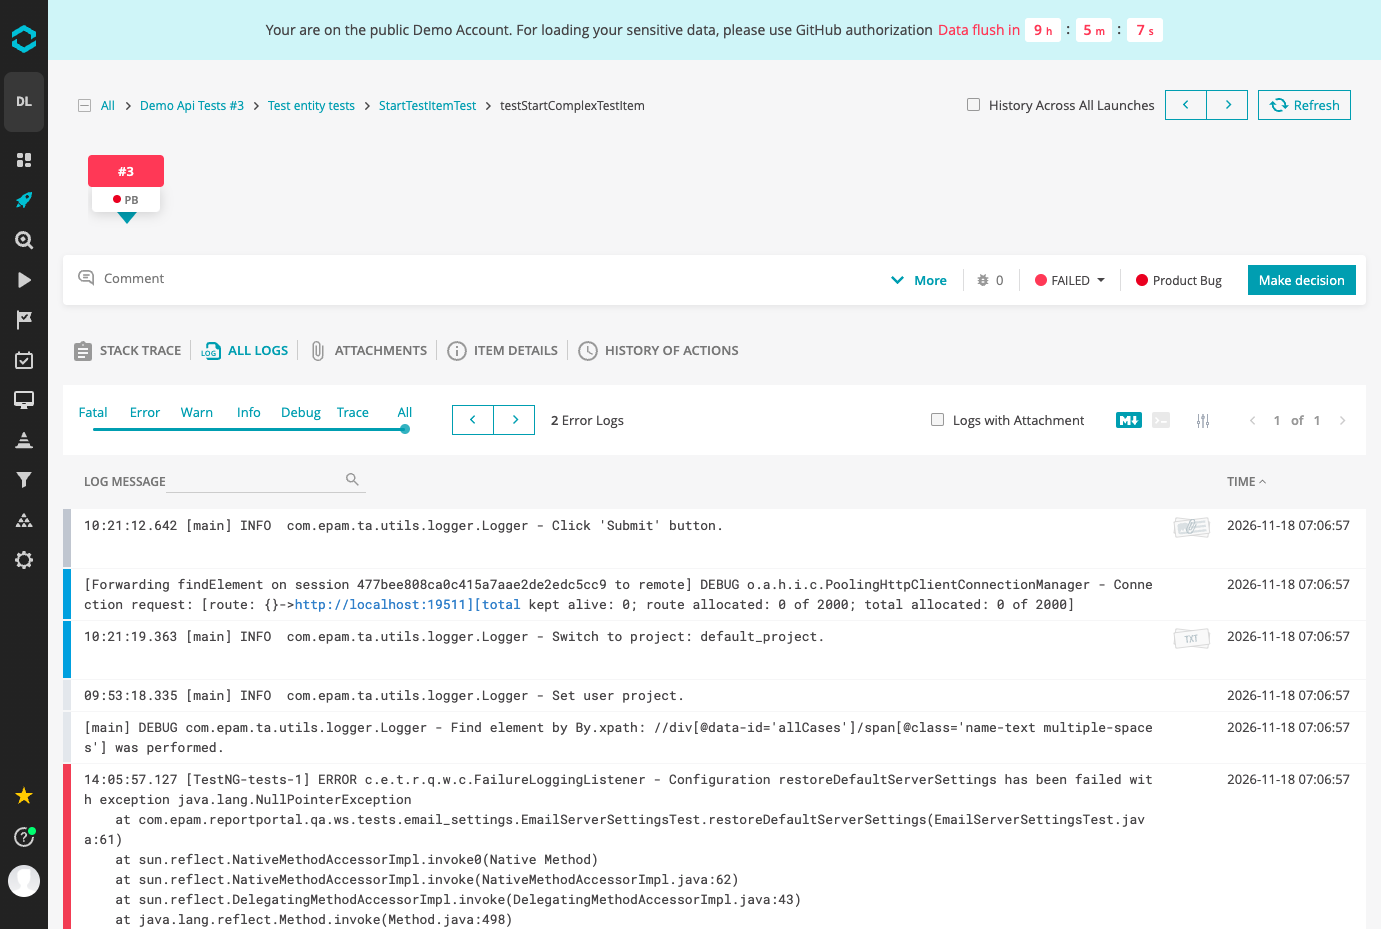
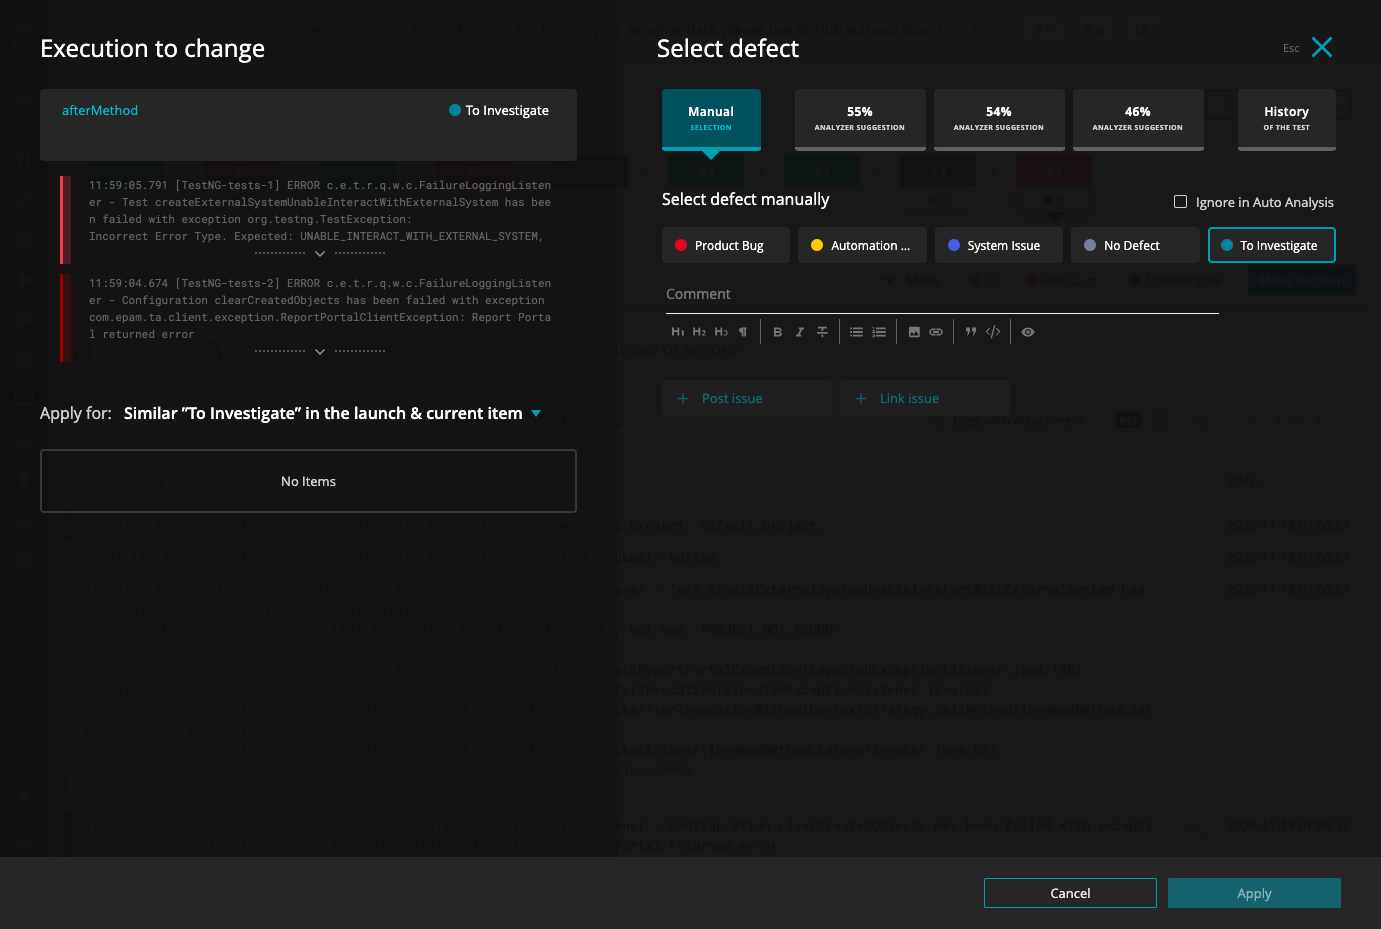
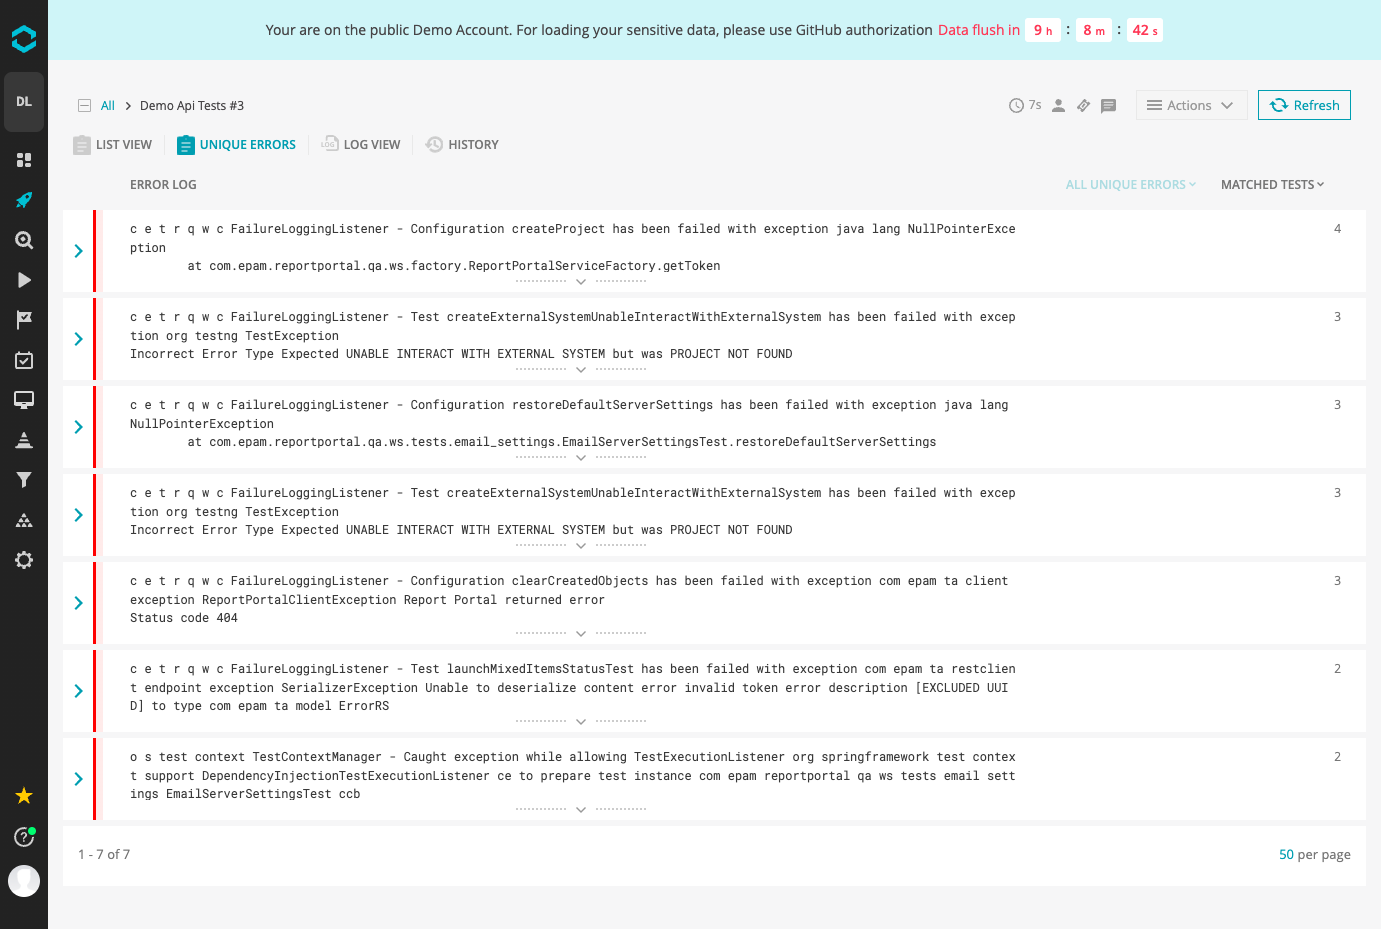
After every CI run, ReportPortal gathers test results from all of a team's frameworks into one dashboard, sorts the failures by cause, and keeps the history for comparison. Results stream in as tests execute and appear as launches with pass and fail counts, defect totals, and durations, then open into suites, tests, and steps with logs, stack traces, and screenshots. Failures are filed as Product Bug, Automation Bug, System Issue, No Defect, or To Investigate, and projects can define their own subtypes. Auto-Analysis uses machine learning to set the defect type, comment, and bug tracker link of a new failure from similar failures a person already investigated. Pattern Analysis flags known errors with string or regex rules, and Unique Error Analysis groups failed tests that share an identical error. Widgets for launch statistics, failure trends, flaky tests, and passing rates sit on dashboards, and saved filters narrow launches by name, attributes, or start time. Agents for Java, Python, JavaScript, and .NET frameworks report from any CI pipeline, and JUnit or Robot Framework result files import through the UI or API. Plugins link failures to Jira, Rally, Azure DevOps, GitLab, or monday tickets, notify Slack, Telegram, or email, and add LDAP, Active Directory, GitHub, or SAML sign-in. QA engineers triage nightly regressions, developers read failed-step traces, and release managers check pass rates. Running on a dedicated VPS on RepoCloud with guaranteed CPU, RAM, and SSD, full root SSH access, and a browser serial console. Apache-2.0 licensed.
Benefits
- One dashboard for every framework
- Agents for Java, Python, JavaScript, and .NET frameworks report into the same launches, suites, and steps, so API, integration, and UI test results share one place and one history.
- Triage starts before runs finish
- Results stream in as tests execute, and Immediate Auto-Analysis can label failures before a launch completes, which shortens the wait between a red build and a first diagnosis.
- Repeat failures get labeled automatically
- Machine learning reuses defect types, comments, and bug tracker links from failures a person already investigated, and unique error grouping shows how many tests share one cause.
- Dashboards show quality at a glance
- Widgets for launch statistics, failure trends, passing rates, and flaky tests combine on project dashboards, so release managers read current numbers before opening a single run.
Features
- Launch and Log Explorer
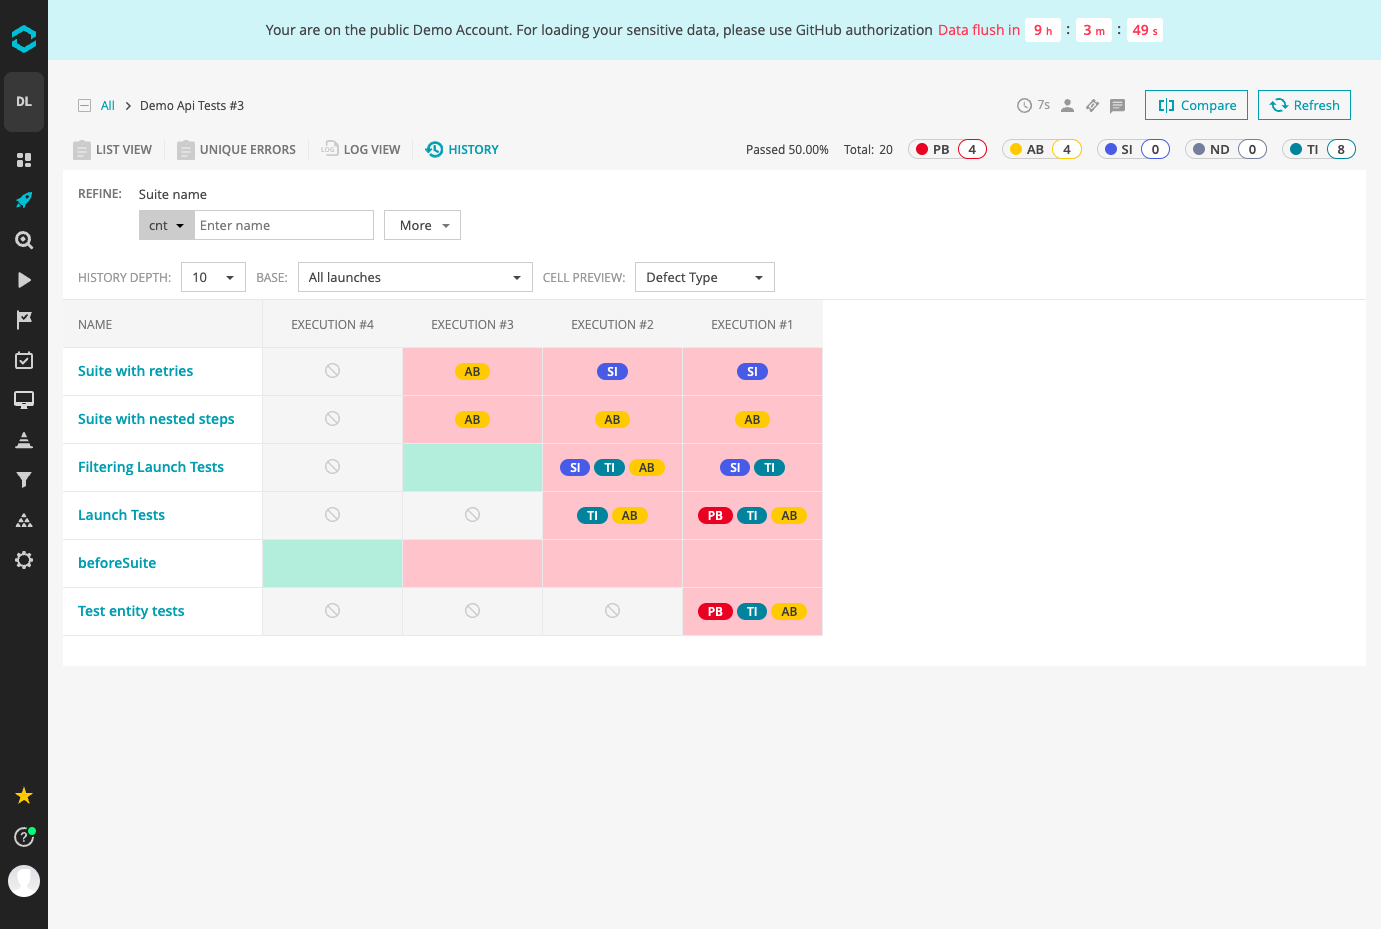
- Browse launches, suites, tests, and steps with log levels, stack traces, binary attachments, screenshots, and each test's execution history across earlier runs.
- Defect Types and Triage
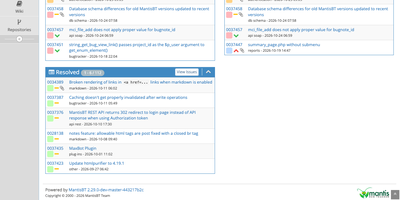
- Classify failures as Product Bug, Automation Bug, System Issue, No Defect, or To Investigate, add project subtypes, and bulk-update items from the Make decision dialog.
- ML and Pattern Analysis
- Auto-Analysis, ML Suggestions, Unique Error Analysis, and string or regex Pattern Analysis run on finished launches, and immediate variants start before a launch ends.
- Dashboards and Widgets
- Create dashboards from launch statistics, failed-case trend, passing-rate, flaky test, duration, and component health widgets that can be resized, rearranged, and edited at any time.
- Framework Agents and API
- Reporting agents for Java, Python, JavaScript, and .NET, a REST API with access tokens, and JUnit or Robot Framework file import connect any CI system.
- Plugins and Sign-In
- Plugins connect Jira, Rally, Azure DevOps, GitLab, and monday, send Slack, Telegram, or email notifications, and add LDAP, Active Directory, GitHub, or SAML authorization.