Categories
DevOps Observability APM Error Tracking Debugging Performance Monitoring Application MonitoringStars
Forks
Watchers
Developer links
Sentry
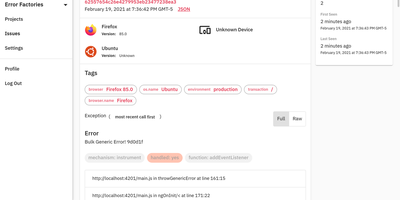
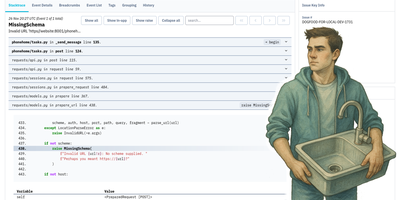
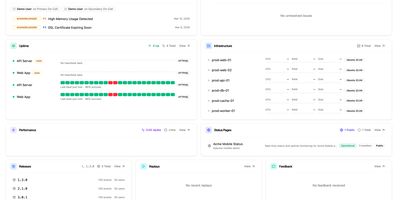
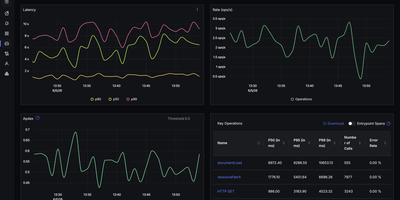
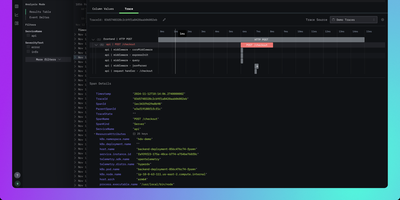
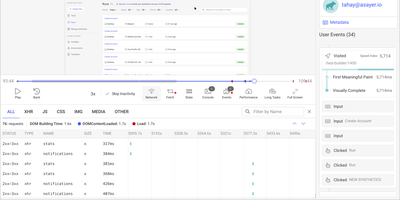
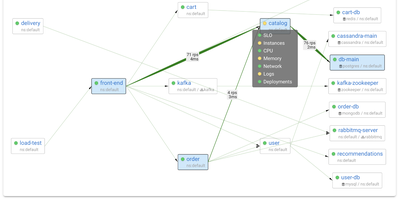
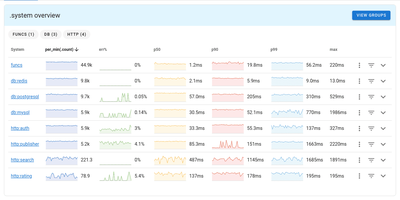
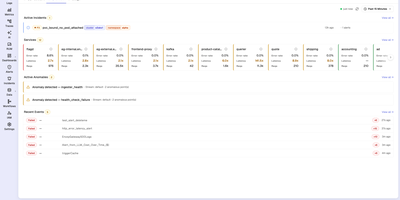
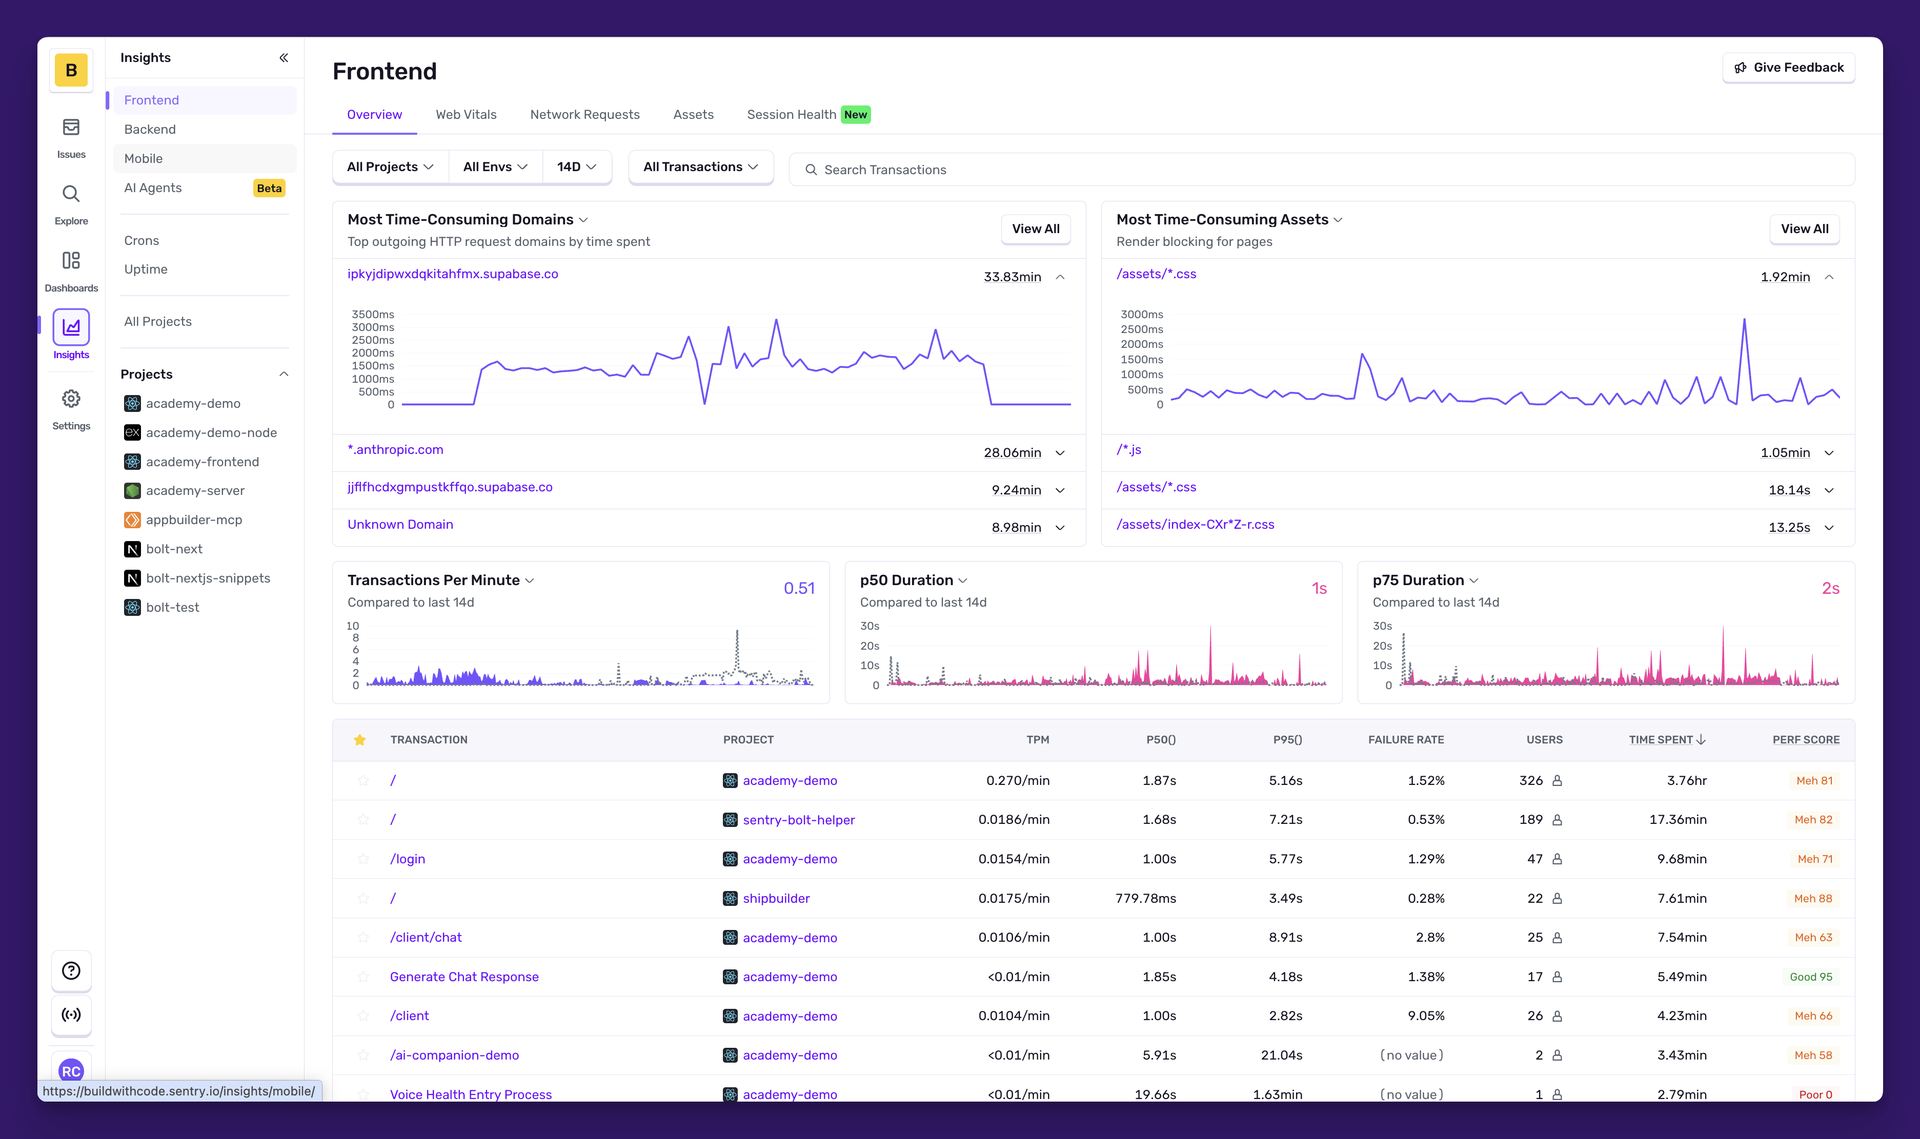
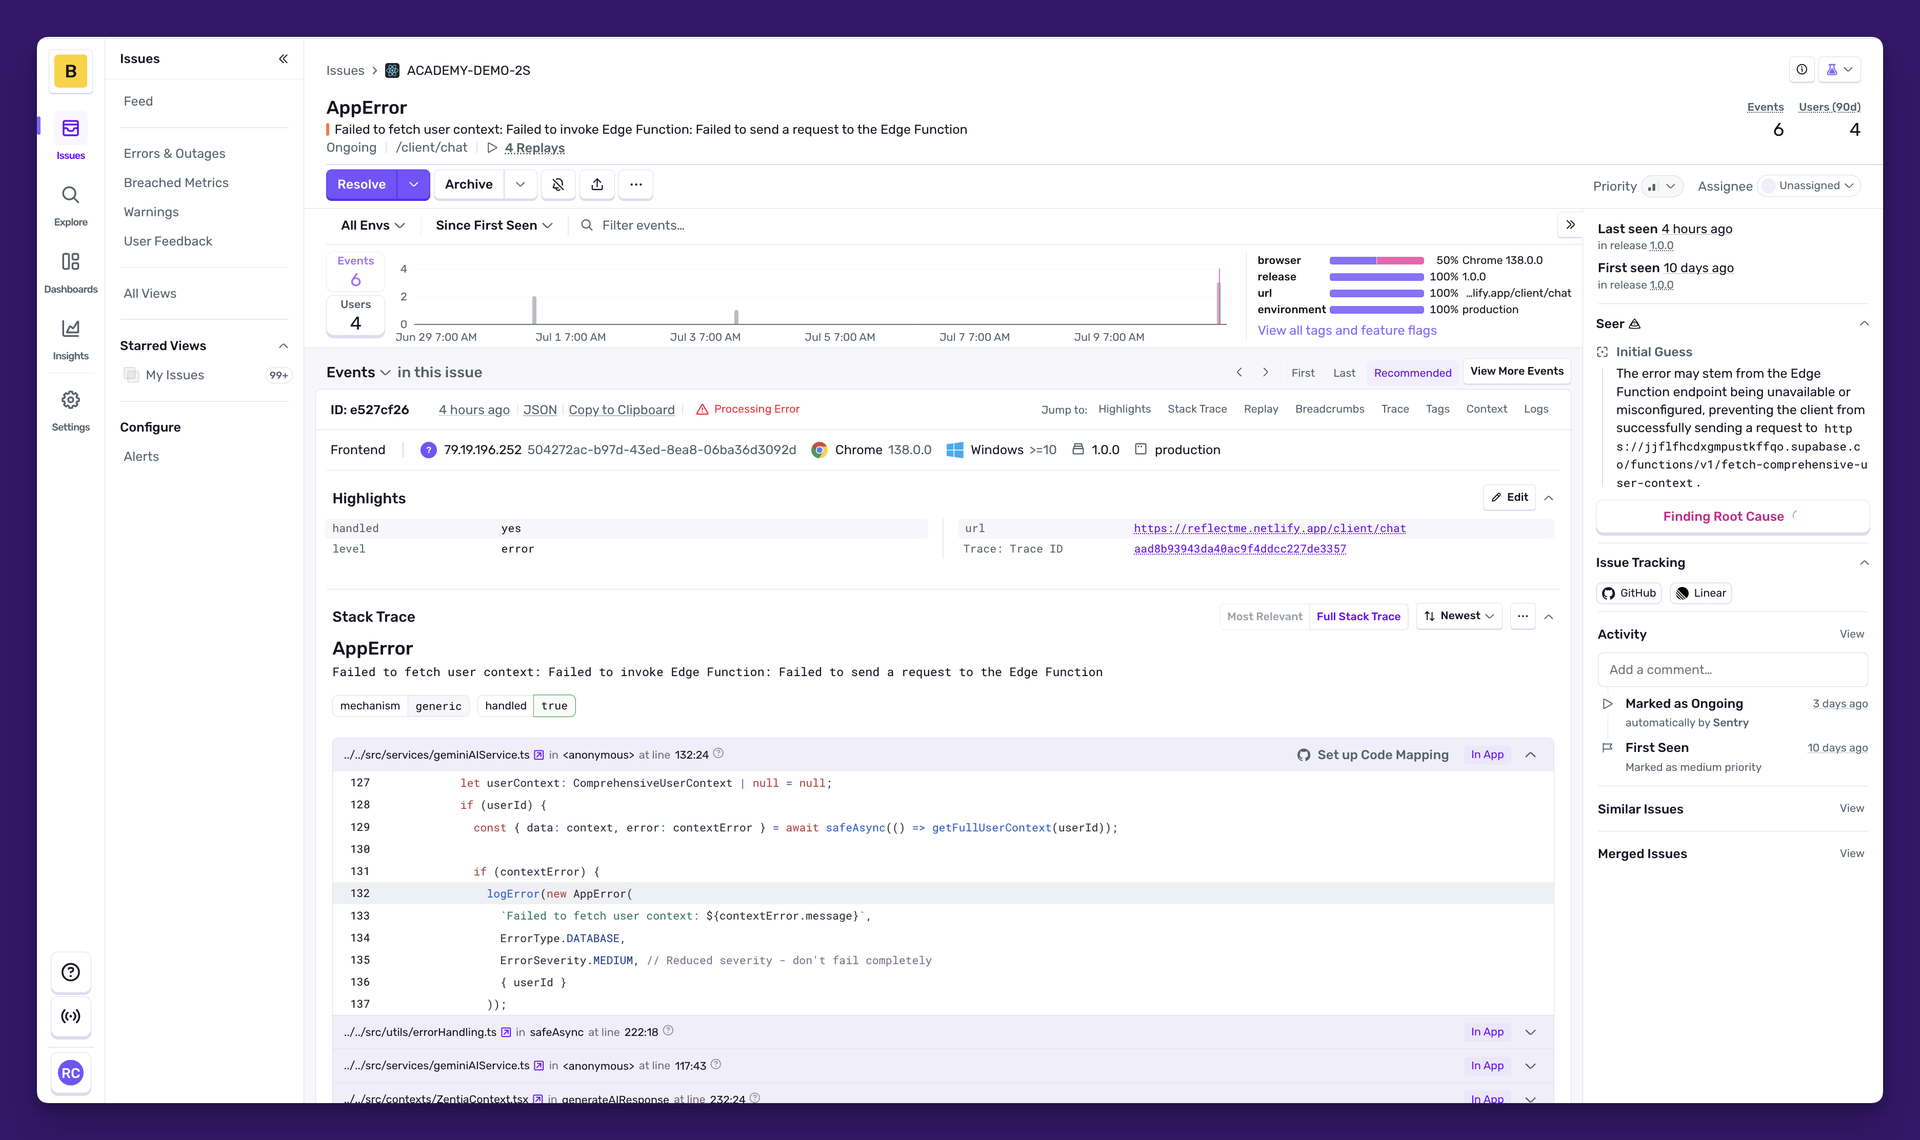
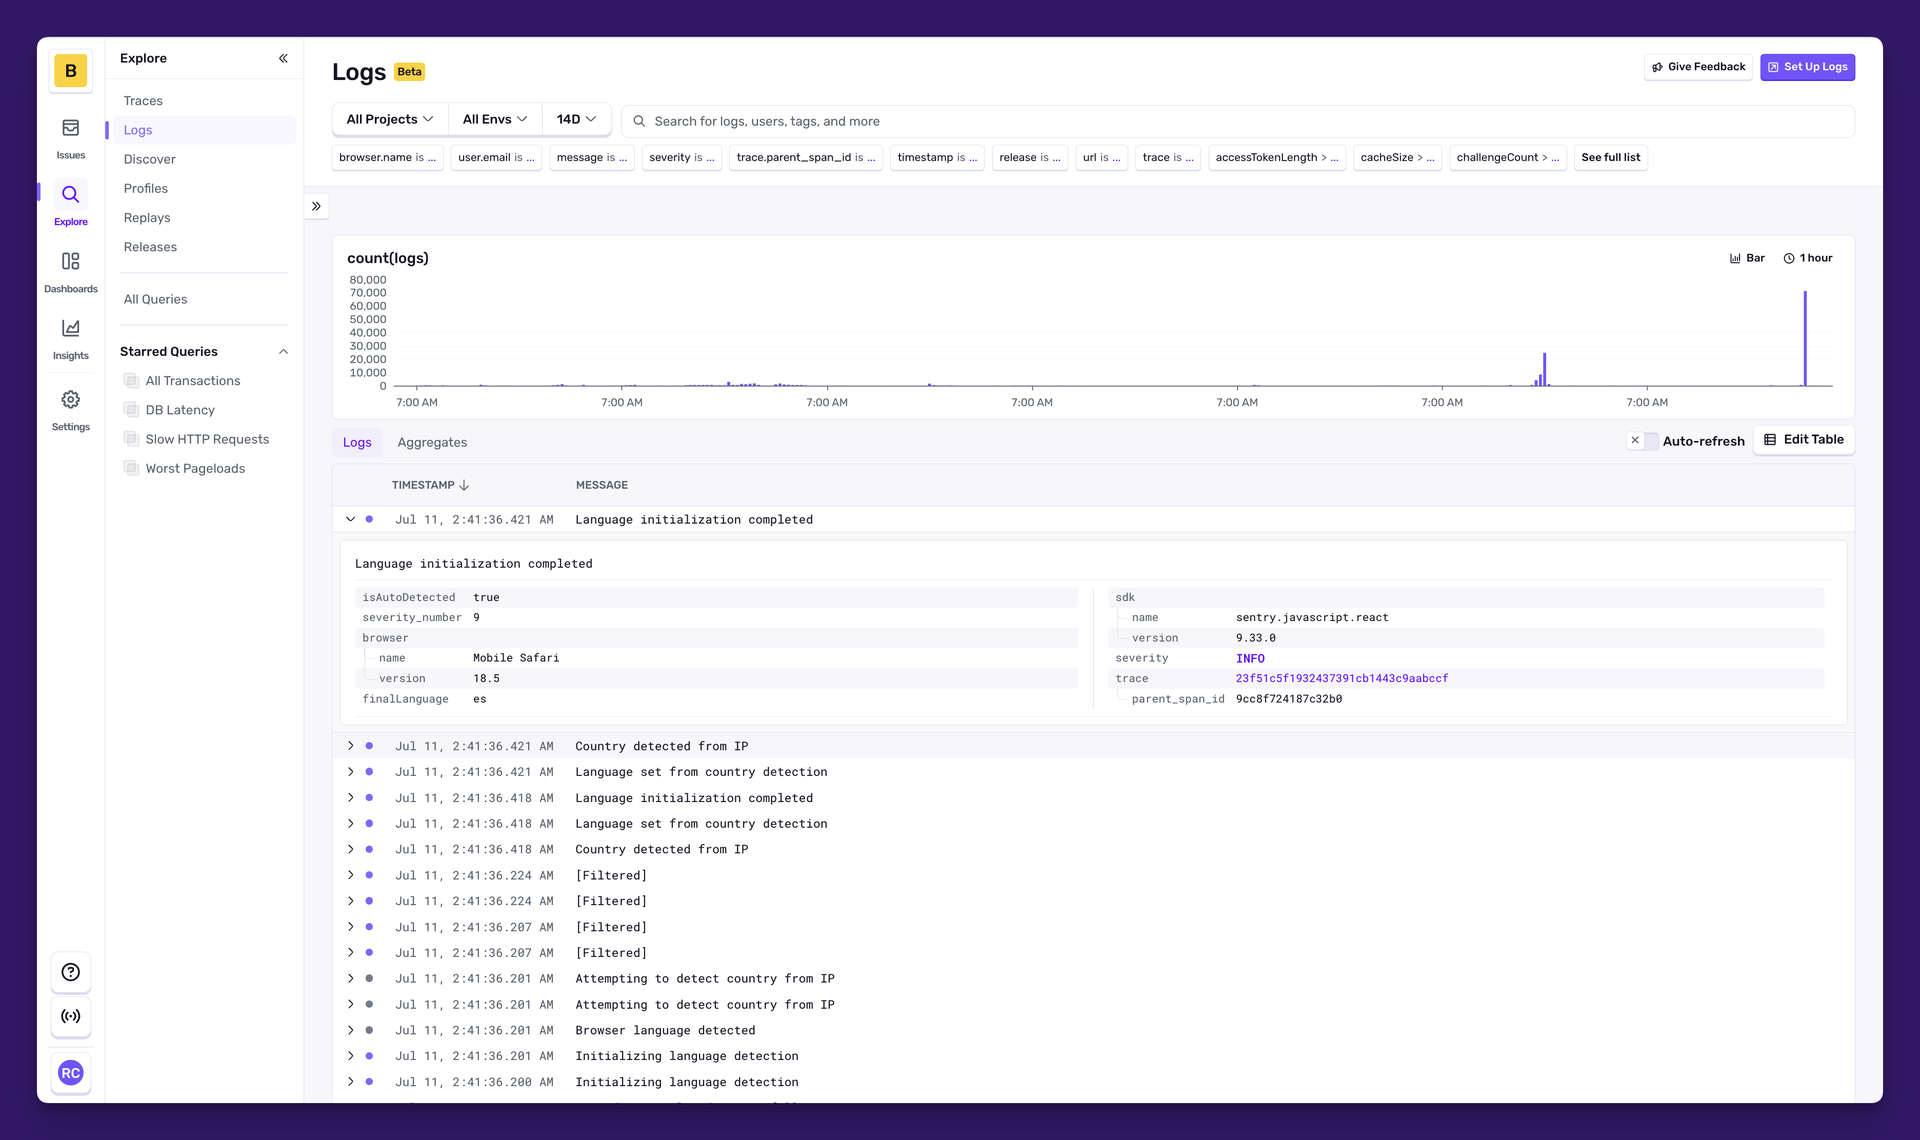
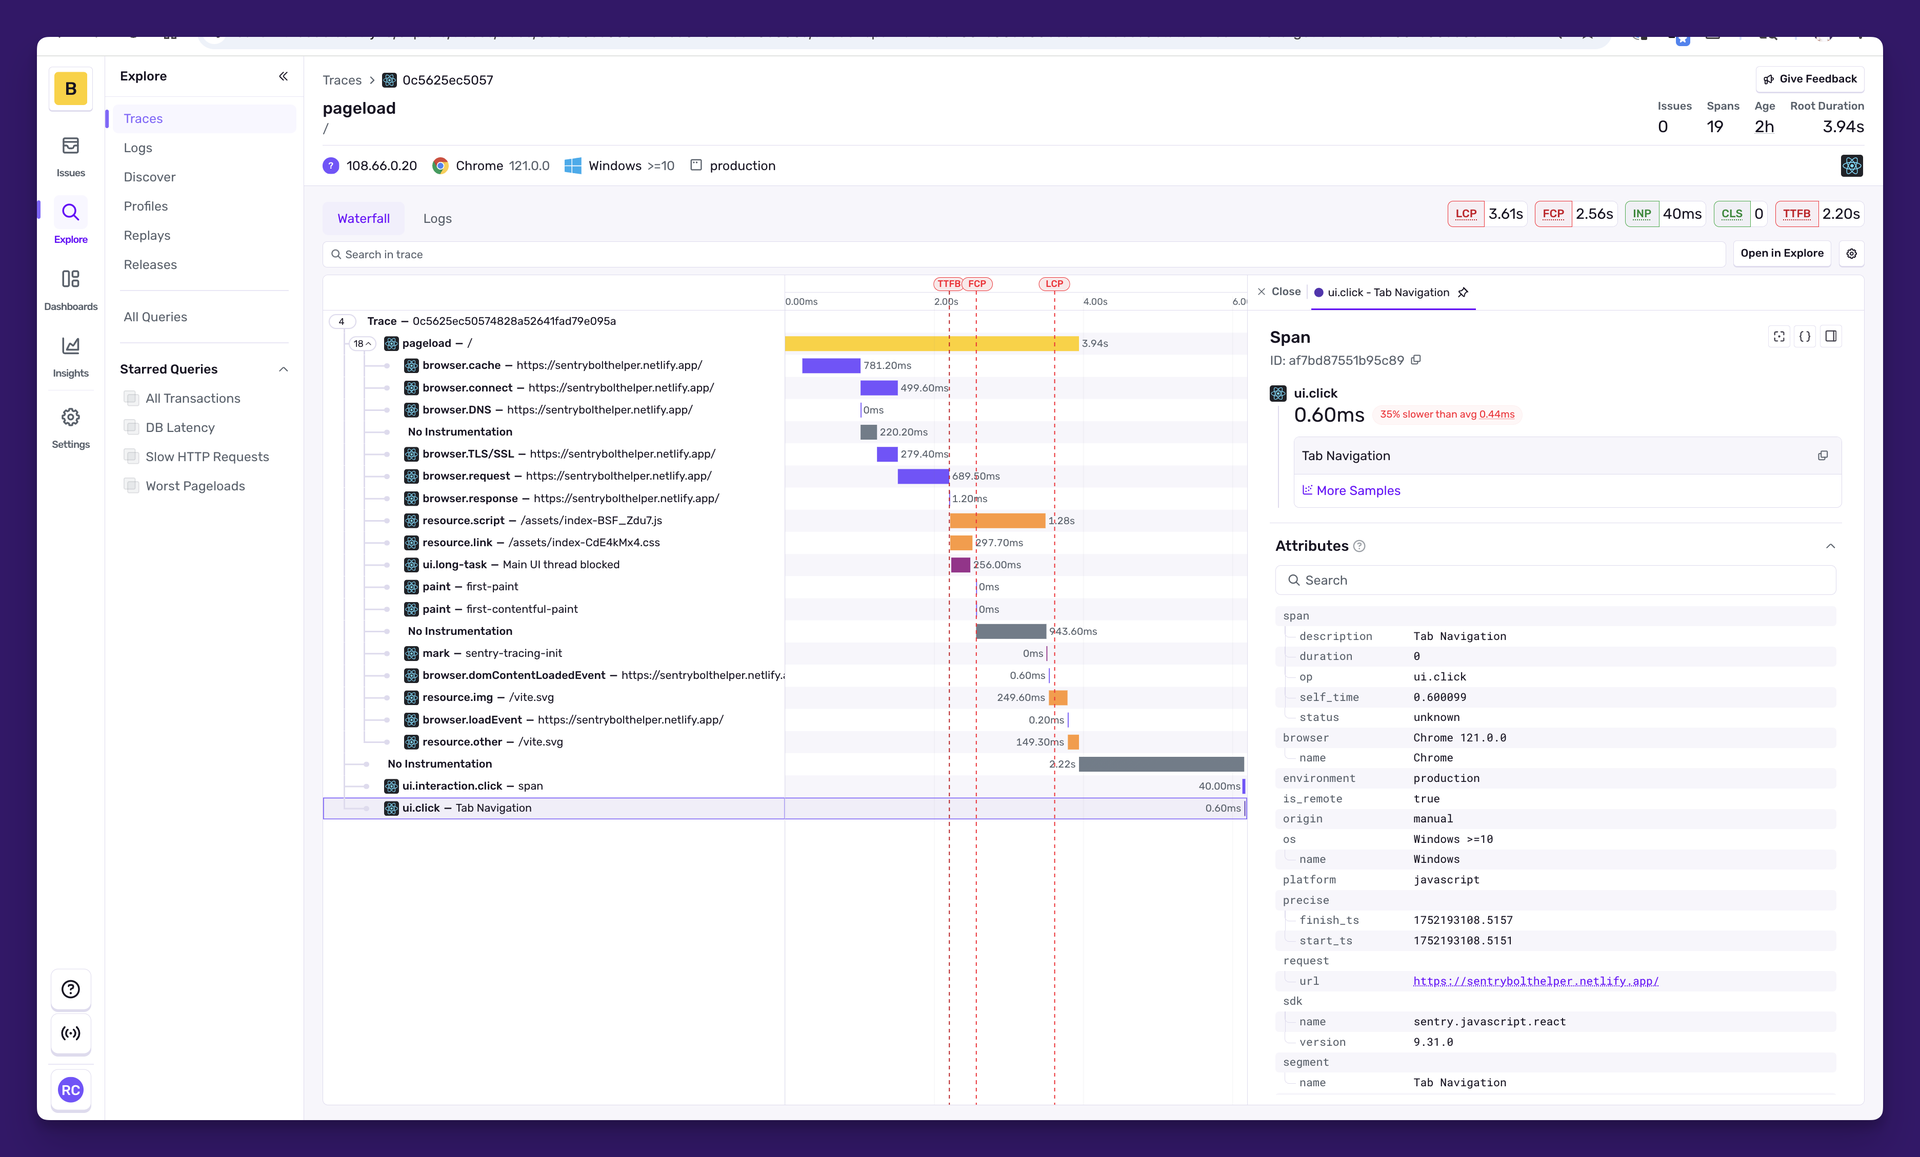
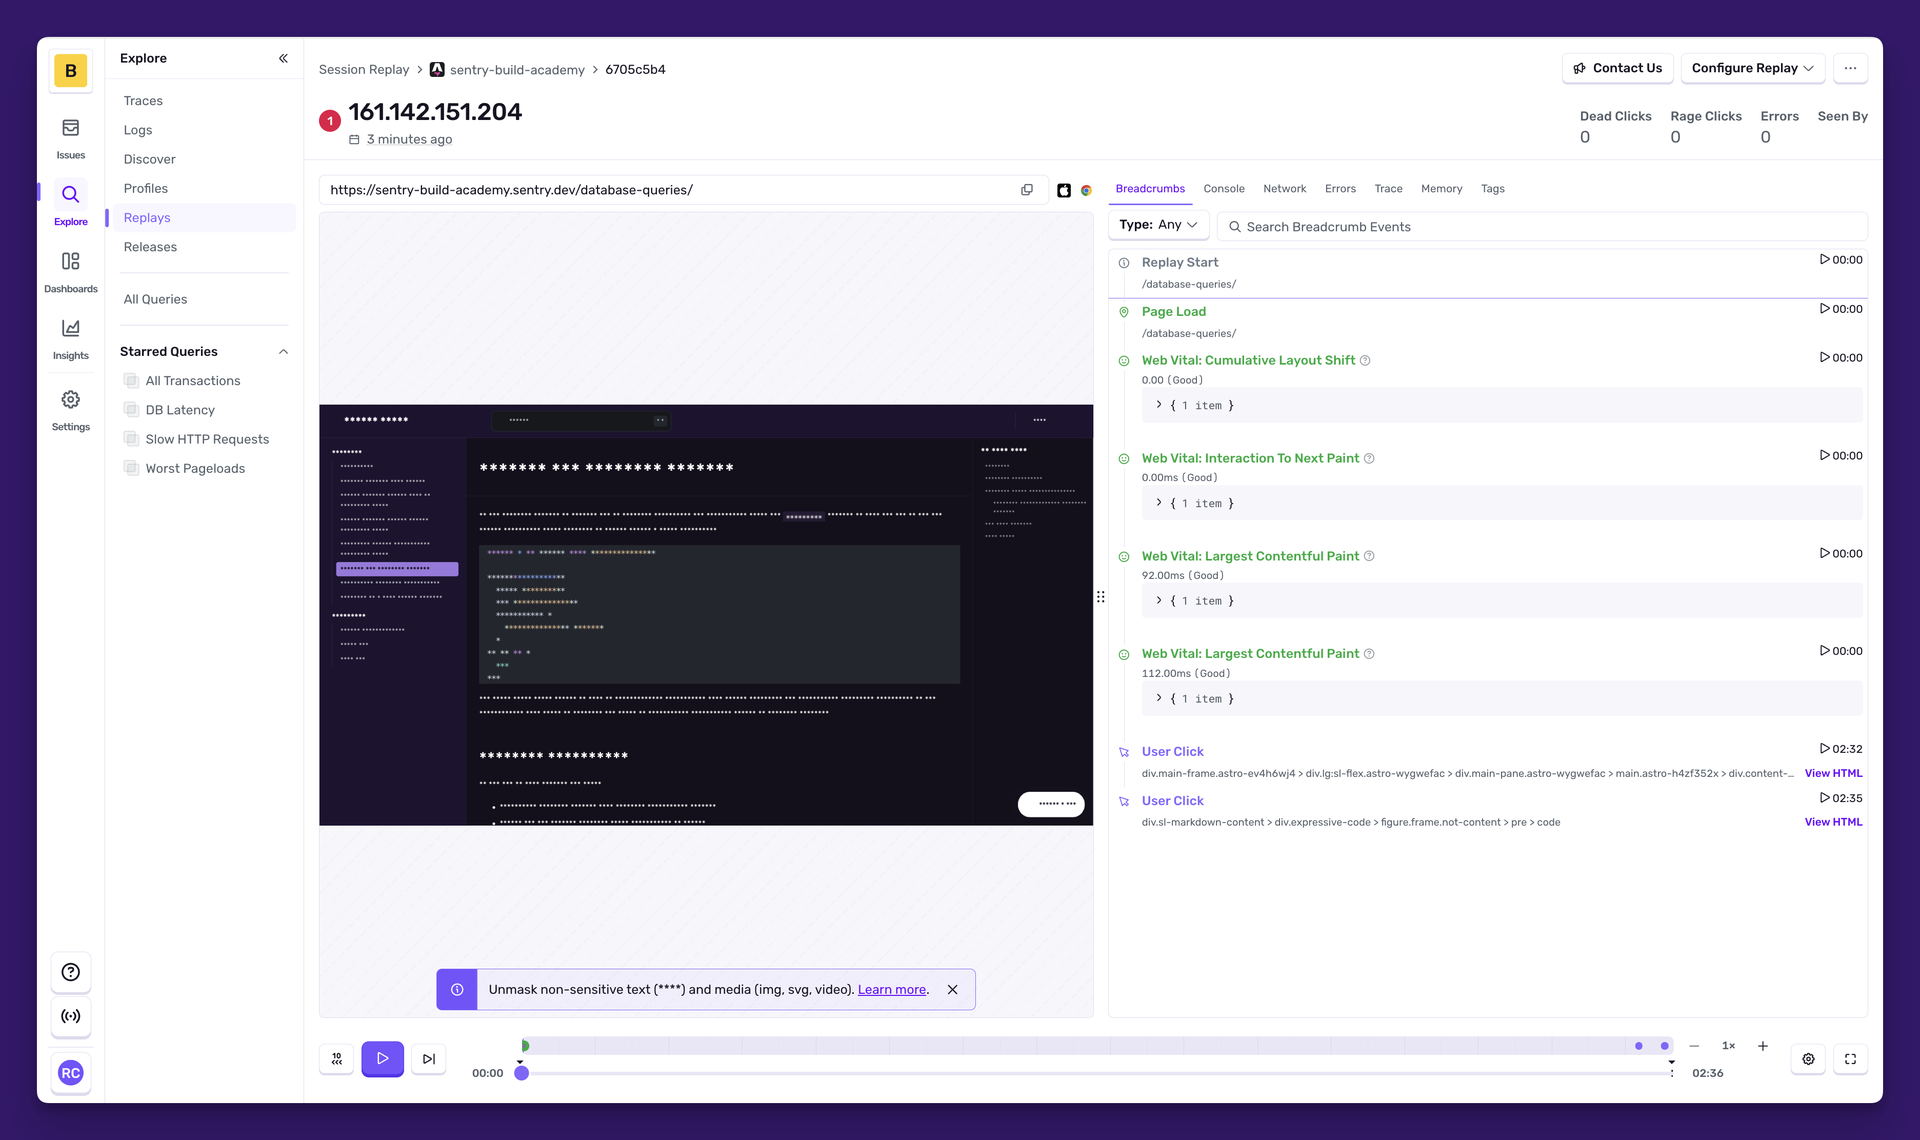
Backed by 44,000 GitHub stars and trusted by over four million developers, Sentry is the debugging platform that captures errors, traces, replays, profiles, and metrics from your applications and connects them all through distributed tracing. The error tracking engine captures full stack traces with source context, breadcrumbs, and automatic demangling for native crashes, while intelligent grouping consolidates duplicate events into actionable issues with regression detection and automatic assignment. Performance monitoring instruments your frameworks automatically, capturing every database query, API call, cache hit, and queue operation as spans within distributed traces that flow across frontend, backend, and mobile boundaries. Session Replay produces video-like recordings of real user sessions showing DOM interactions, network requests, console messages, and errors on a synchronized timeline, with AI-powered summaries that describe what happened without watching the full replay. Continuous profiling captures CPU execution data at the function and line level for Node.js, Python, iOS, and Android, linking slow spans directly to the exact code responsible. Cron monitoring tracks scheduled jobs for failures, missed runs, and duration anomalies. The alerting engine fires notifications through Slack, PagerDuty, Opsgenie, and webhooks on new issues, regressions, error spikes, or when latency and crash-free session rate thresholds are crossed. Self-hosted deployment runs as a Docker Compose stack with PostgreSQL, ClickHouse, Kafka, Redis, and Relay. Running on a dedicated VPS on RepoCloud with guaranteed CPU, RAM, and SSD, full root SSH access, and a browser serial console. FSL licensed.
Benefits
- Full-Stack Distributed Tracing
- Follow requests across frontend, backend, and mobile services with automatic framework instrumentation capturing database queries, API calls, caches, and queues as correlated spans.
- Session Replay with AI Summaries
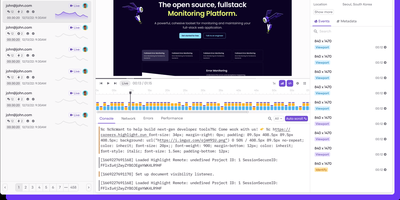
- Video-like recordings of real user sessions synchronize DOM interactions, network requests, console messages, and errors on a single timeline with AI-generated play-by-play summaries.
- Code-Level Continuous Profiling
- CPU profiles capture function and line-level execution data for Node.js, Python, iOS, and Android, linking slow spans directly to the exact code causing performance bottlenecks.
- 100+ SDK Integrations
- Official SDKs for JavaScript, Python, Go, Java, Ruby, PHP, .NET, Rust, Swift, Kotlin, and dozens more with automatic framework instrumentation for Django, Express, Rails, and Spring.
Features
- Intelligent Error Grouping
- Automatic stack trace demangling, fingerprint-based event grouping, regression detection, and issue assignment consolidate duplicate errors into actionable debugging workflows.
- Cron Job Monitoring
- Track scheduled jobs and background tasks for failures, missed runs, and duration anomalies with automatic alerting when jobs exceed expected execution windows.
- Rich Alerting Engine
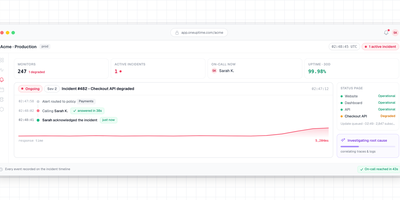
- Configure alert rules for new issues, regressions, error spikes, and performance thresholds with notifications via Slack, PagerDuty, Opsgenie, and webhooks.
- Source Map Symbolication
- Upload debug symbols, source maps, ProGuard mappings, and dSYM files for readable stack traces in minified JavaScript, Android, and iOS crash reports.
- Release Health Tracking
- Monitor version adoption rates, crash-free session percentages, and regression detection per release with automatic deploy notifications and commit correlation.