Categories
Self-Hosted MCP Server Business Intelligence Dashboards Data Analytics AI Agent Tools Semantic Layer OLAP AnalyticsStars
Forks
Watchers
Developer links
Saiku Analytics
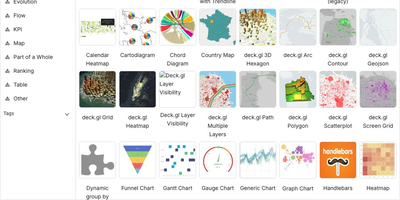
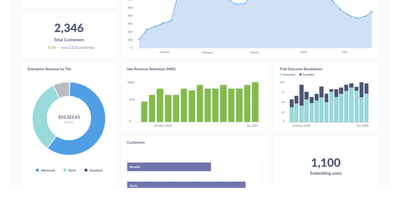
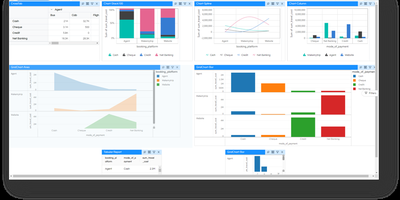
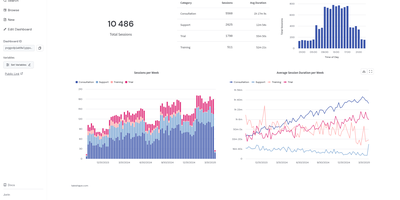
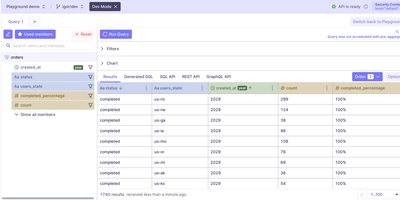
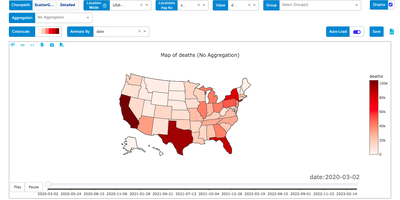
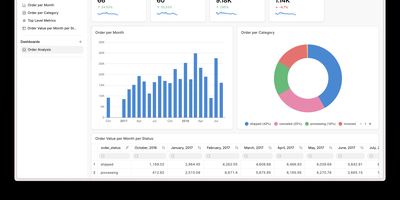
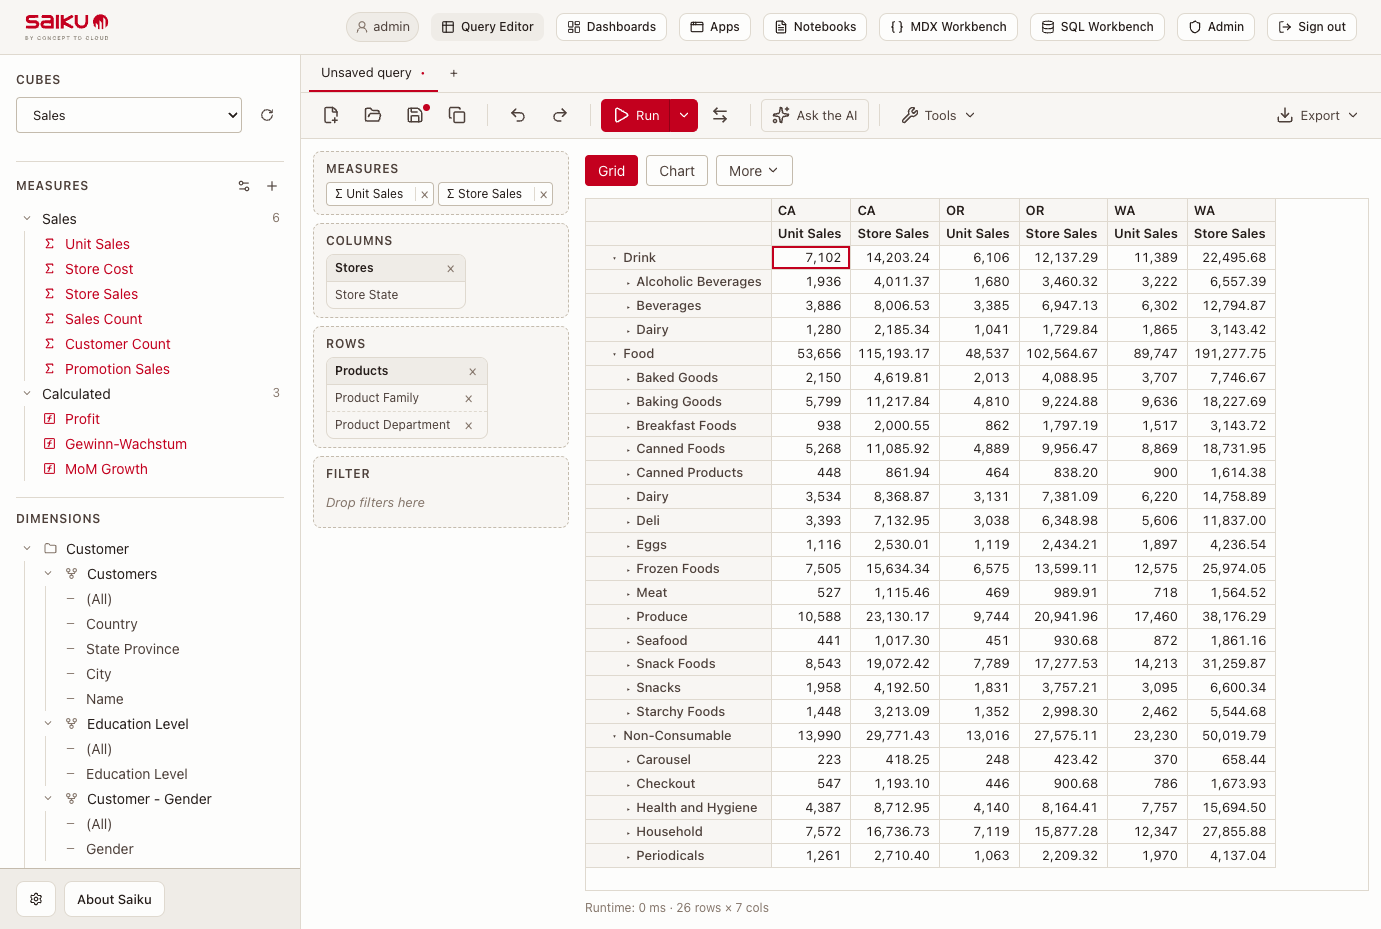
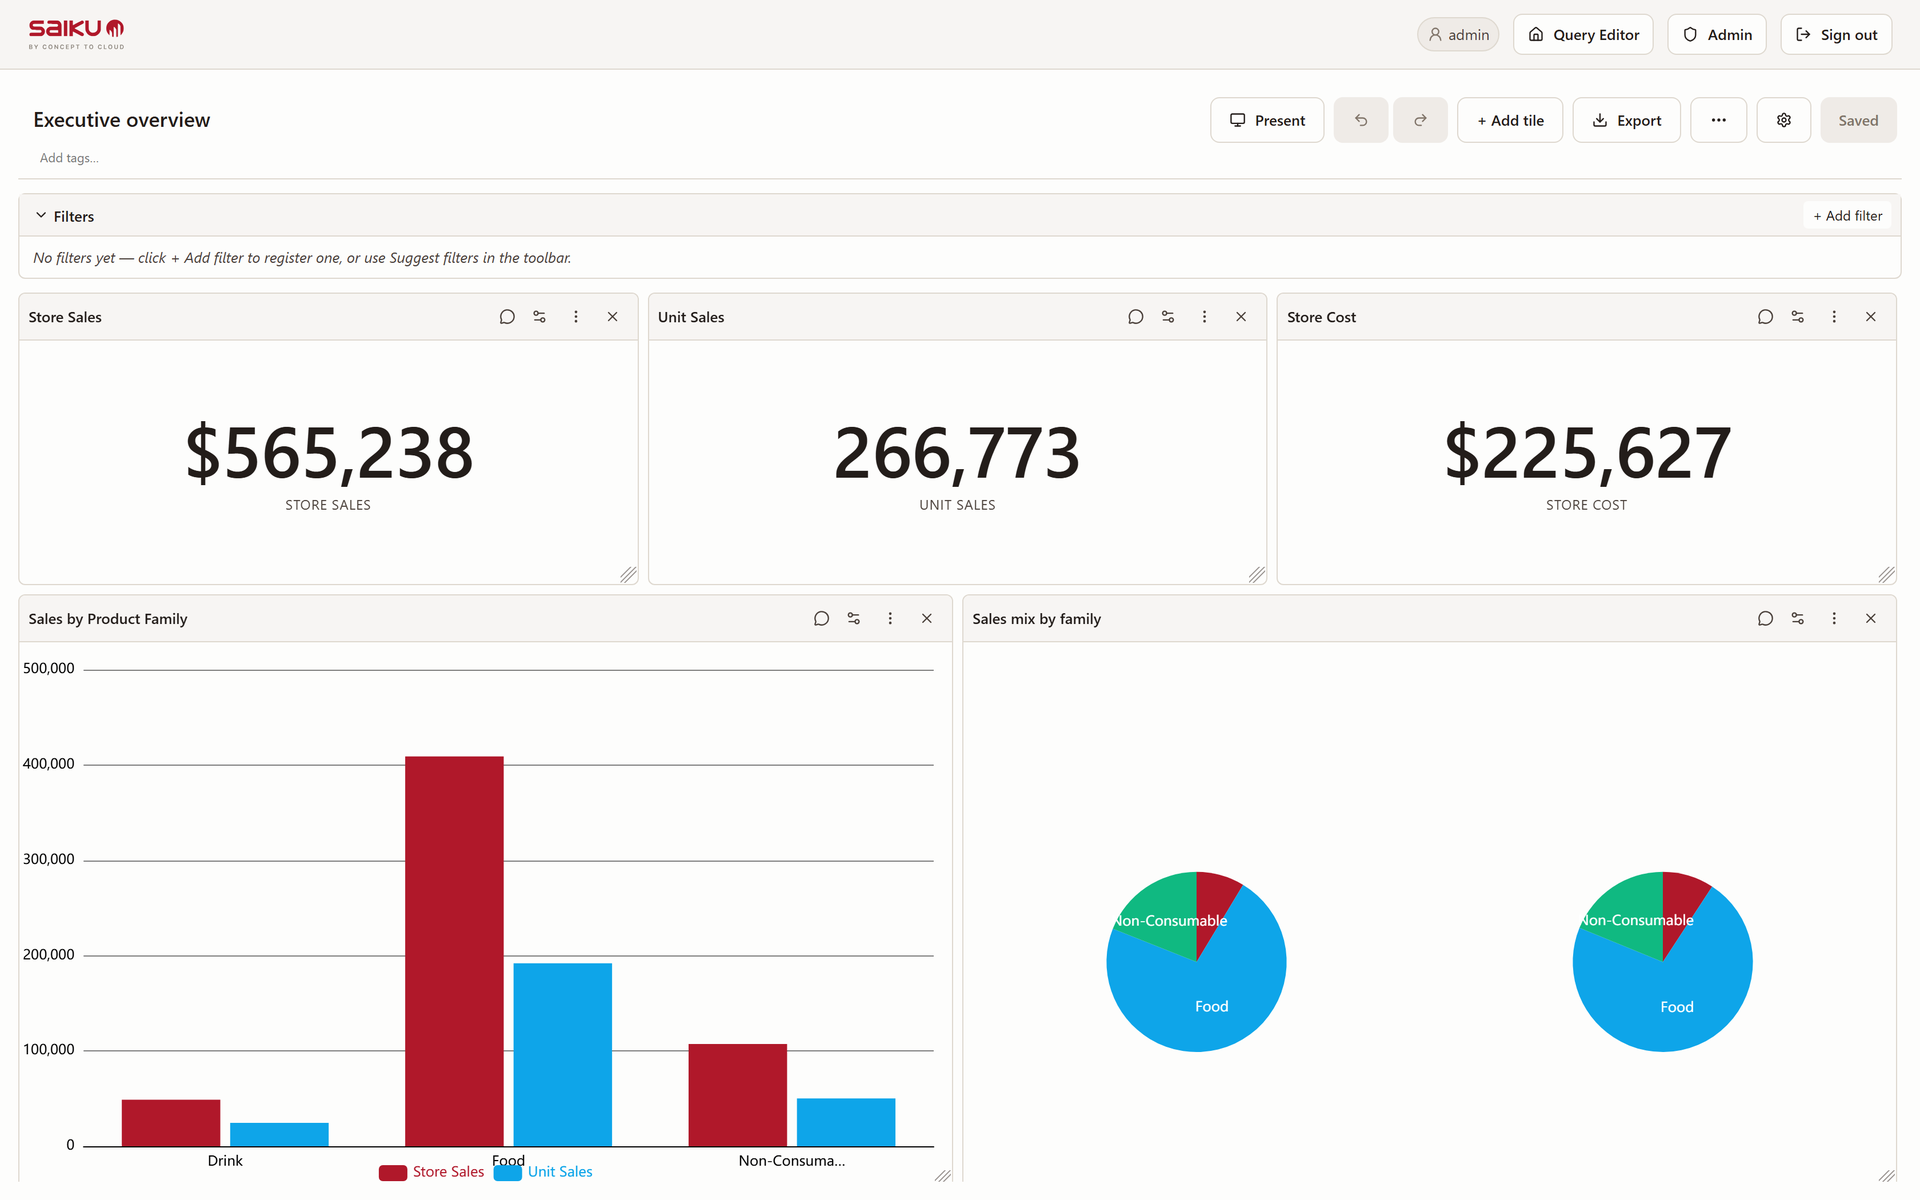
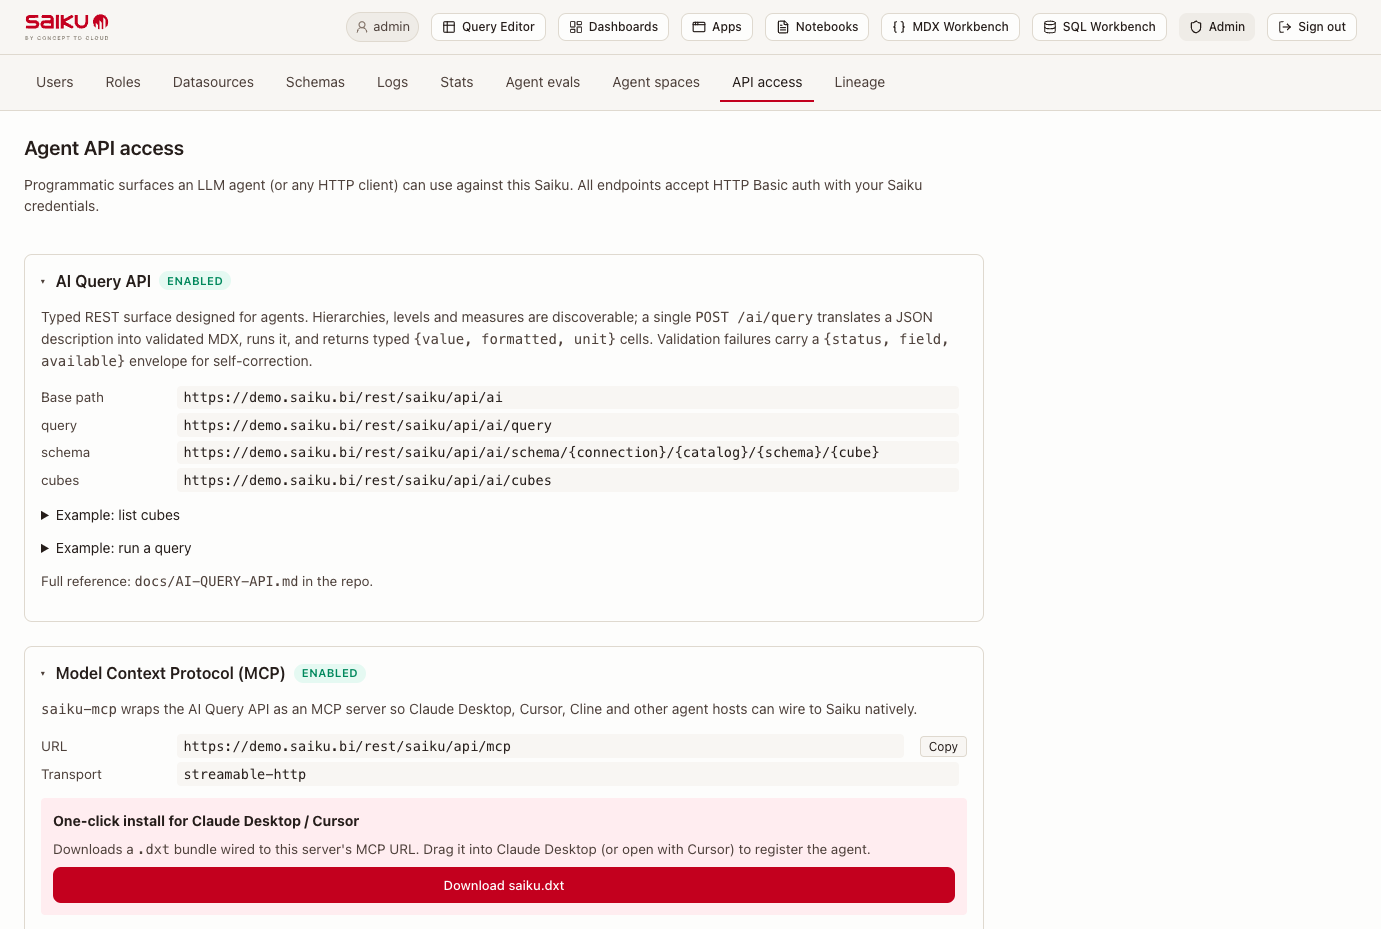
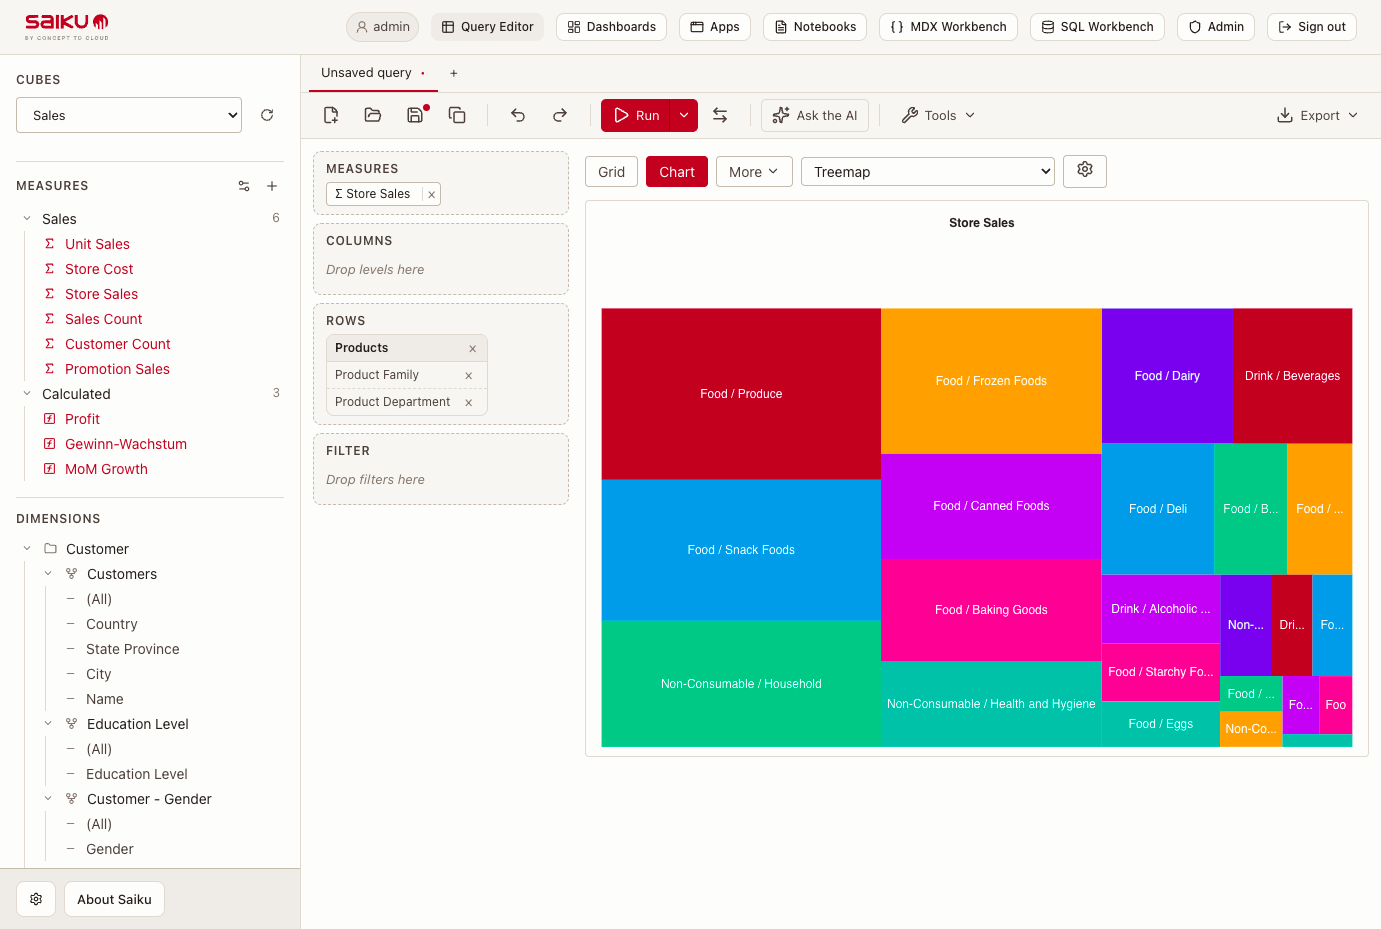
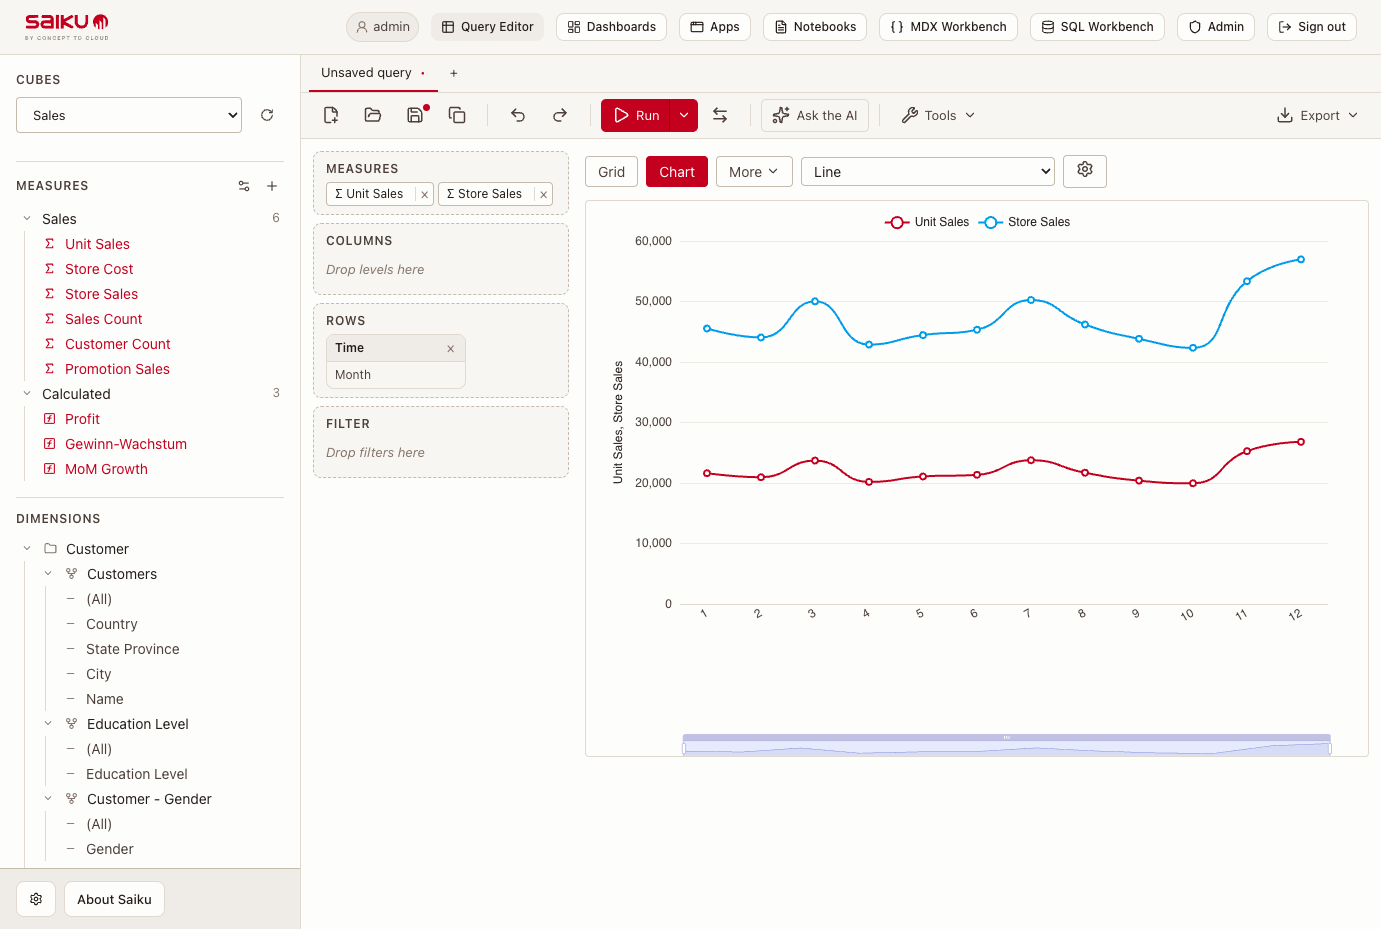
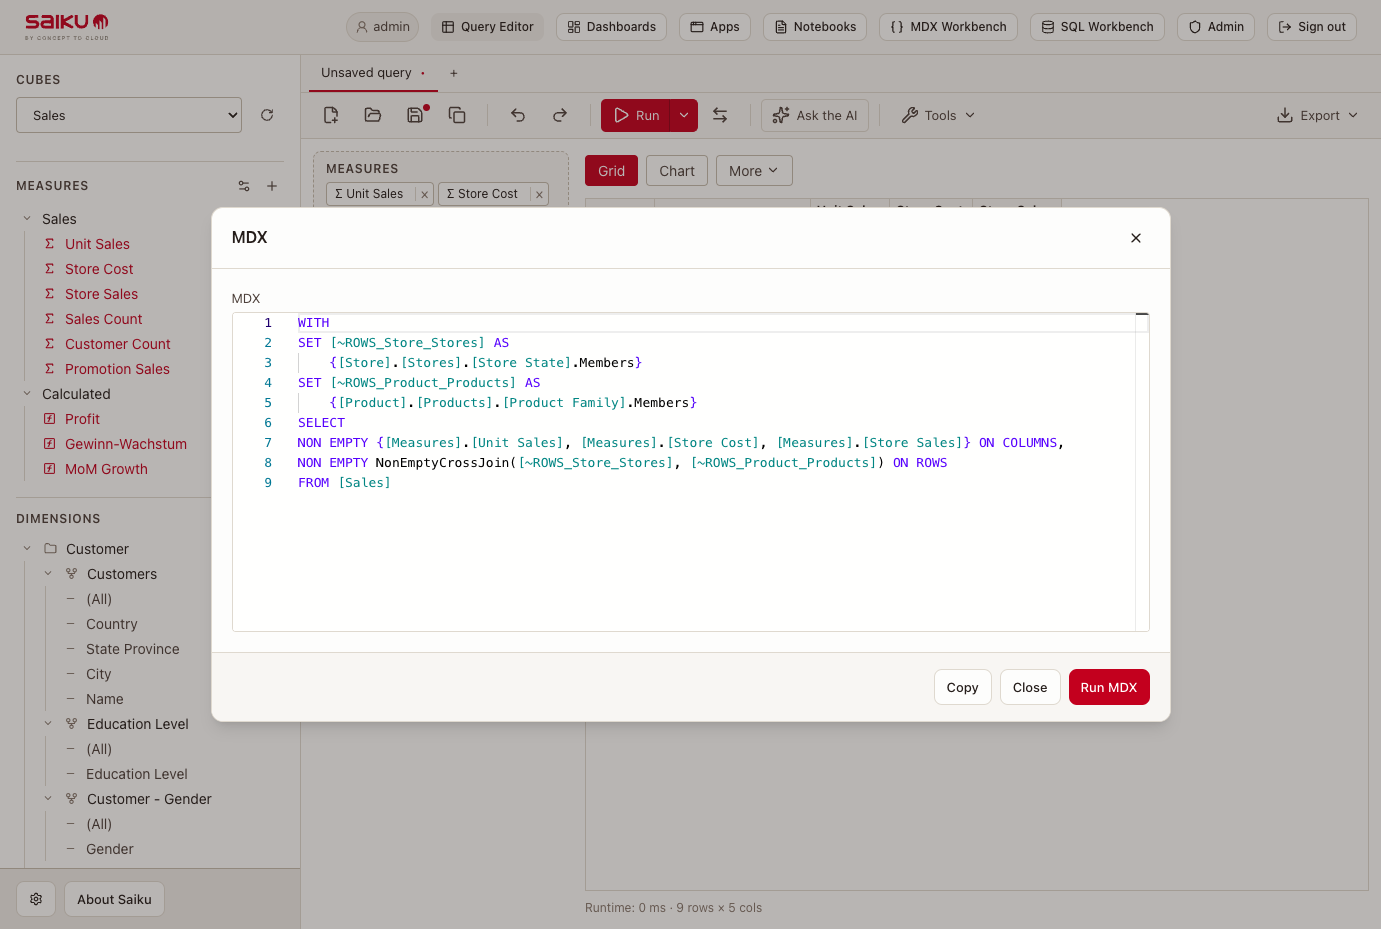
Point Excel, dashboards, and AI agents at one governed cube and Saiku Analytics, an open-source semantic layer, answers all three with the same numbers. The Query Editor writes the MDX as analysts drop measures and levels onto rows, columns, and filters, then shows a pivot grid or 16 chart types such as treemap and sunburst. Dashboards mix KPI, chart, table, text, and image tiles with cross-filtering, drill-down, conditional formatting, and forecast overlays, then export to PDF or PNG, share read-only links, or embed as a web component. An Excel add-in drops governed PivotTables that refresh live, and a Google Sheets add-on inserts cube data as tables that refresh in place. Agents get a typed REST API that lists cubes and measures, accepts JSON questions at /ai/query, and returns the exact field and legal values when validation fails. An MCP server connects Claude Desktop, Cursor, and Cline with a one-click .dxt install, and agent spaces limit each persona to chosen cubes and markdown skills. No semantic model yet? Saiku drafts cubes, dimensions, measures, and joins from a warehouse schema for review. Queries run on DuckDB, ClickHouse, Snowflake, BigQuery, Postgres, and dozens more databases, and model diff flags every saved query or dashboard a schema change would break. Okta and Entra ID provision accounts over SCIM 2.0, and sign-in runs through OIDC or SAML. Running on a dedicated VPS on RepoCloud with guaranteed CPU, RAM, and SSD, full root SSH access, and a browser serial console. Apache-2.0 licensed.
Benefits
- One Set Of Numbers Everywhere
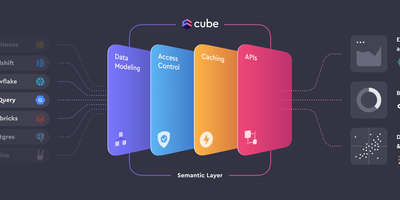
- Metrics, hierarchies, and calculated measures are defined once in the cube, so Excel PivotTables, dashboards, and AI agents return identical figures instead of three competing versions of revenue.
- Analysis Without Writing MDX
- Drag measures and levels onto rows, columns, and filters and the Query Editor generates the MDX, so analysts get pivots, charts, and exports without learning a query language.
- Agents That Stop Guessing Columns
- Self-describing schemas and validation errors that list legal values let Claude Desktop, Cursor, or any MCP client pick real measures and dimensions by name instead of inventing SQL columns.
- Keep Your Own Warehouse
- Calcite translates cube queries into SQL for DuckDB, ClickHouse, Snowflake, BigQuery, or Postgres, so analytics runs against the database you already pay for, on a server you control.
Features
- Drag-And-Drop Query Editor
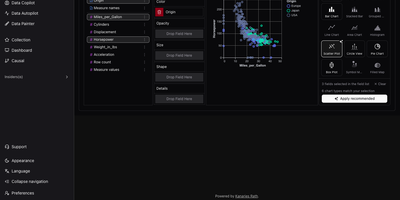
- Drop levels and measures onto columns, rows, and filters, view results as a grid or one of 16 chart types, then save queries, swap axes, and export.
- Interactive Dashboards
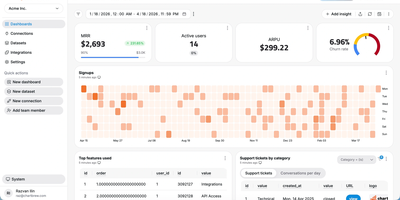
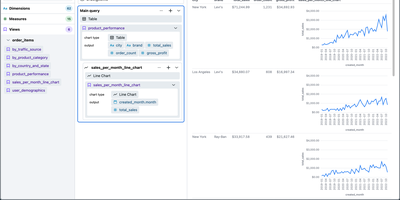
- KPI, chart, table, text, and image tiles gain cross-filtering, drill-down, conditional formatting, anomaly and forecast overlays, auto-refresh, PDF or PNG export, and read-only share links.
- AI Query API
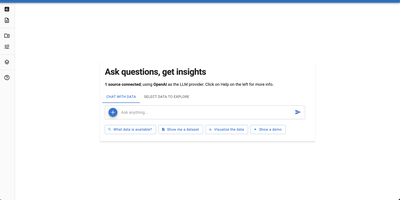
- A typed REST surface lists cubes and schemas, turns JSON questions posted to /ai/query into validated MDX, and returns typed cells with self-correcting error envelopes.
- MCP Server And Agent Spaces
- Claude Desktop, Cursor, and Cline connect over streamable HTTP or a one-click .dxt install, and agent spaces confine personas to chosen cubes and markdown skills.
- Excel And Sheets Add-ins
- An Office.js Excel add-in places live-refreshing governed PivotTables on Windows and macOS, and a Google Sheets add-on inserts cube data as tables that refresh in place.
- Docker Container Deployment
- One ghcr.io container serves the interface at /ui/ on port 8080, runs as a non-root user, and refuses default admin credentials until SAIKU_ADMIN_PASSWORD is set.