Stars
Forks
Watchers
Developer links
ClickStack
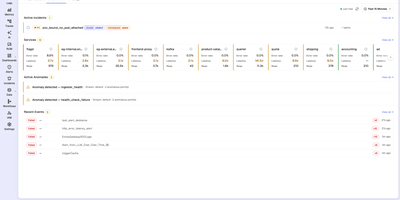
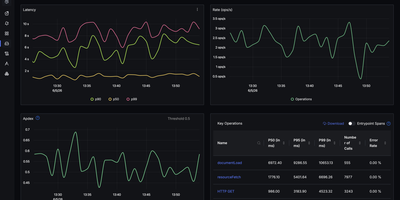
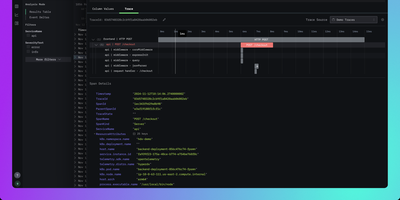
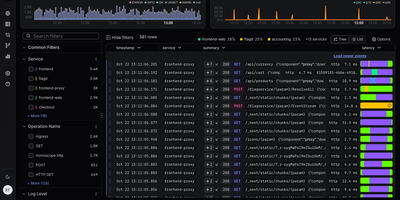
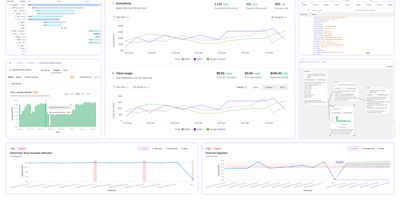
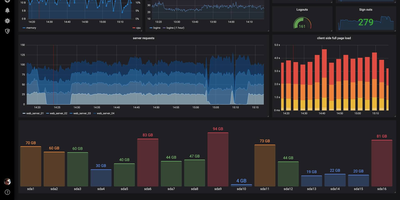
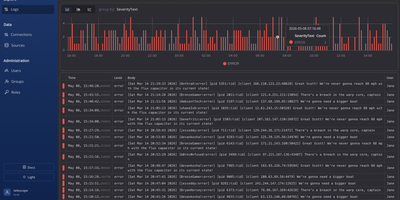
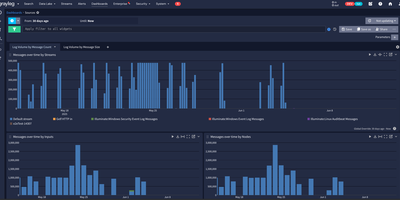
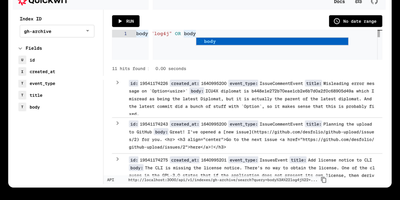
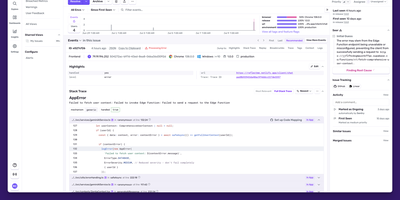
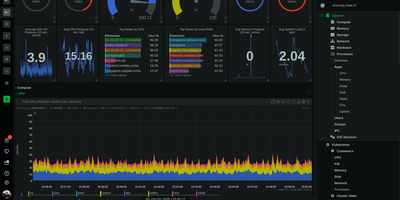
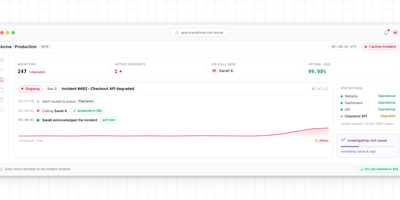
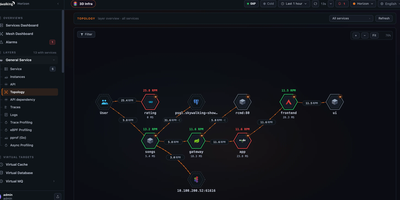
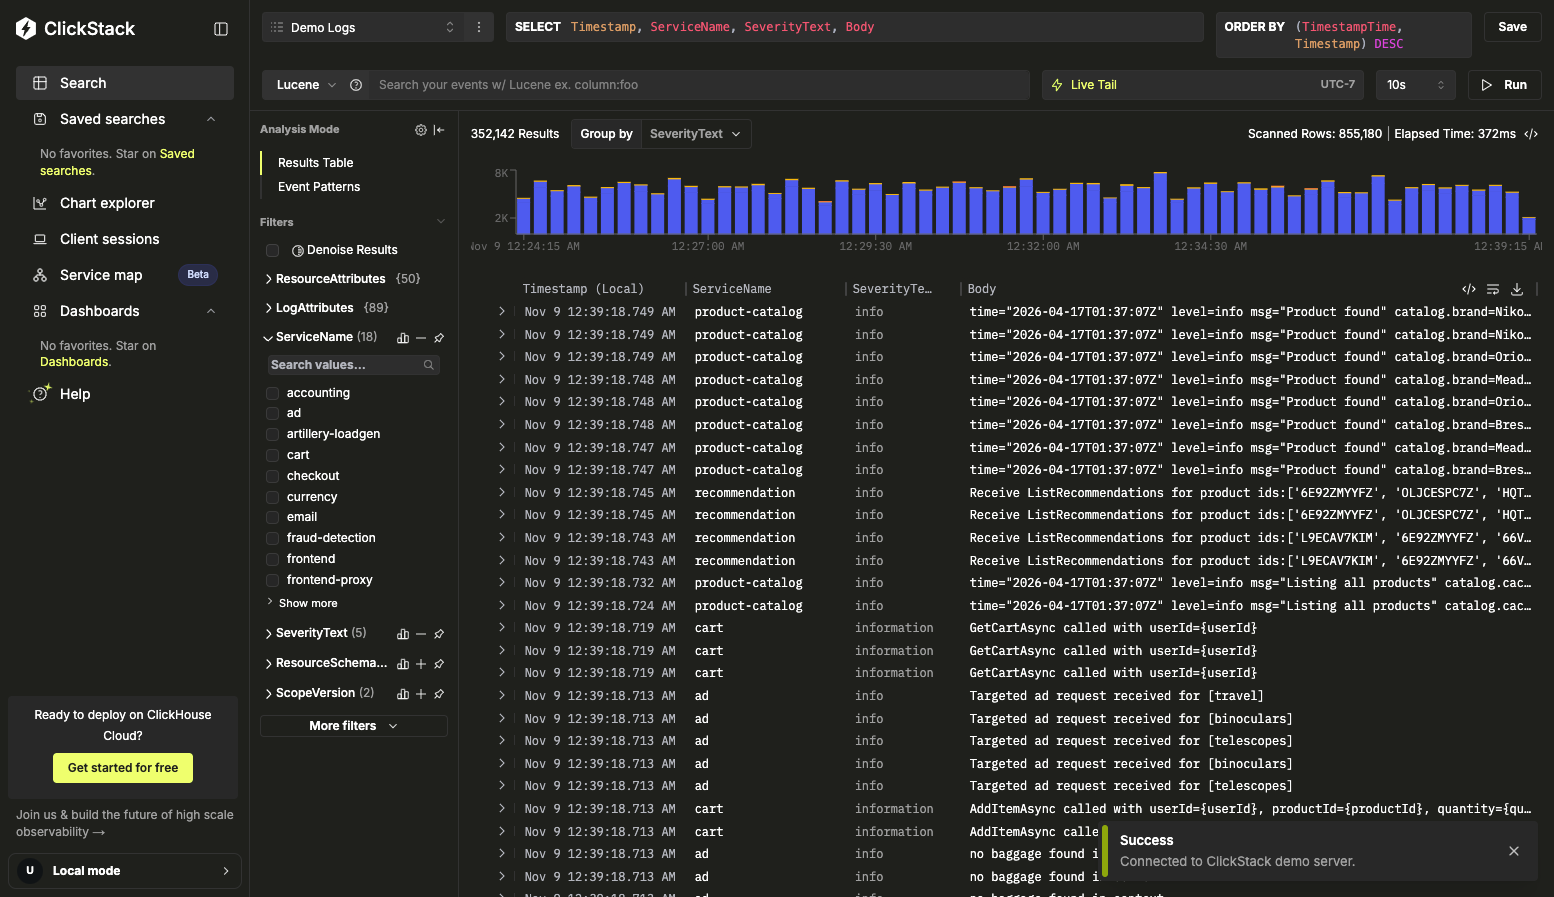
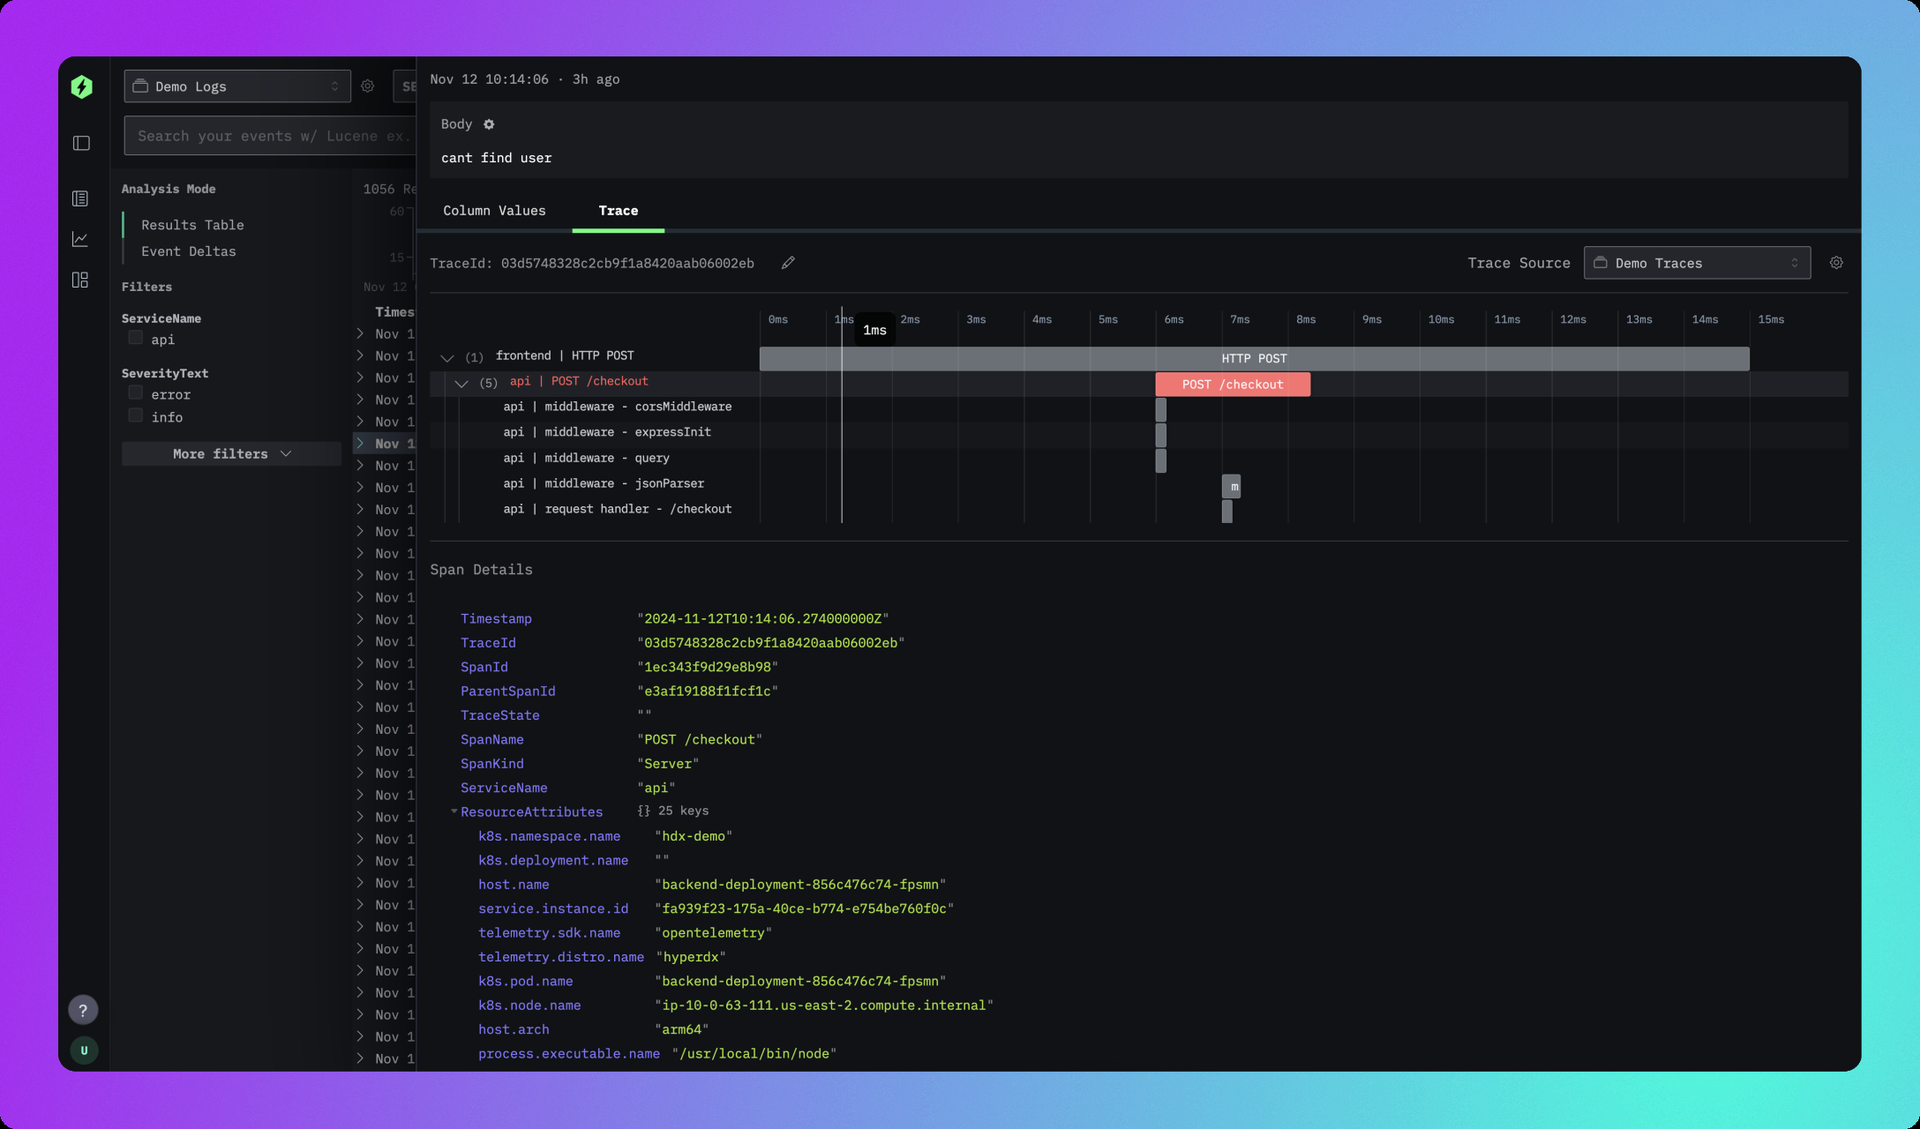
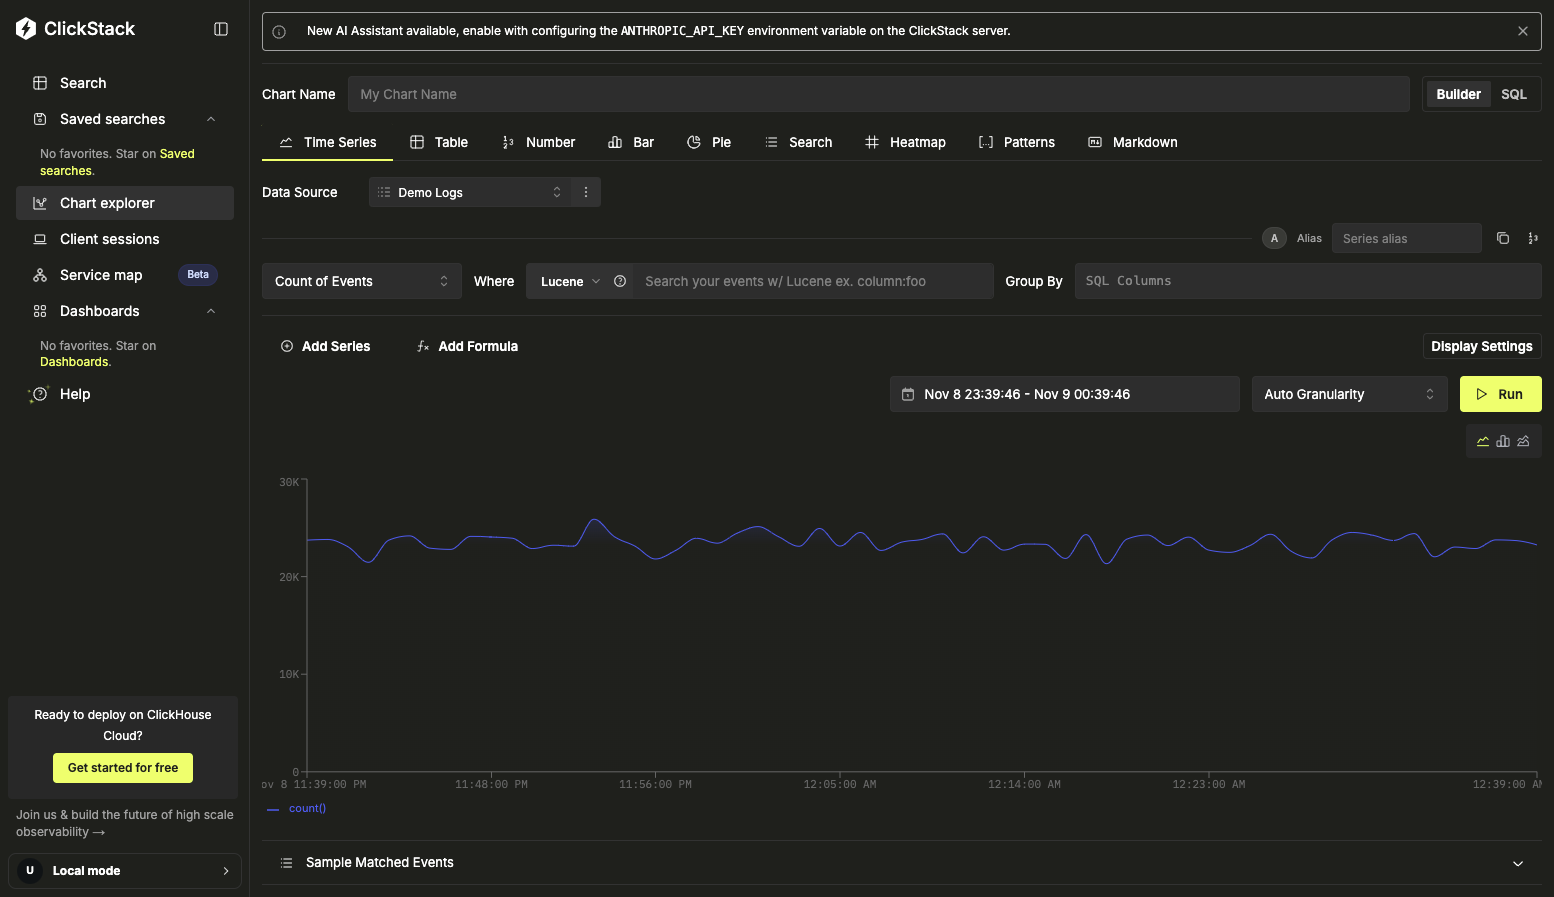
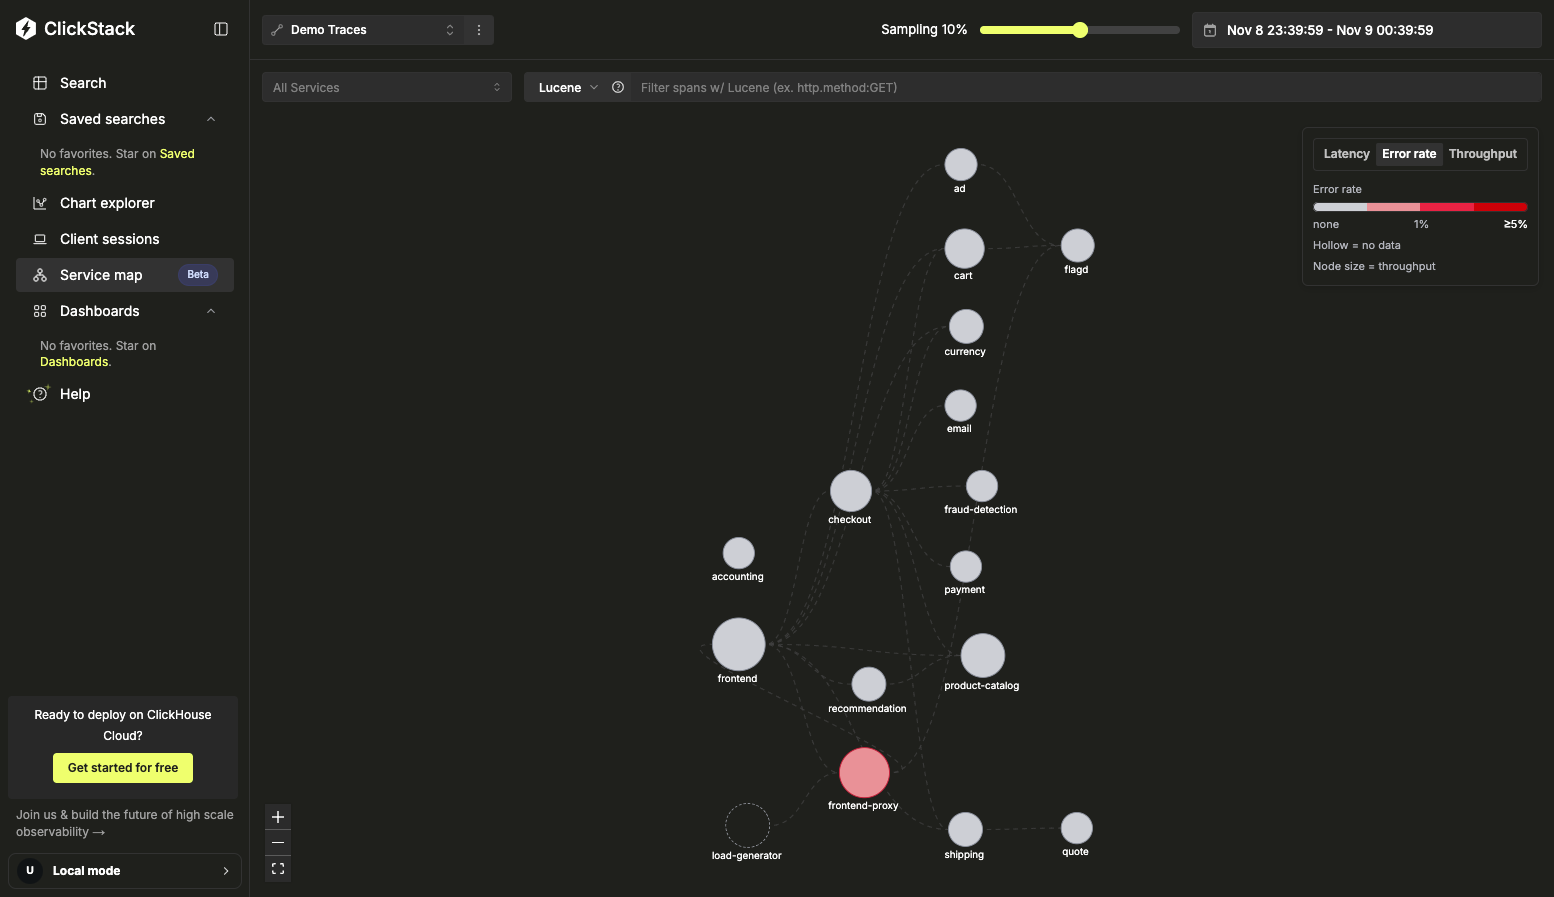
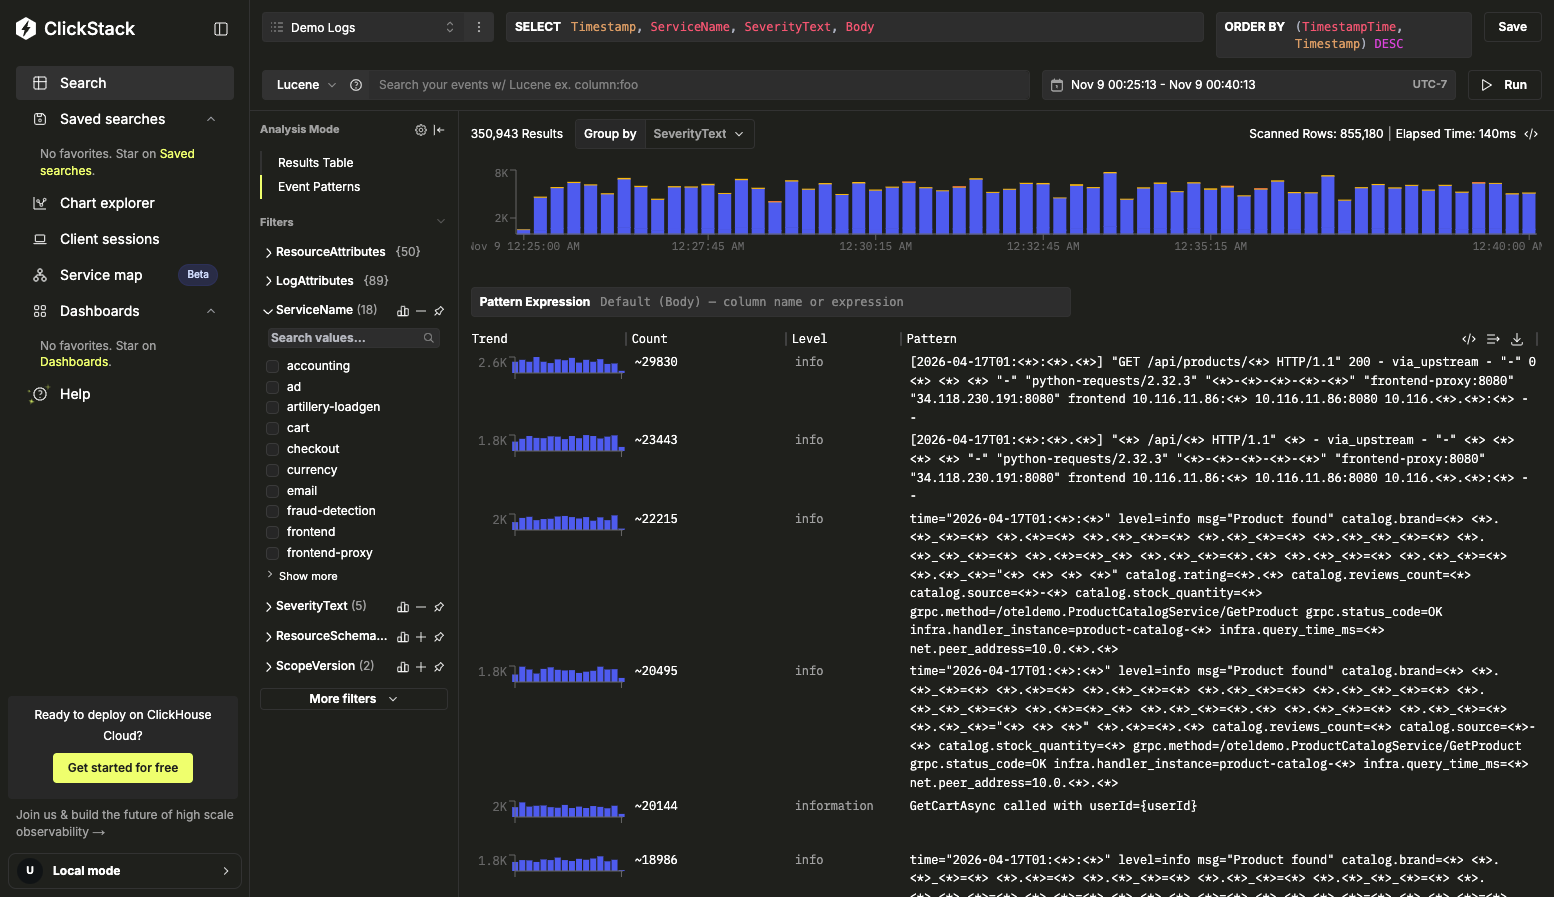
ClickStack is an open-source observability platform that unifies logs, metrics, traces, session replays, and errors in one searchable interface, so engineers can move from an alert to the exact request that broke in minutes. Search uses an intuitive full-text and property syntax (for example level:err), with SQL available when a question needs full analytical power. Live tail streams fresh logs and traces as they arrive, and event deltas surface anomalies by comparing current behavior against earlier windows. Dashboards chart high-cardinality events without a complex query language, and alerts can be created in a few clicks from any search or chart. Session replays connect a user's browser experience to the backend traces and database queries behind it, giving full-stack visibility from click to query. Native JSON string querying handles nested payloads, and the schema-agnostic design works on top of an existing ClickHouse schema instead of forcing a new one. OpenTelemetry is supported out of the box, with SDKs and collectors for Kubernetes, JavaScript, Python, Java, Go, Ruby, PHP, .NET, Elixir, and Rust. The all-in-one Docker image bundles the interface, ClickHouse, the OpenTelemetry Collector, and supporting services on port 8080, and a terminal CLI serves engineers who prefer the shell. Running on a dedicated VPS on RepoCloud with guaranteed CPU, RAM, and SSD, full root SSH access, and a browser serial console. MIT licensed.
Benefits
- One Search Across Telemetry
- Logs, metrics, traces, session replays, and errors live in one interface, so an investigation moves from symptom to cause without switching tools or correlating timestamps by hand across systems.
- Fast Queries At Scale
- ClickHouse columnar storage and optimized schemas search terabytes of telemetry in seconds, handling billions of high-cardinality events daily without pre-aggregation or manual index tuning.
- OpenTelemetry Native Ingestion
- The bundled collector accepts OpenTelemetry data on standard ports, and SDKs cover Kubernetes, JavaScript, Python, Java, Go, Ruby, PHP, .NET, Elixir, and Rust services.
- From Alert To Cause
- Event deltas highlight anomalies, alerts are created in a few clicks from searches, and session replays link browser behavior to backend traces and database queries.
Features
- Lucene-Style Search
- Full-text and property search syntax queries logs and traces directly, with optional SQL for advanced analysis and native querying inside JSON payloads.
- Live Tail Streaming
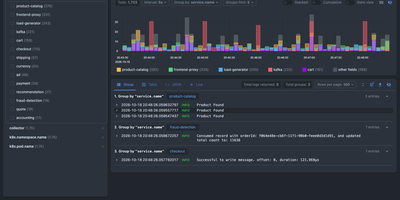
- Fresh logs and traces stream into the interface as they arrive, so deploys and incidents can be watched in real time without refreshing.
- Dashboards And Alerts
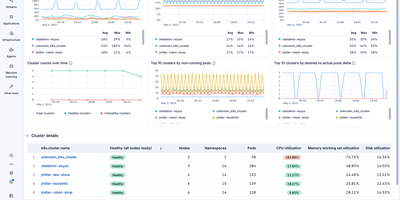
- High-cardinality events become charts without a complex query language, and alerts can be created in a few clicks from any search result.
- Session Replay Correlation
- Browser session replays connect to backend traces and database queries, showing the full path from a user click to the failing request.
- All-In-One Docker Image
- One image bundles the interface, ClickHouse, the OpenTelemetry Collector, and MongoDB, exposing the UI on port 8080 and OTLP on 4317 and 4318.