Stars
Forks
Watchers
Developer links
Pinpoint
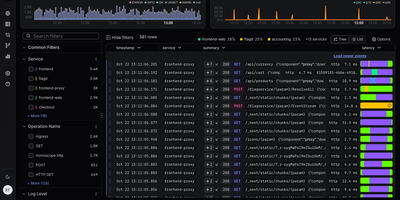
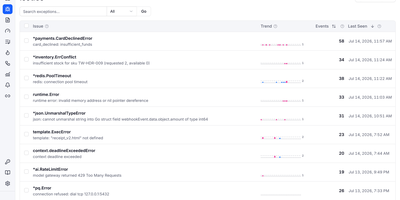
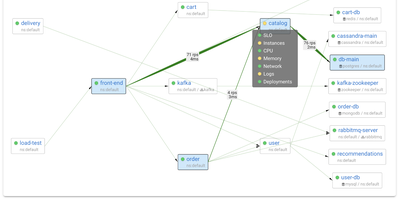
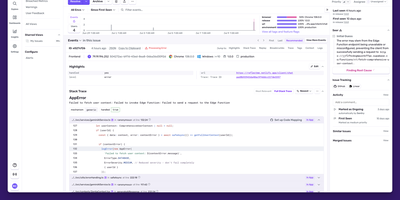
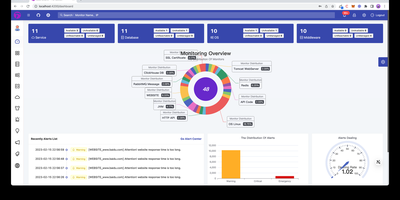
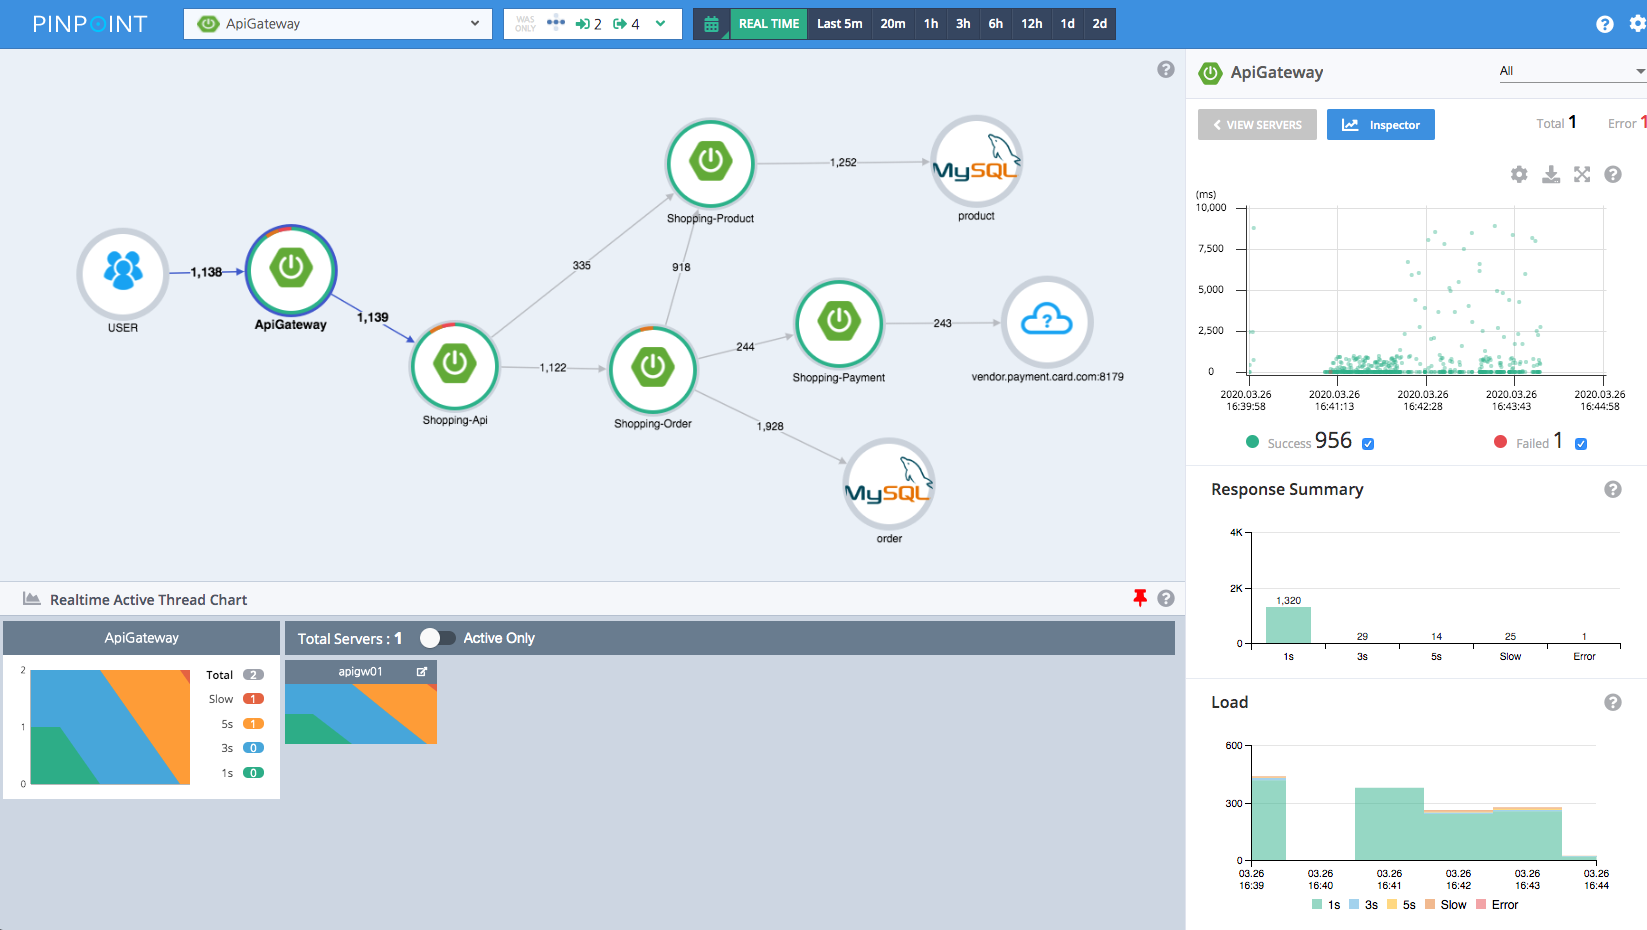
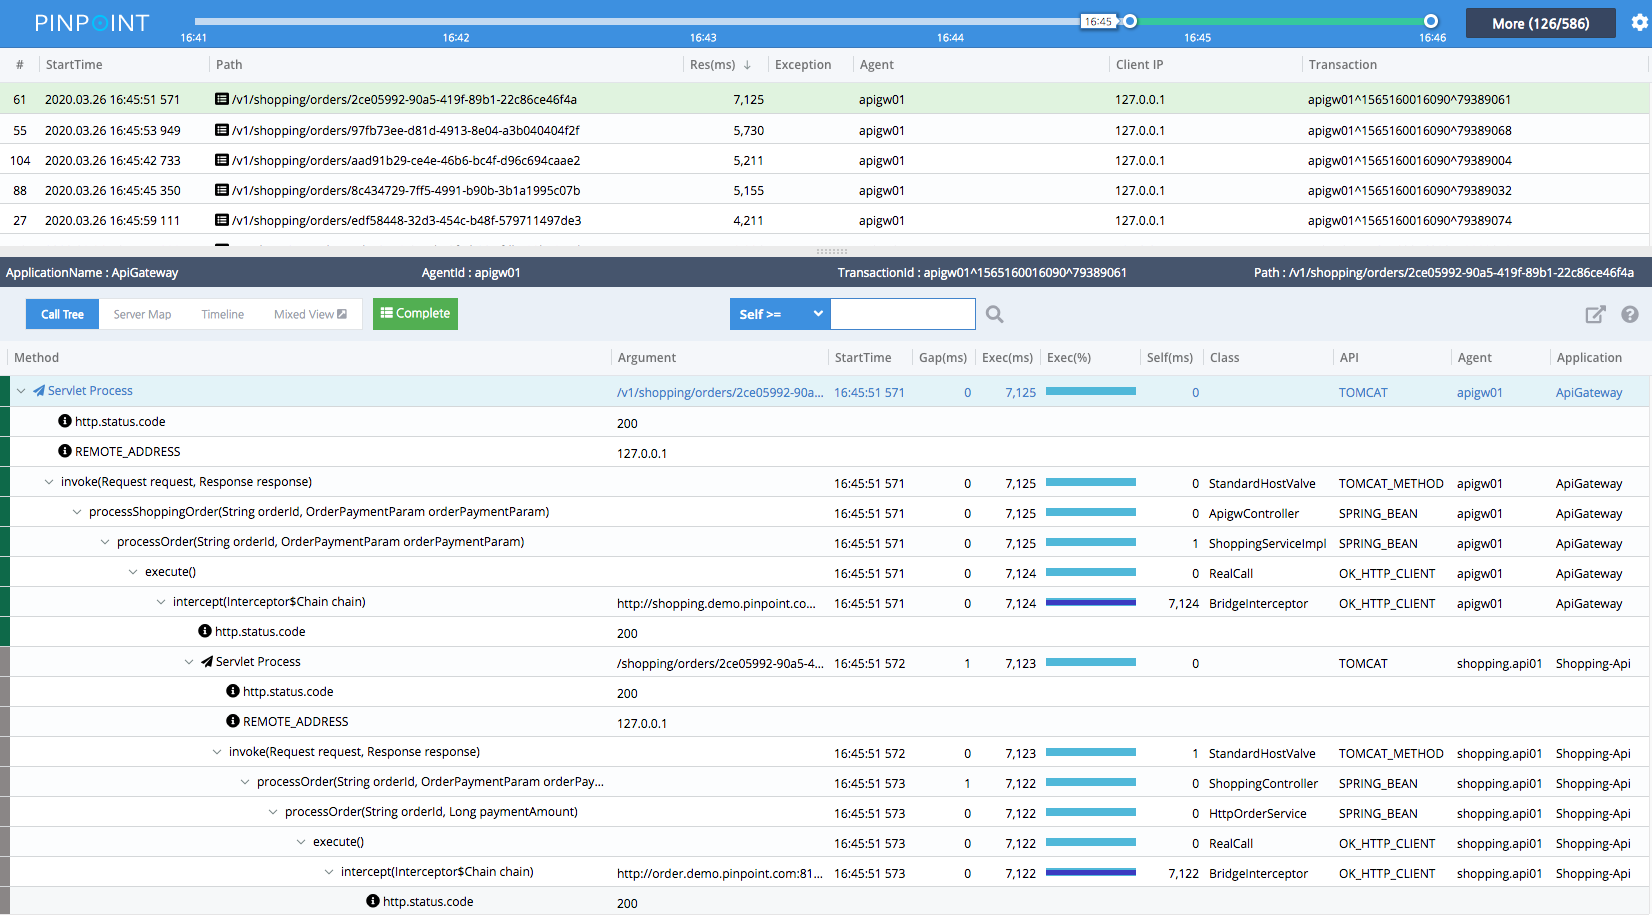
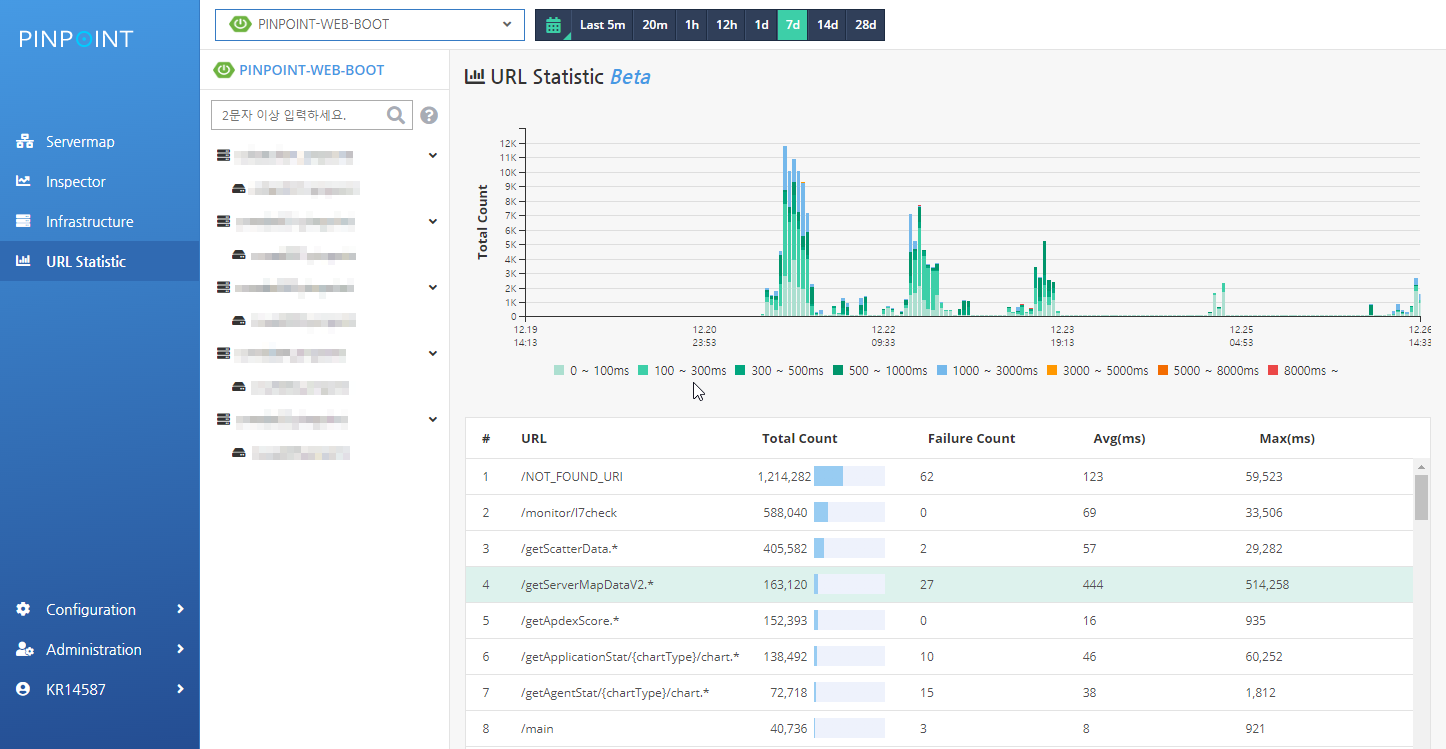
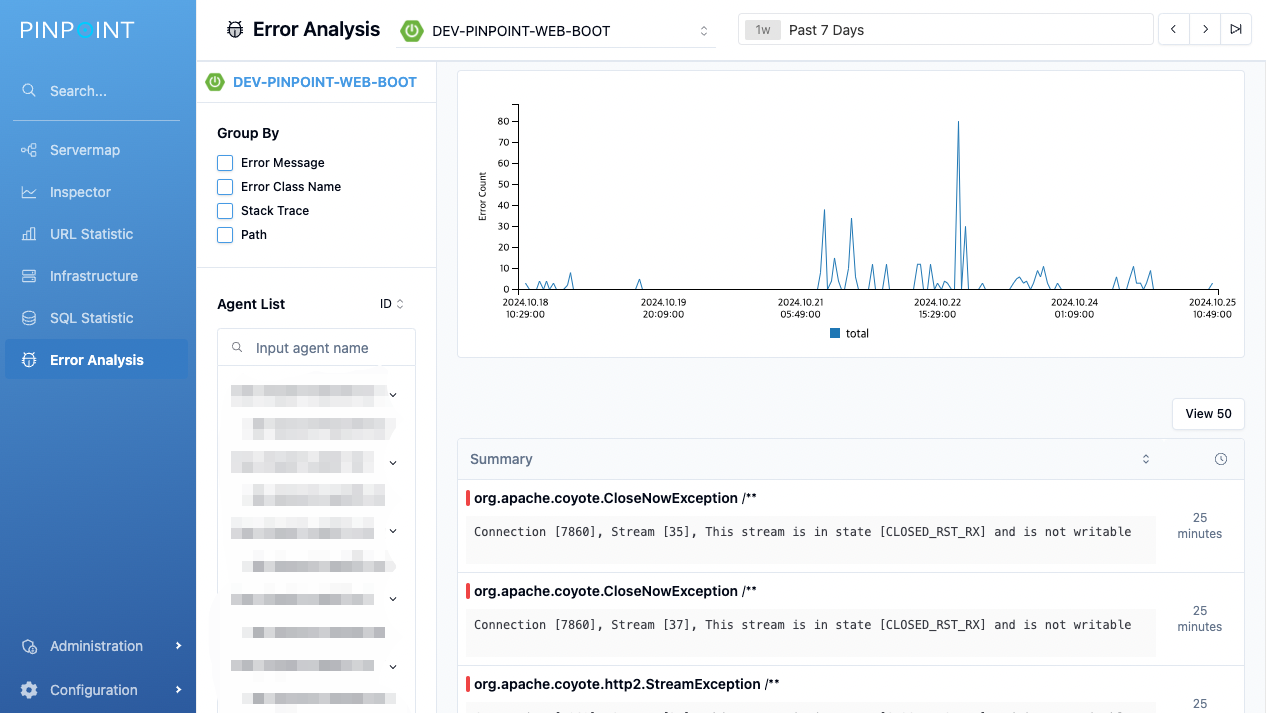
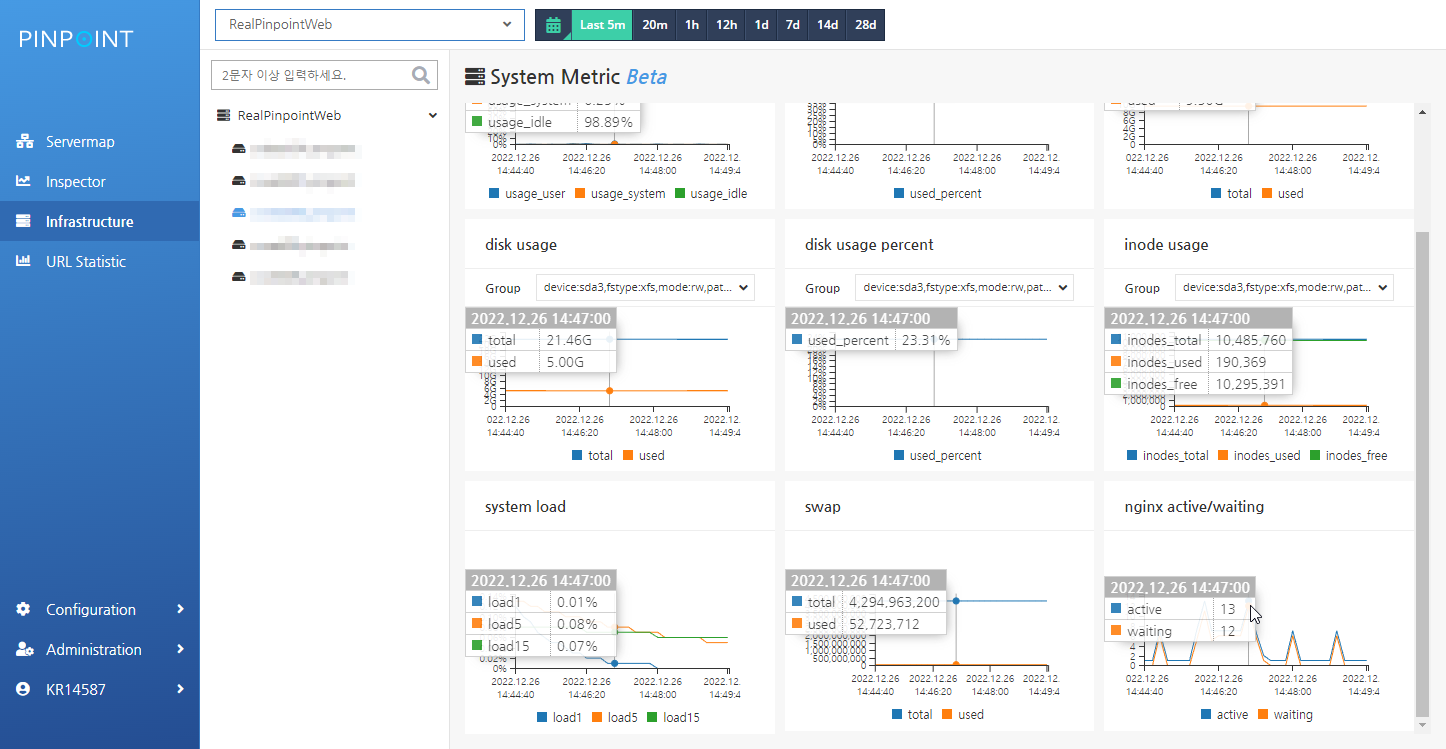
When checkout slows to a crawl somewhere across forty services, Pinpoint draws you the map of what is actually talking to what and where the time went. The ServerMap renders your whole topology live: services, databases, message queues, and external APIs as nodes whose edges carry transaction counts and error rates, so the unhealthy dependency announces itself visually. Click a node and the scatter chart plots every request against its response time; drag across the suspicious cluster and the CallStack opens those exact transactions at code level, method by method, SQL statement by SQL statement, until the bottleneck has nowhere to hide. The Inspector watches each application's CPU, memory, garbage collection, TPS, and JVM arguments, while realtime active-thread charts show stuck work as it happens. Agents attach to Java, PHP, and Python applications without changing a line of code, and applications already instrumented with OpenTelemetry send their traces straight in over OTLP. Group applications into services so each team sees its own Service Map, then arm alarm templates for slow counts, error rates, and thread saturation before users notice. Error Analysis gathers exceptions and error logs grouped by route, and URI metrics rank your hottest endpoints by cost. Running on a dedicated VPS on RepoCloud with guaranteed CPU, RAM, and SSD, full root SSH access, and a browser serial console. Apache-2.0 licensed.
Benefits
- Topology You Can See
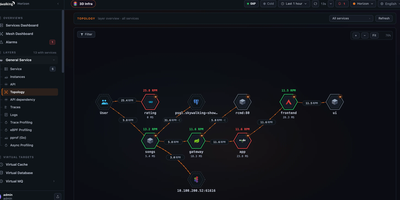
- The ServerMap visualizes every service, database, queue, and external API as connected nodes with live transaction counts and error rates, replacing architecture diagrams that drift out of date within a sprint.
- Code-Level Answers In Clicks
- Dragging across the scatter chart opens the CallStack for exactly those transactions, with method timing and SQL text, so a latency spike resolves to a specific call instead of a guessing game.
- Agents Without Code Changes
- Bytecode-instrumented agents for Java, PHP, and Python attach to running applications with roughly three percent overhead, and OpenTelemetry traces ingest natively for already-instrumented services.
- Alarms Organized By Service
- Applications group into services with their own maps and focus, and alarm templates apply consistent slow-count, error, and saturation rules across many applications in a few clicks.
Features
- ServerMap And Service Map
- Distributed components render as an interactive topology where node clicks reveal status, transaction counts, and response summaries for the selected service or grouped service.
- Scatter Chart And Heatmap
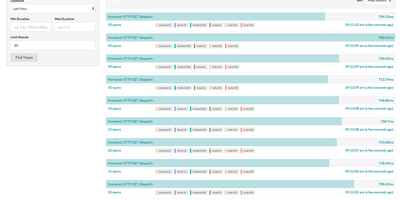
- Every request plots by response time with success and failure coloring, while the heatmap aggregates transaction density for fast pattern recognition over large volumes.
- CallStack Transaction Tracing
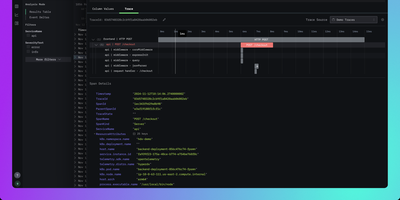
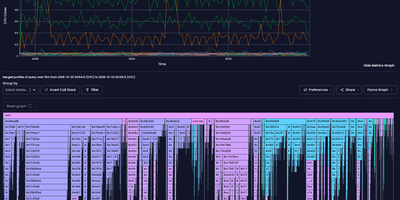
- Selected transactions expand into a single call tree spanning services, showing method executions, JDBC and SQL calls, and remote invocations with elapsed times.
- Inspector And Active Threads
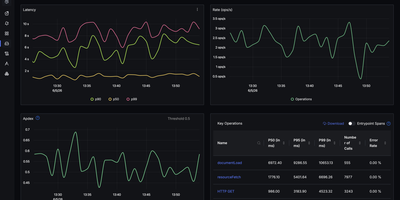
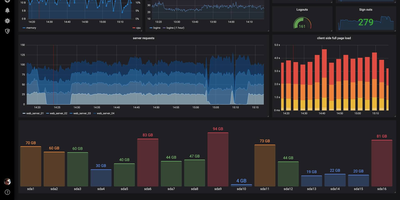
- Per-application dashboards chart CPU, heap and garbage collection, TPS, and JVM arguments, with a realtime active-thread view exposing blocked work as it accumulates.
- OpenTelemetry Trace Ingestion
- The collector accepts OTLP traces over gRPC and HTTP in protobuf and JSON, merging OpenTelemetry spans into the same maps, transaction lists, and error analysis as agent data.