Stars
Forks
Watchers
Developer links
OmniSight
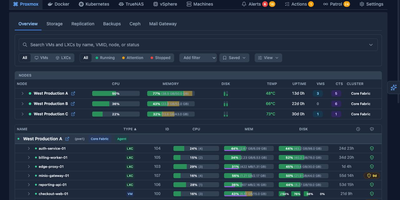
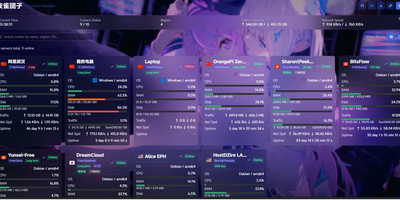
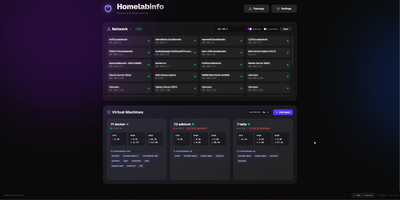
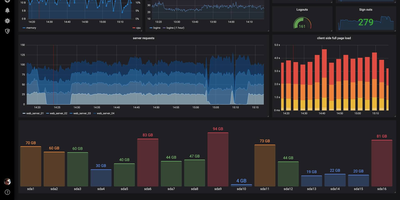
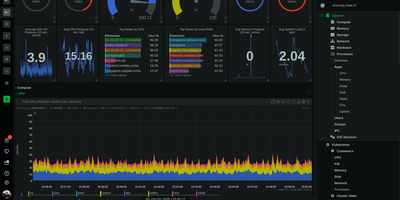
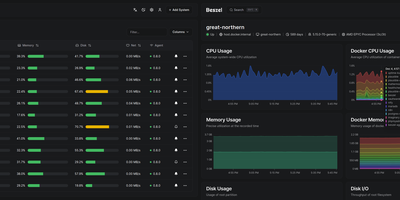
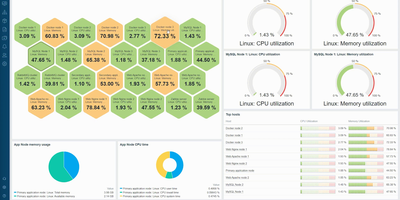
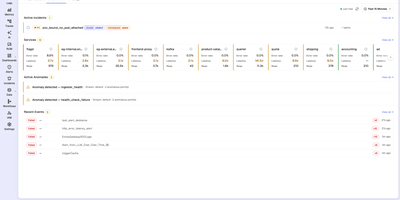
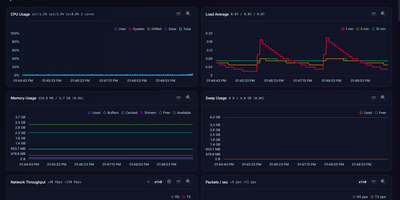
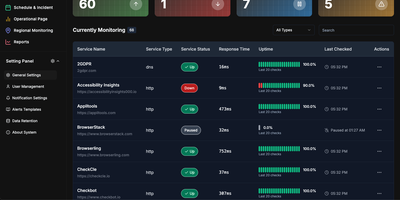
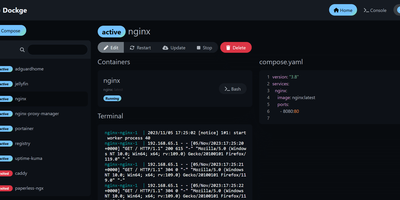
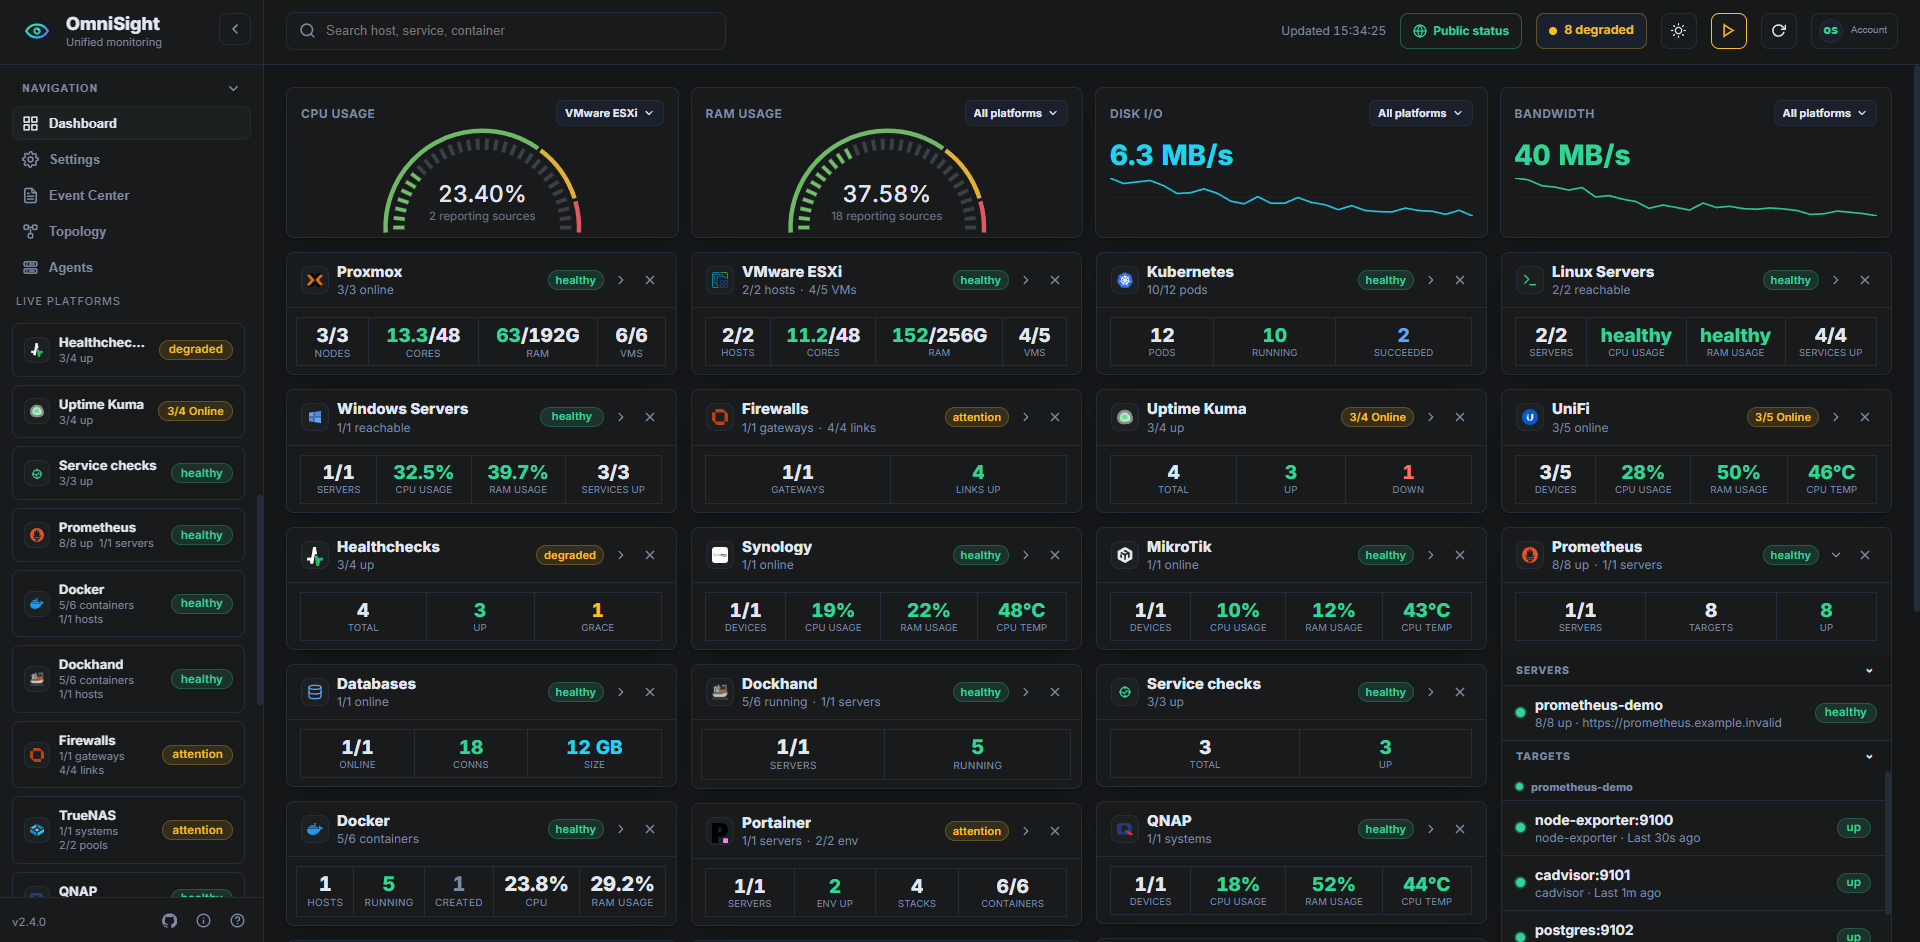
OmniSight ends the homelab ritual of a dozen admin panels open in a dozen tabs, each with its own login and its own idea of what healthy looks like. It folds all of them into one page that answers the only question you actually have: is everything fine? Watch Proxmox nodes with their VMs, containers, backup status, and Ceph health next to VMware hosts and datastores, Linux and Windows servers, and Kubernetes pods with live log viewing. Add Docker hosts and see container status, ports, resource use, and image updates, check OPNsense firewalls, TrueNAS and QNAP storage, and PostgreSQL, MySQL, and MongoDB databases without leaving the dashboard. A small push agent installs with one copied command and self-registers within seconds, needing no inbound firewall rules, so machines behind NAT report in on their own. Follow relationships on the topology map, restart a service from the detail view, export a full backup, and publish a read-only public status page for anyone who asks how things are running. Running on a dedicated VPS on RepoCloud with guaranteed CPU, RAM, and SSD, full root SSH access, and a browser serial console. GPL-2.0 licensed.
Benefits
- Every Platform One Page
- Proxmox, VMware, servers, Kubernetes, Docker, firewalls, NAS, and databases report into a single card-grid dashboard, replacing a dozen admin panels and logins.
- Agent Installs In Seconds
- Copy one pre-filled command onto a Linux, Windows, Proxmox, or Docker host and it self-registers and appears online, pushing data out with no inbound firewall rules.
- Act Without Leaving Dashboard
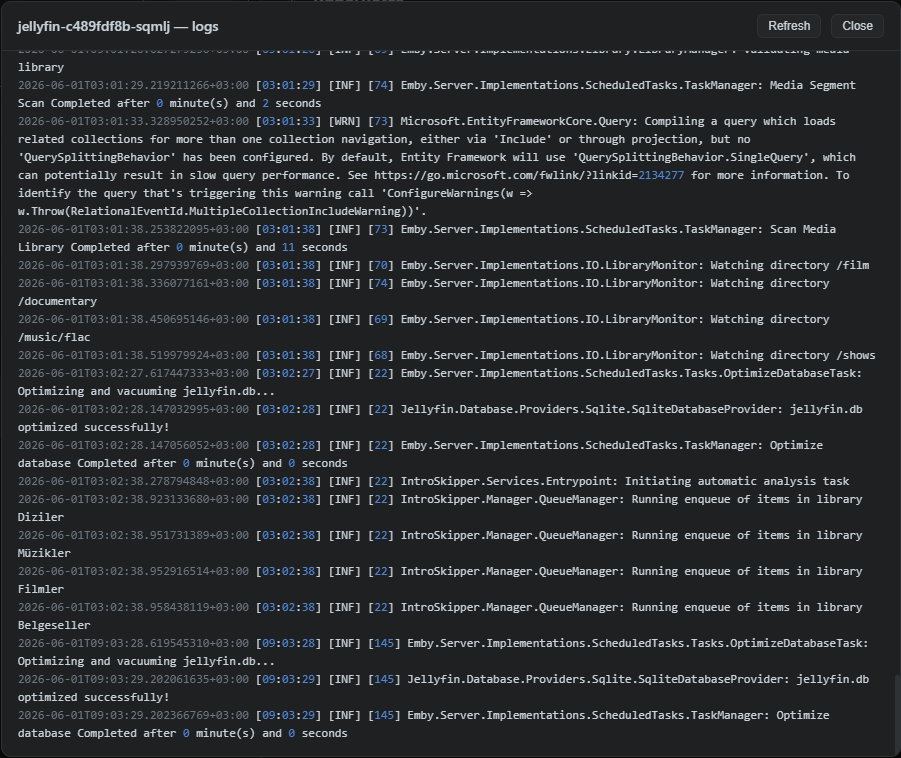
- Start, stop, and restart services, prune unused Docker images, and read live container and pod logs from the same detail views that show the problem.
- Public Status Included
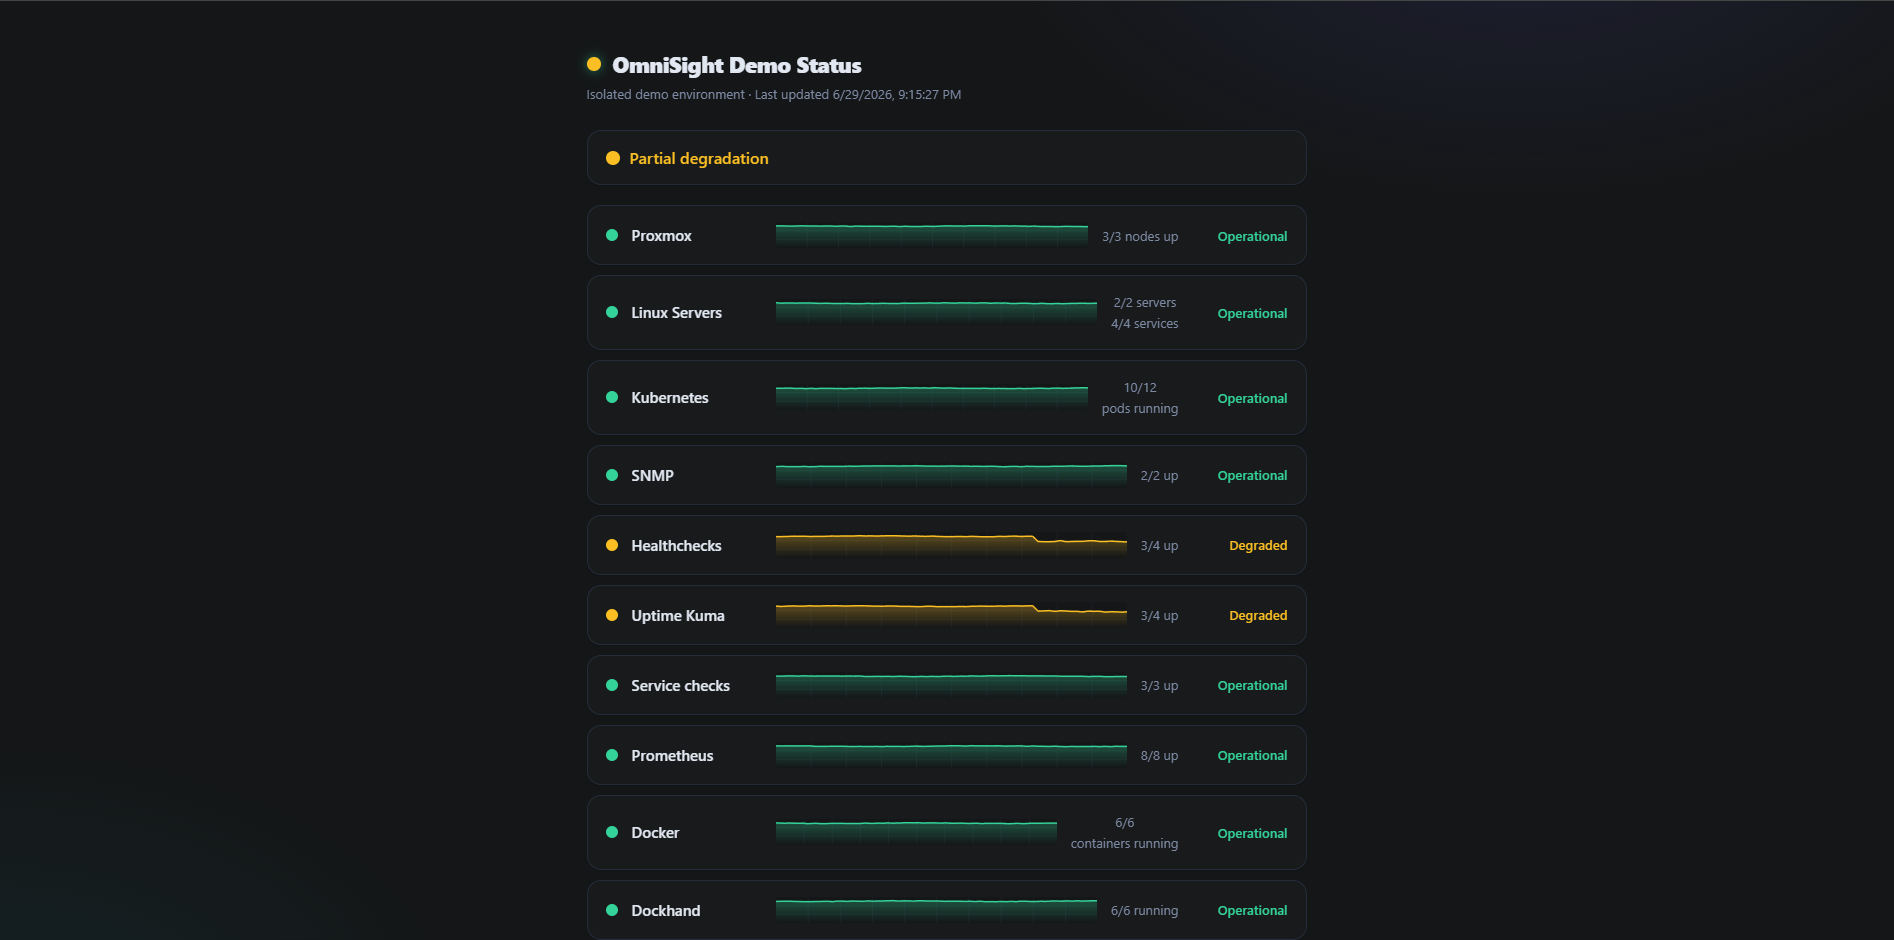
- A read-only public summary page at /status shows availability to anyone who needs it, while admin, operator, and read-only roles keep the full dashboard private.
Features
- Proxmox And VMware Views
- Node CPU, memory, temperature, and backup status for Proxmox with Ceph health, plus ESXi and vCenter hosts, VMs, and datastore capacity through vSphere.
- Kubernetes Monitoring
- Pod, deployment, and service status by namespace with expandable groups, a live pod log viewer, and CPU and memory sorting via the metrics API.
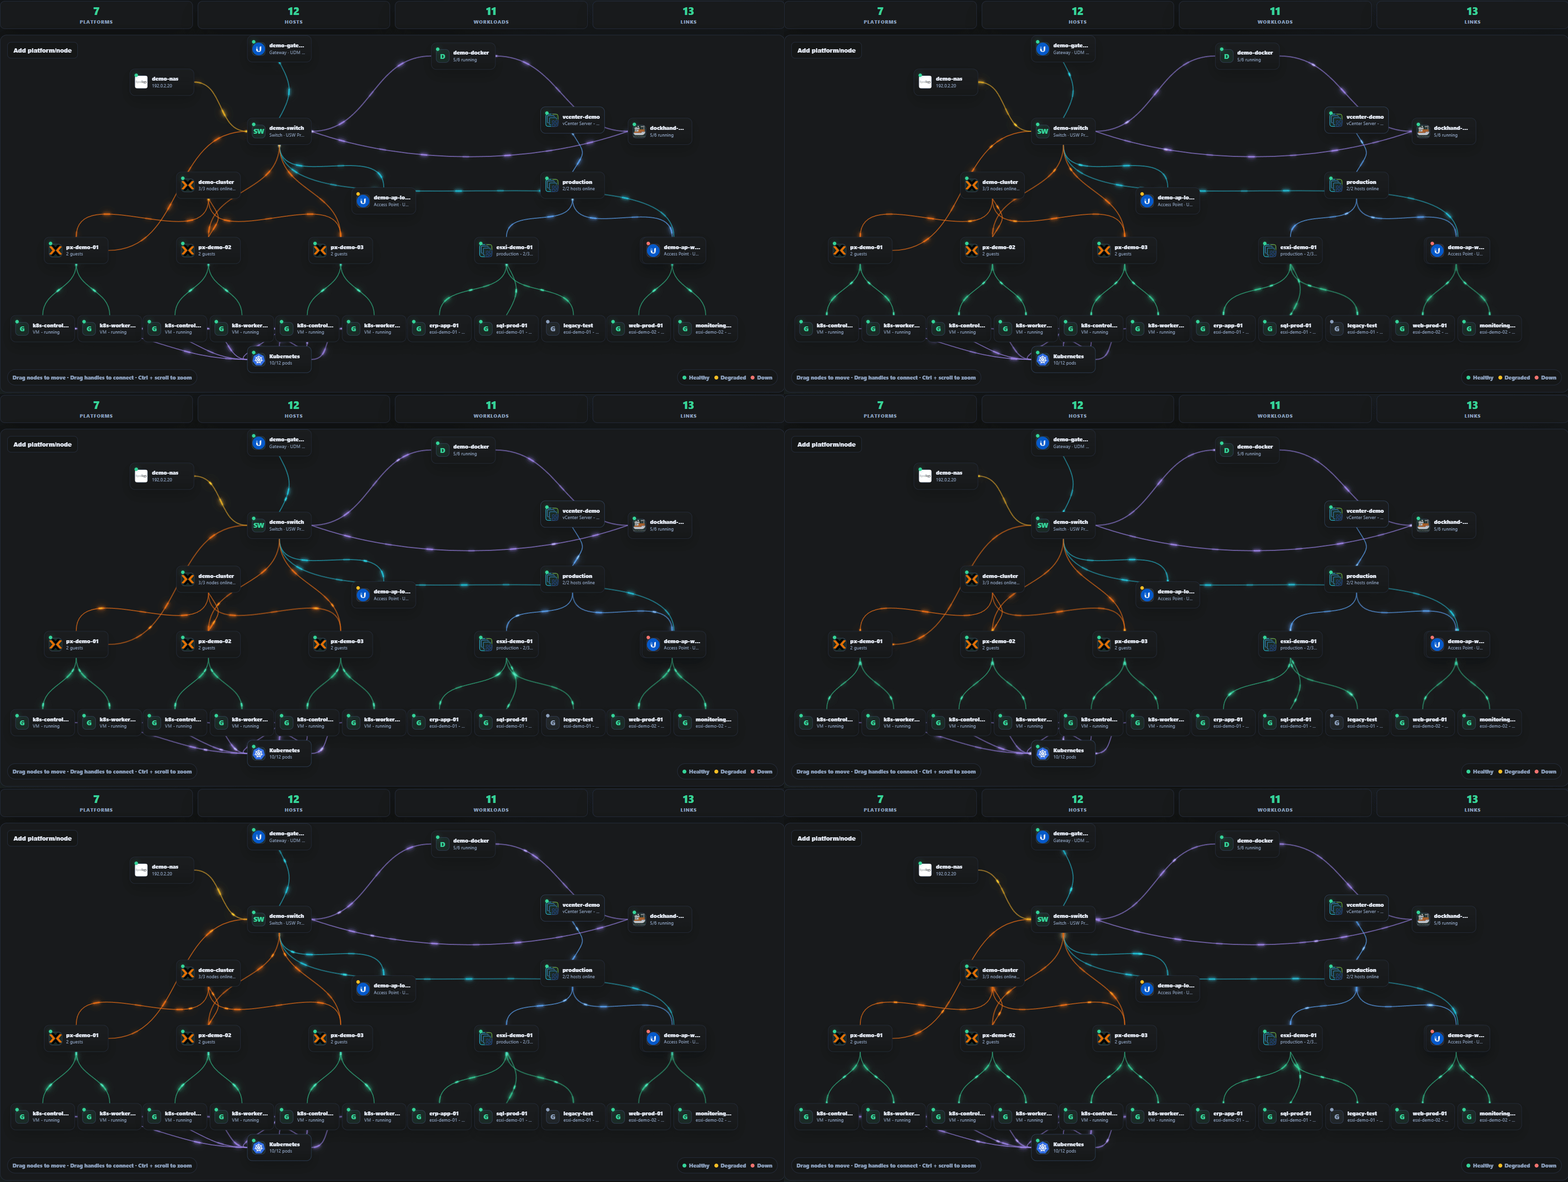
- Topology Relationship Map
- A relationship map connects platforms, hosts, and workloads so you can see what depends on what before you restart anything.
- SNMP Device Coverage
- Any SNMP v2c or v3 device such as Synology, MikroTik, UniFi, switches, and routers reports CPU, memory, temperature, fan, and bandwidth history.
- Alerts And Event Center
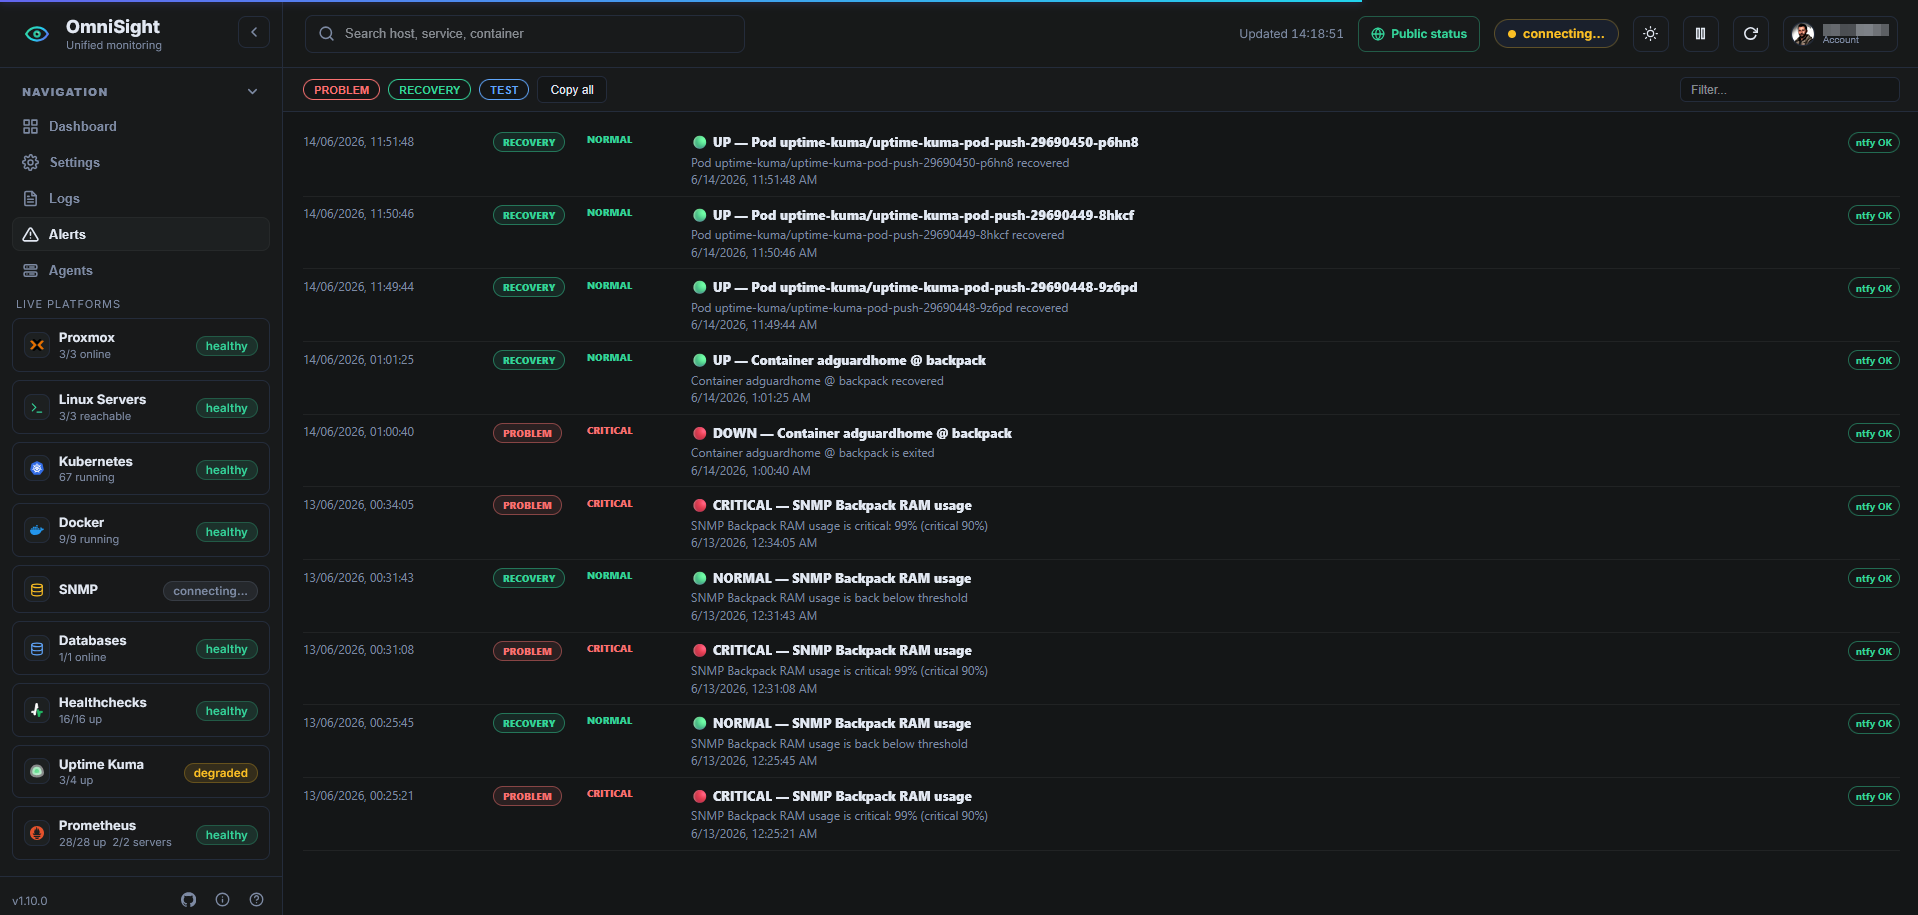
- A live runtime log, warning, and error stream with audit and alert history, exportable as JSON, CSV, or syslog from the event center.
- Backup Export And Restore
- Export configuration backups or a password-gated full backup with users, keys, and history, and restore them when you move or rebuild the instance.