Categories
DevOps Monitoring Infrastructure Observability Server Management Alerting Network MonitoringStars
Forks
Watchers
Developer links
Zabbix
Monitoring everything from network switches to Kubernetes clusters since 2001 with over 6,200 GitHub stars and deployments exceeding 100,000 devices per installation, Zabbix has established itself as one of the most mature and feature-rich open-source monitoring platforms available, trusted by organizations including Dell, Salesforce, ICANN, and T-Mobile. The platform collects metrics from virtually any source using Zabbix Agent written in C, Zabbix Agent 2 written in Go with native plugin support, SNMP v1/v2c/v3 polling and trapping, IPMI for hardware health, JMX for Java applications, SSH and Telnet checks, HTTP/HTTPS polling, and ODBC database queries. Version 7.0 LTS introduced synthetic browser monitoring that executes user-defined JavaScript via WebDriver to simulate multi-step user interactions on websites, proxy load balancing with automatic host redistribution across proxy groups for high availability, in-memory proxy data buffering delivering up to 100x performance improvement, native multi-factor authentication with TOTP and Duo support, and just-in-time user provisioning from SAML and LDAP. Low-level discovery automatically detects file systems, network interfaces, SNMP OIDs, VMware resources, and Kubernetes pods, creating monitoring items and triggers dynamically. The alerting engine correlates events with configurable escalation chains, sending notifications through Slack, Microsoft Teams, PagerDuty, Jira, email, and SMS with customizable message templates. Over 1,000 official templates provide instant monitoring for Linux, Windows, VMware, AWS, Azure, Docker, PostgreSQL, MySQL, Apache, Nginx, and hundreds more. Running on a dedicated VPS on RepoCloud with guaranteed CPU, RAM, and SSD, full root SSH access, and a browser serial console. AGPL-3.0 licensed.
Benefits
- Unified Infrastructure Monitoring
- Monitor servers, networks, cloud services, databases, and applications from a single platform with agent-based, agentless, and proxy-based data collection across SNMP, JMX, IPMI, and HTTP.
- Automatic Resource Discovery
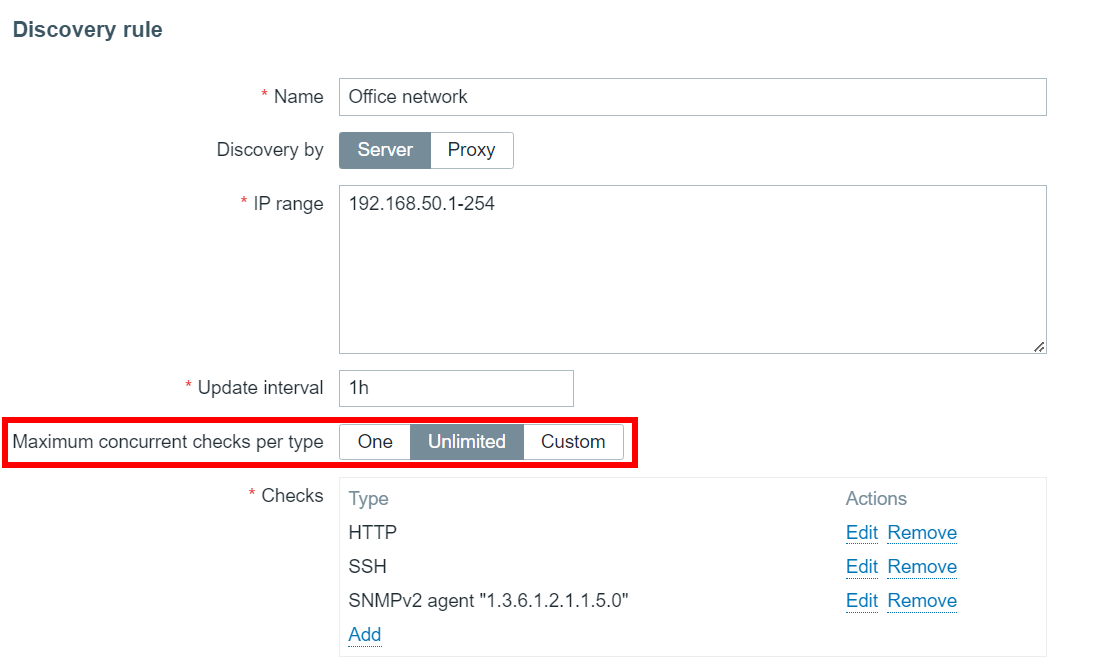
- Low-level discovery automatically detects file systems, network interfaces, VMware guests, Kubernetes pods, and SNMP devices, creating items, triggers, and graphs dynamically.
- Proxy Load Balancing
- Distribute monitoring workloads across proxy groups with automatic host redistribution and failover, scaling from single-site deployments to globally distributed environments.
- 1000+ Ready Templates
- Deploy instantly with official templates for Linux, Windows, VMware, AWS, Azure, Docker, PostgreSQL, MySQL, Nginx, Apache, and hundreds of network devices and cloud services.
Features
- Multi-Protocol Collection
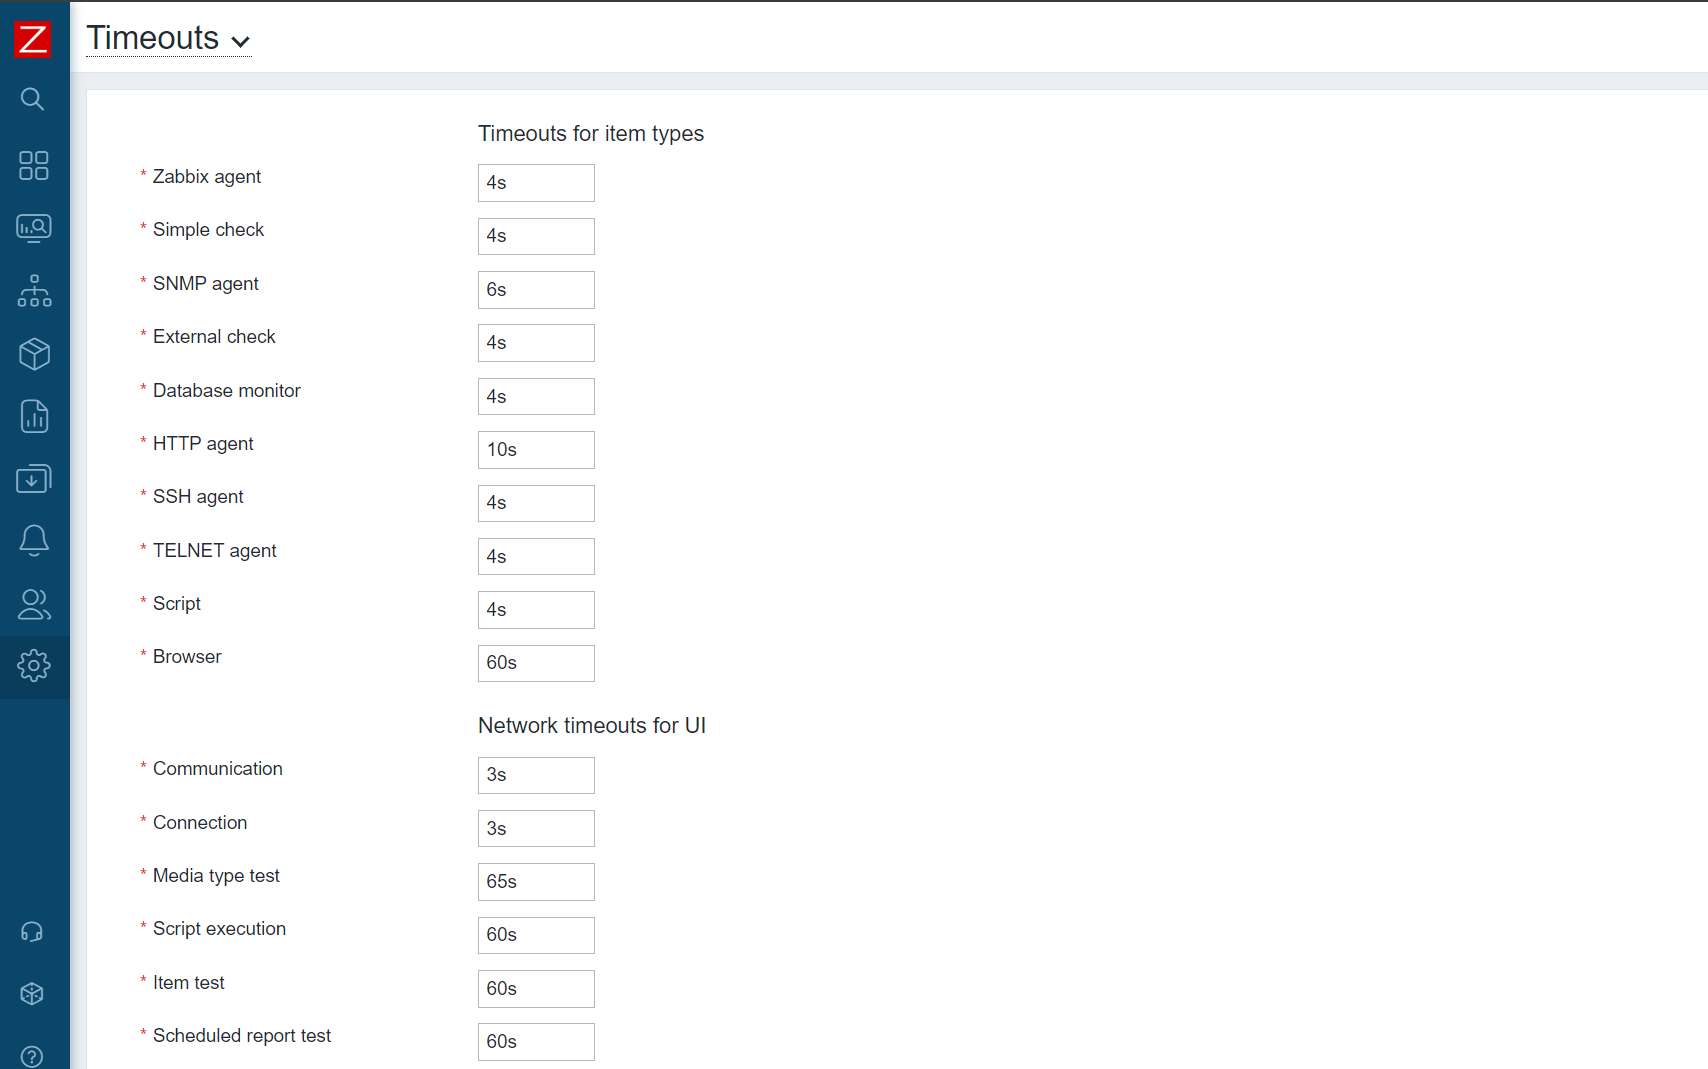
- Collect metrics via Zabbix Agent, SNMP v1/v2c/v3, IPMI, JMX, SSH, Telnet, HTTP/HTTPS, ODBC, and custom scripts with configurable polling intervals.
- Browser Monitoring
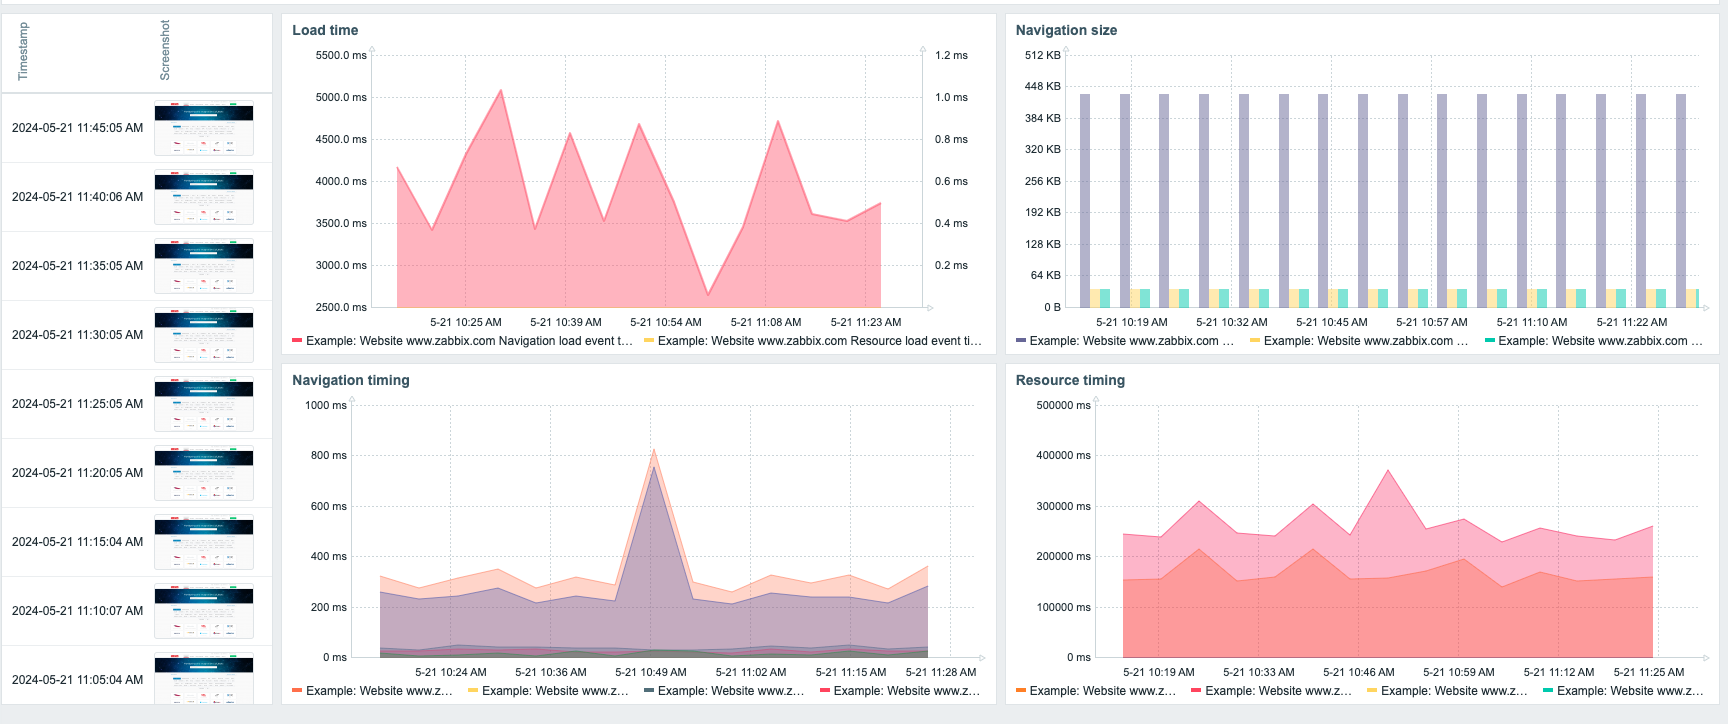
- Execute JavaScript-driven multi-step browser scenarios via WebDriver to monitor website availability, performance, and user workflows with screenshot capture.
- Event Correlation
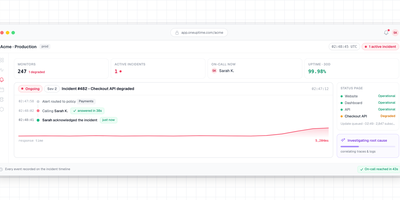
- Correlate incoming and existing problems with root cause analysis, trigger dependencies, and configurable escalation chains sending alerts via Slack, Teams, and PagerDuty.
- Dashboard Visualization
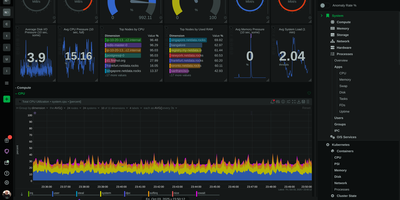
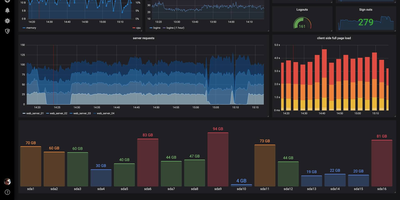
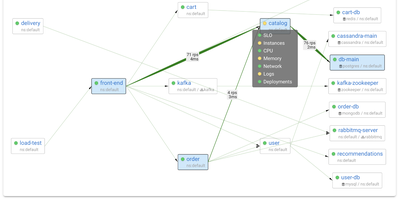
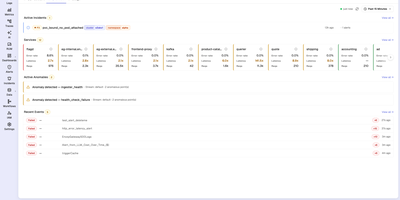
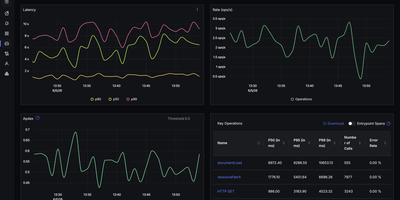
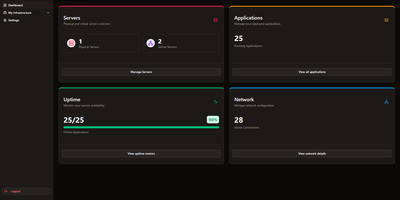
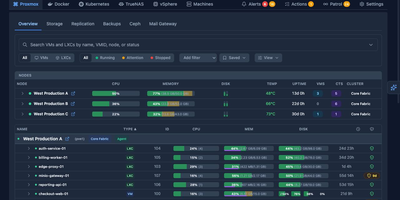
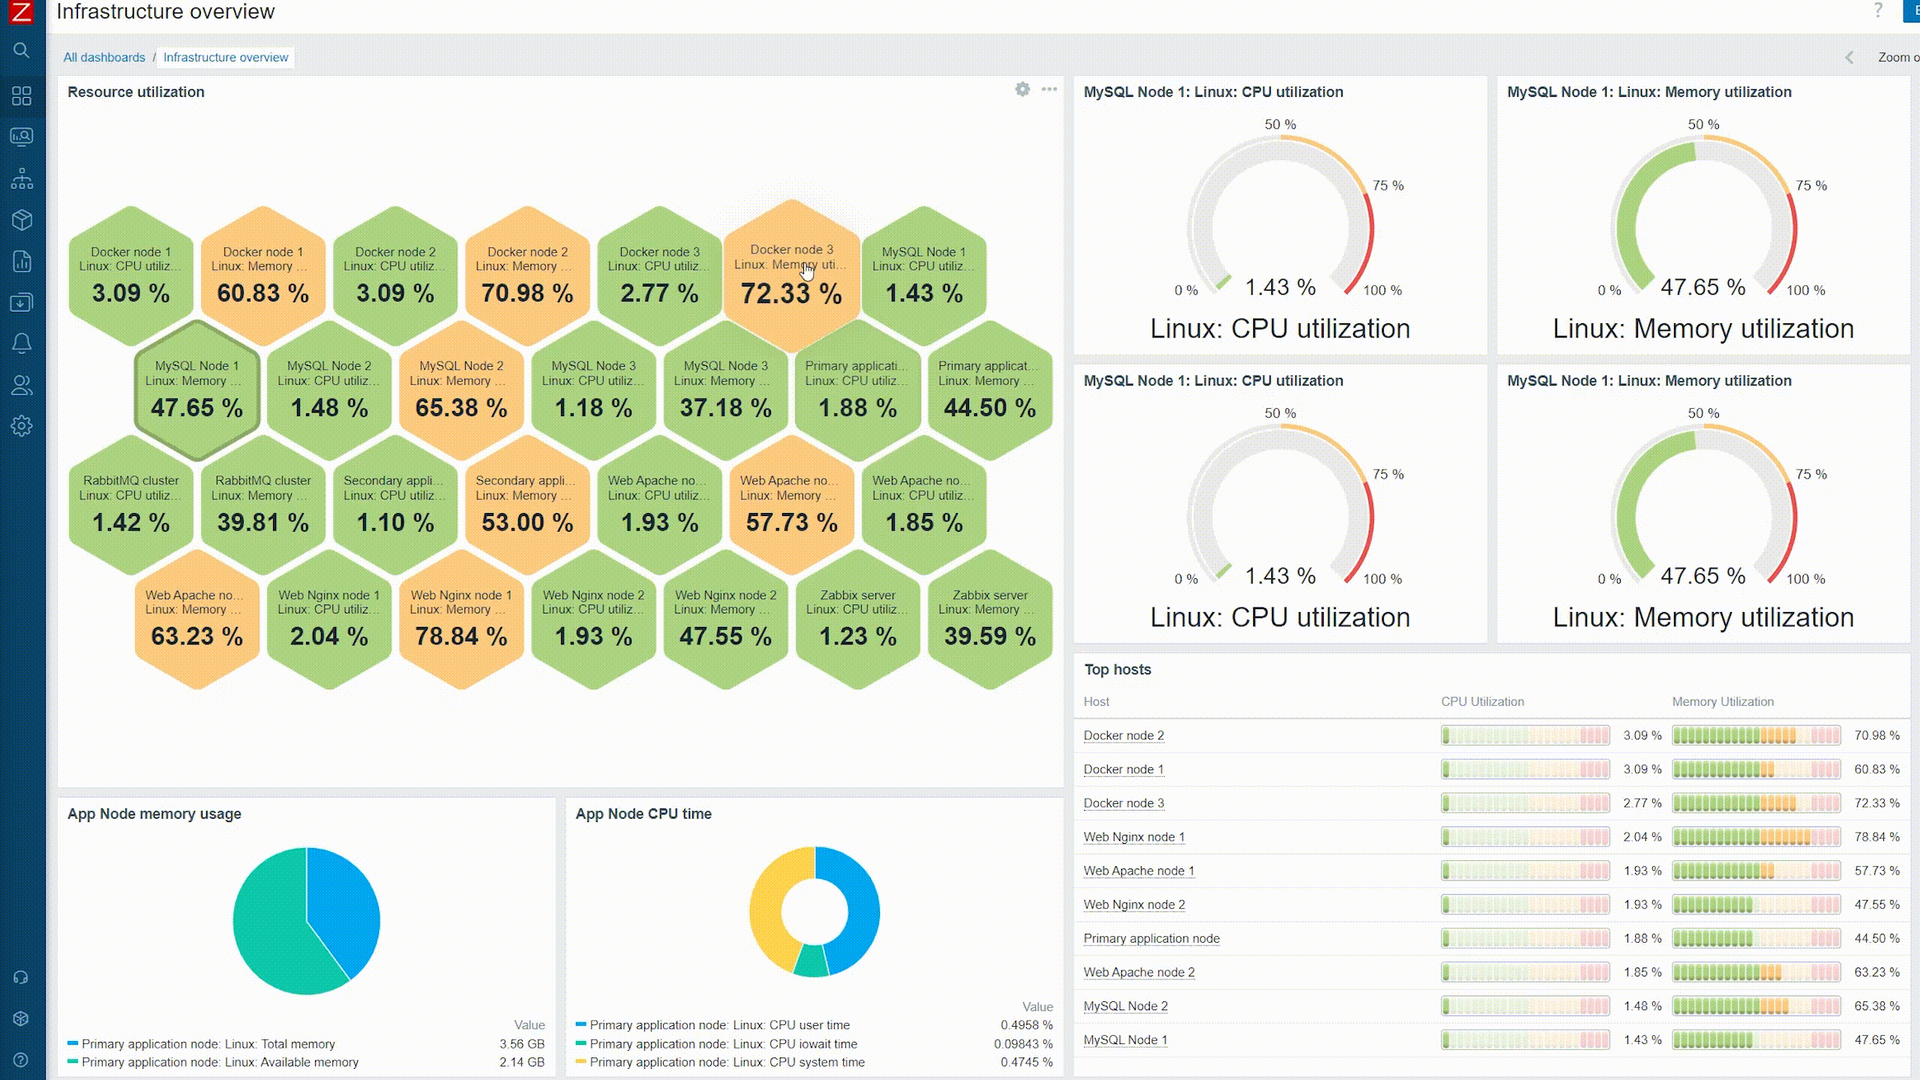
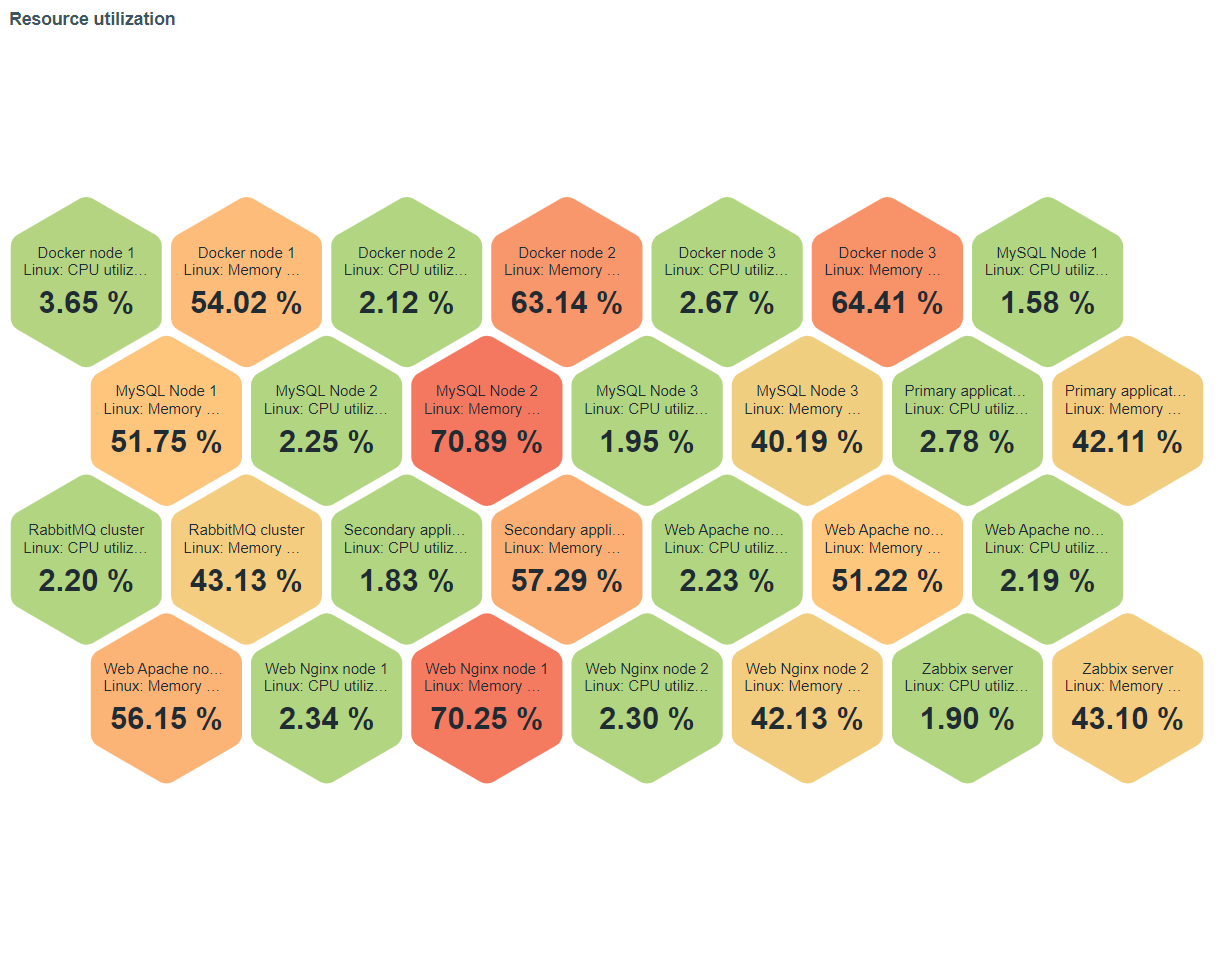
- Build custom dashboards with graphs, maps, geomaps, pie charts, and SLA reports using drag-and-drop widgets with role-based access and multi-tenant views.
- Distributed Architecture
- Scale with proxies supporting memory, disk, and hybrid buffer modes for edge computing and remote site monitoring with automatic failover across proxy groups.