Stars
Forks
Watchers
Developer links
Moneat
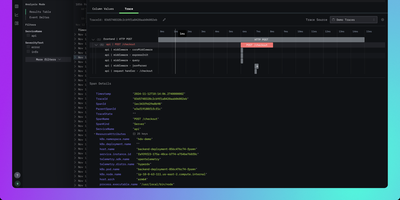
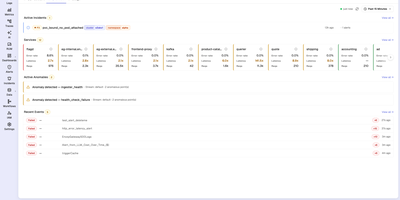
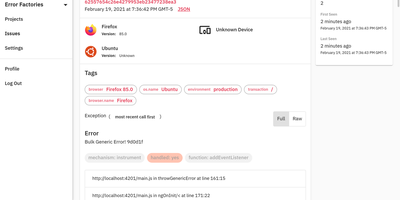
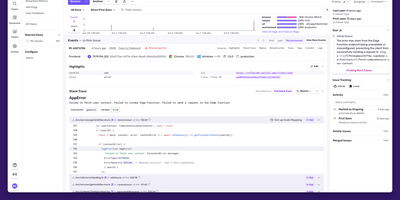
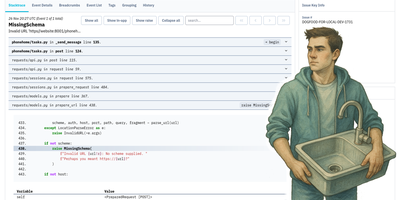
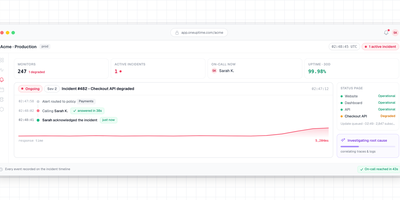
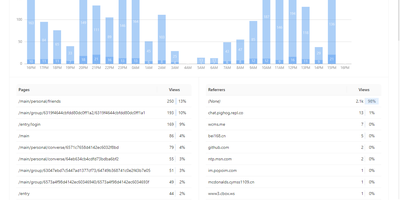
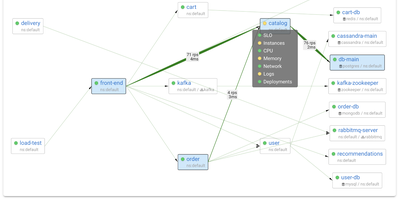
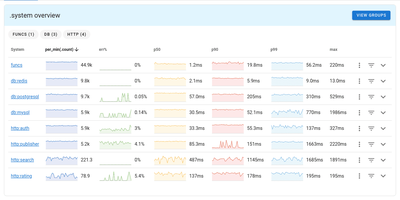
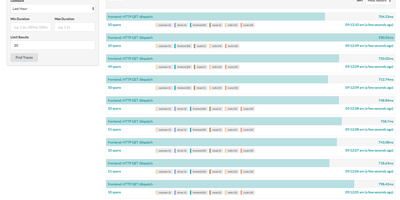
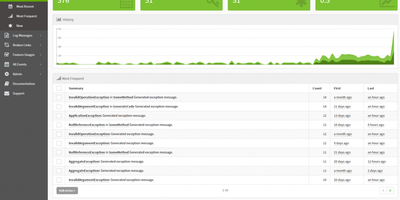
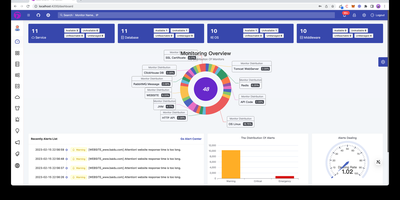
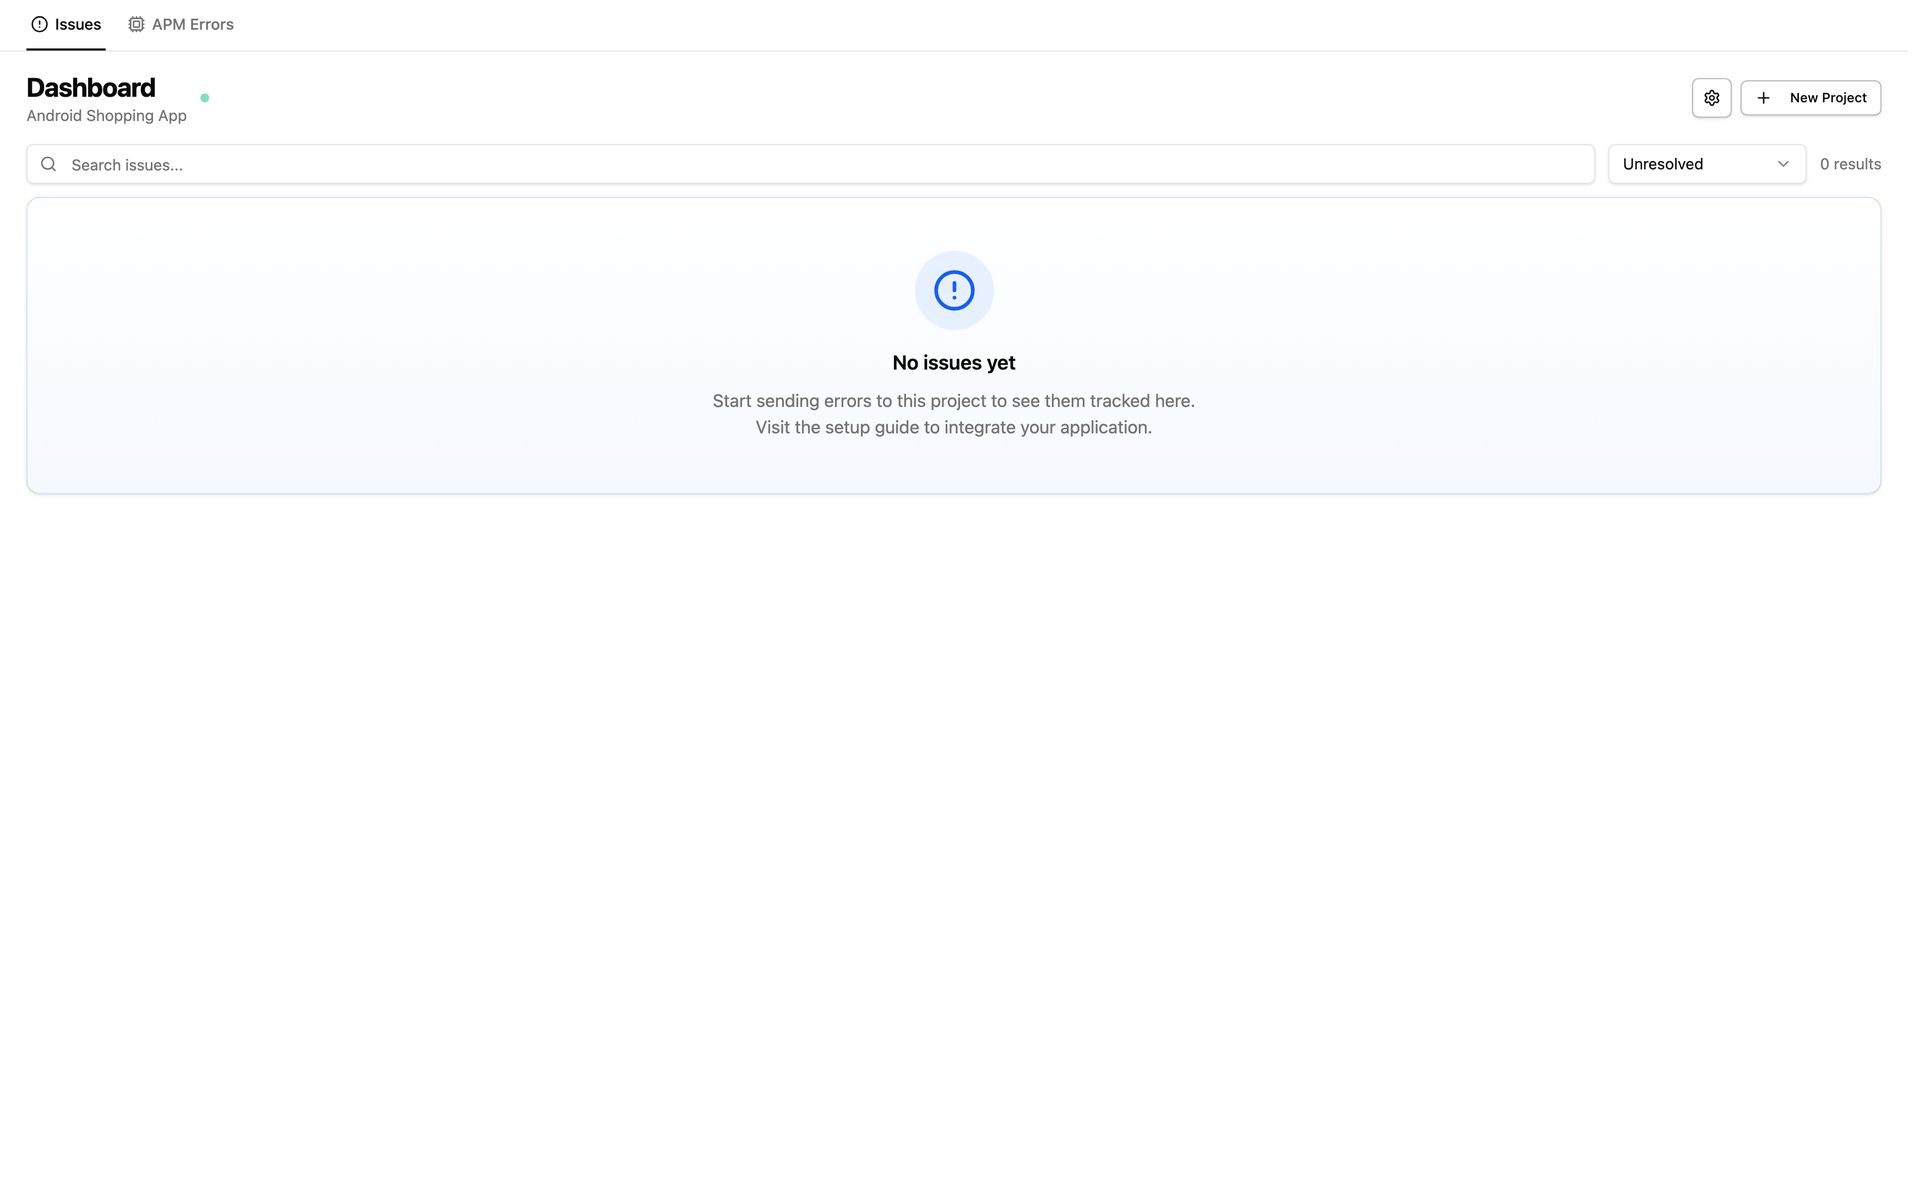
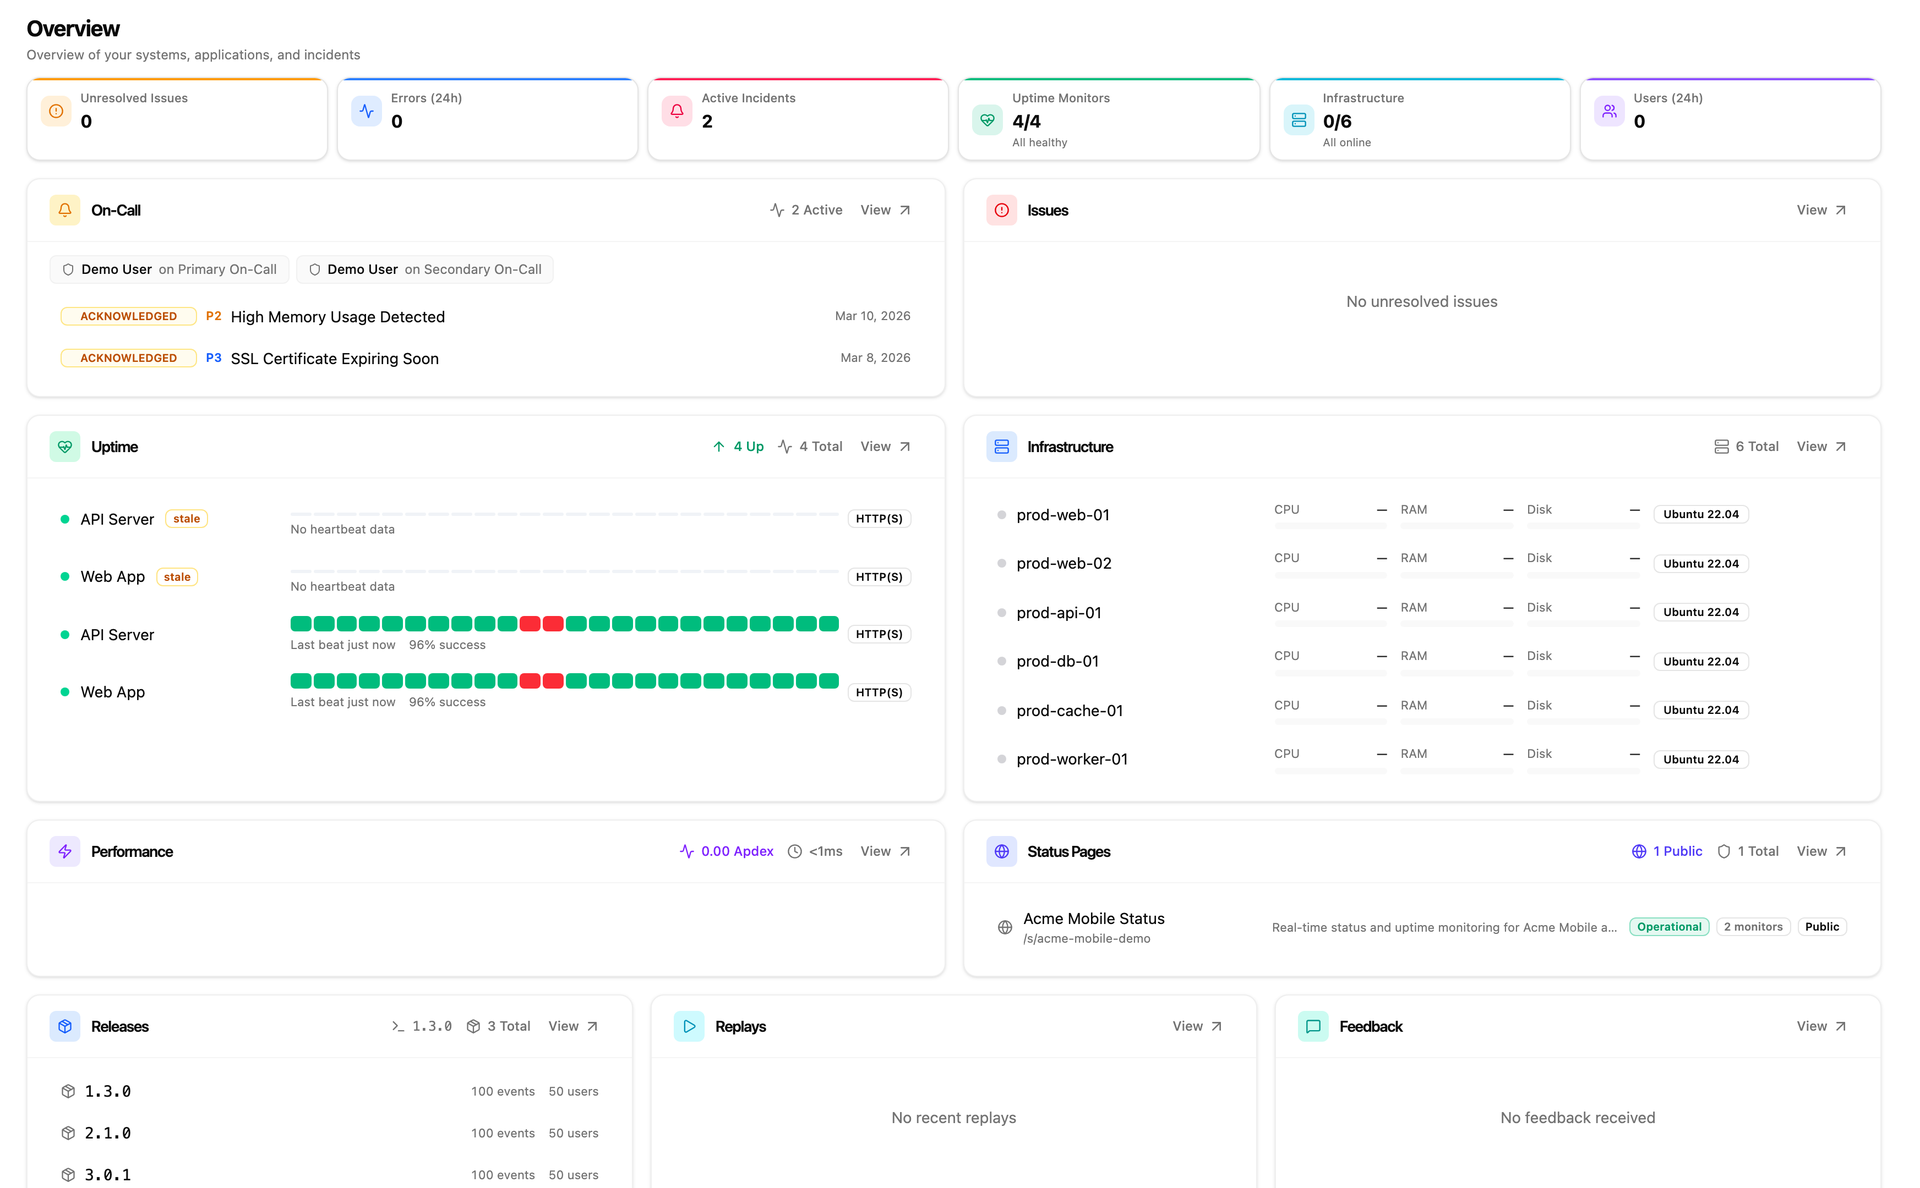
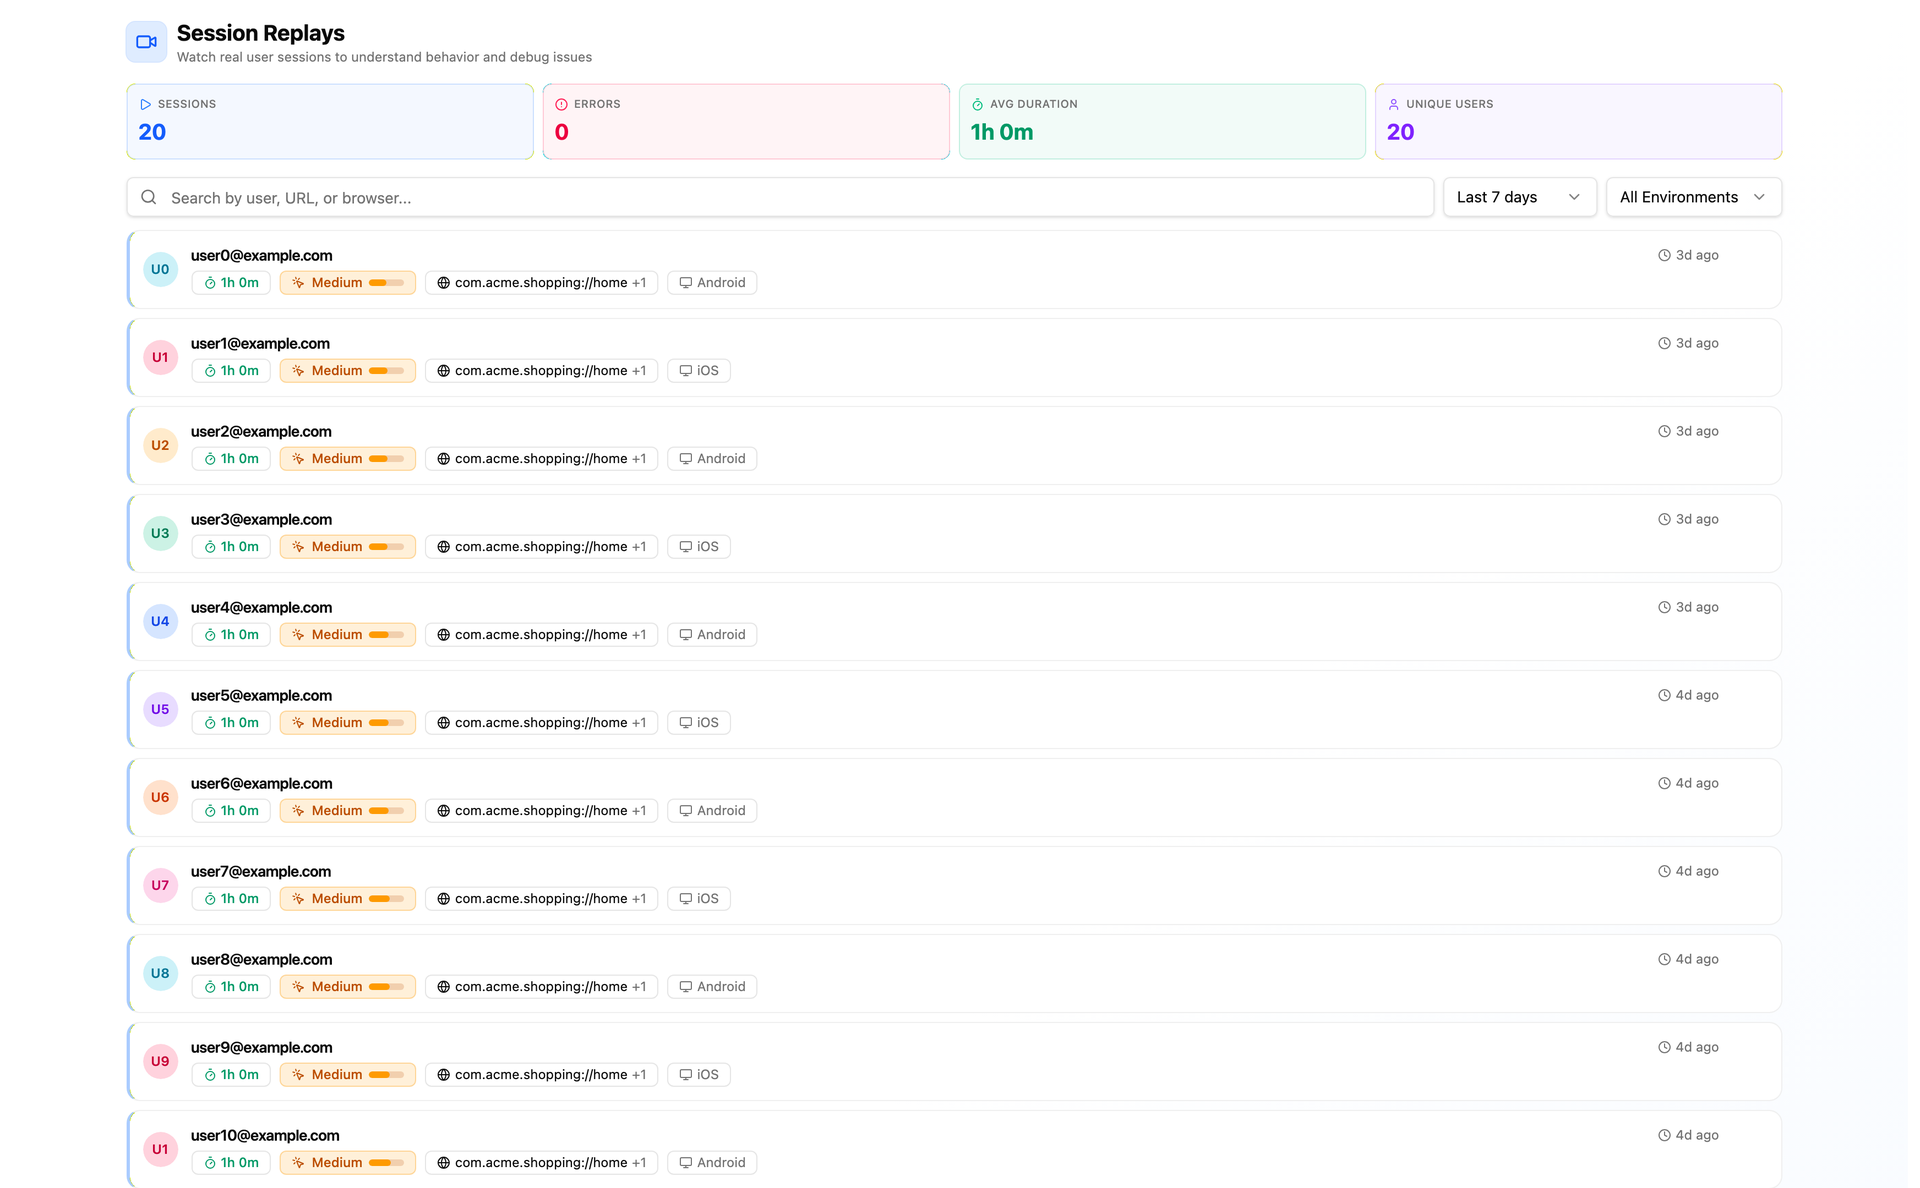
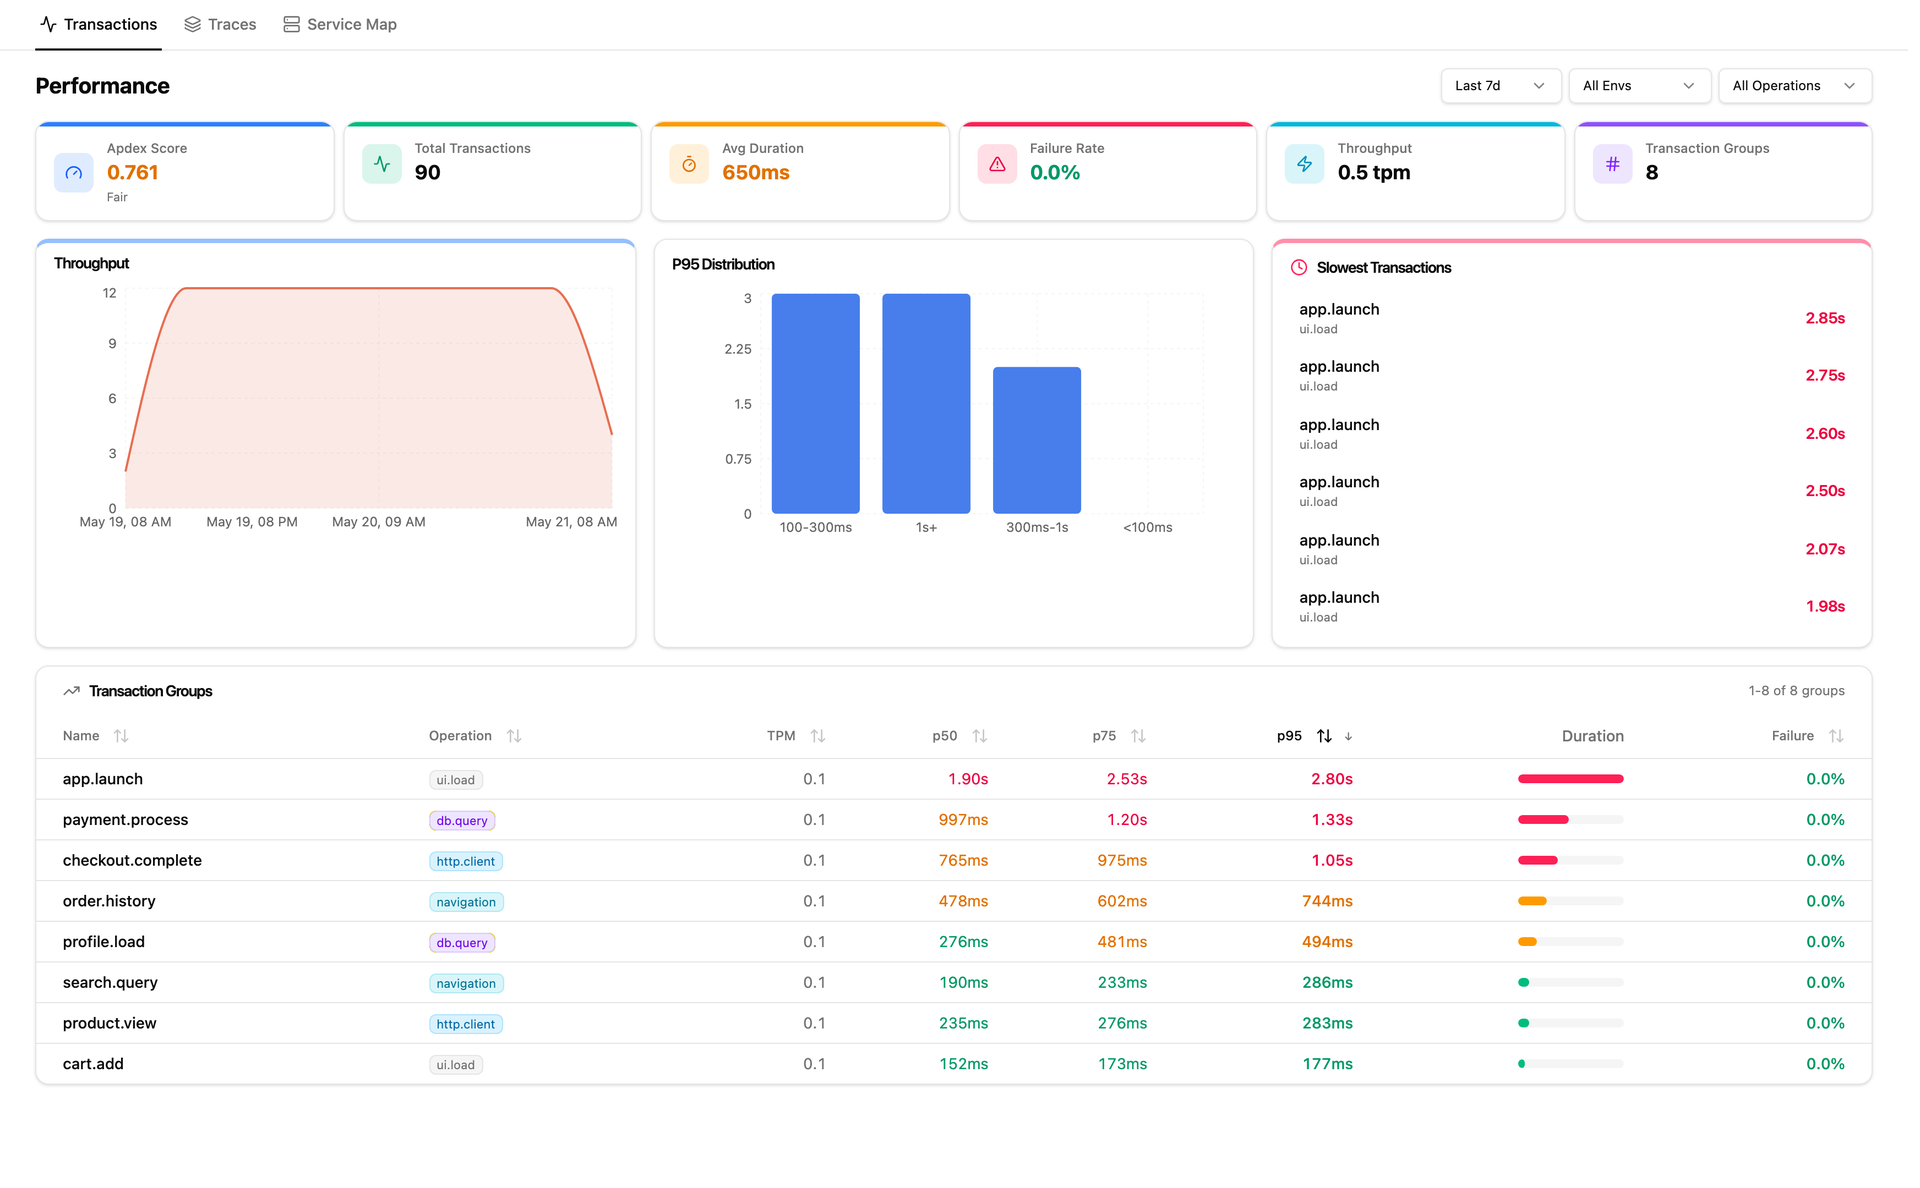
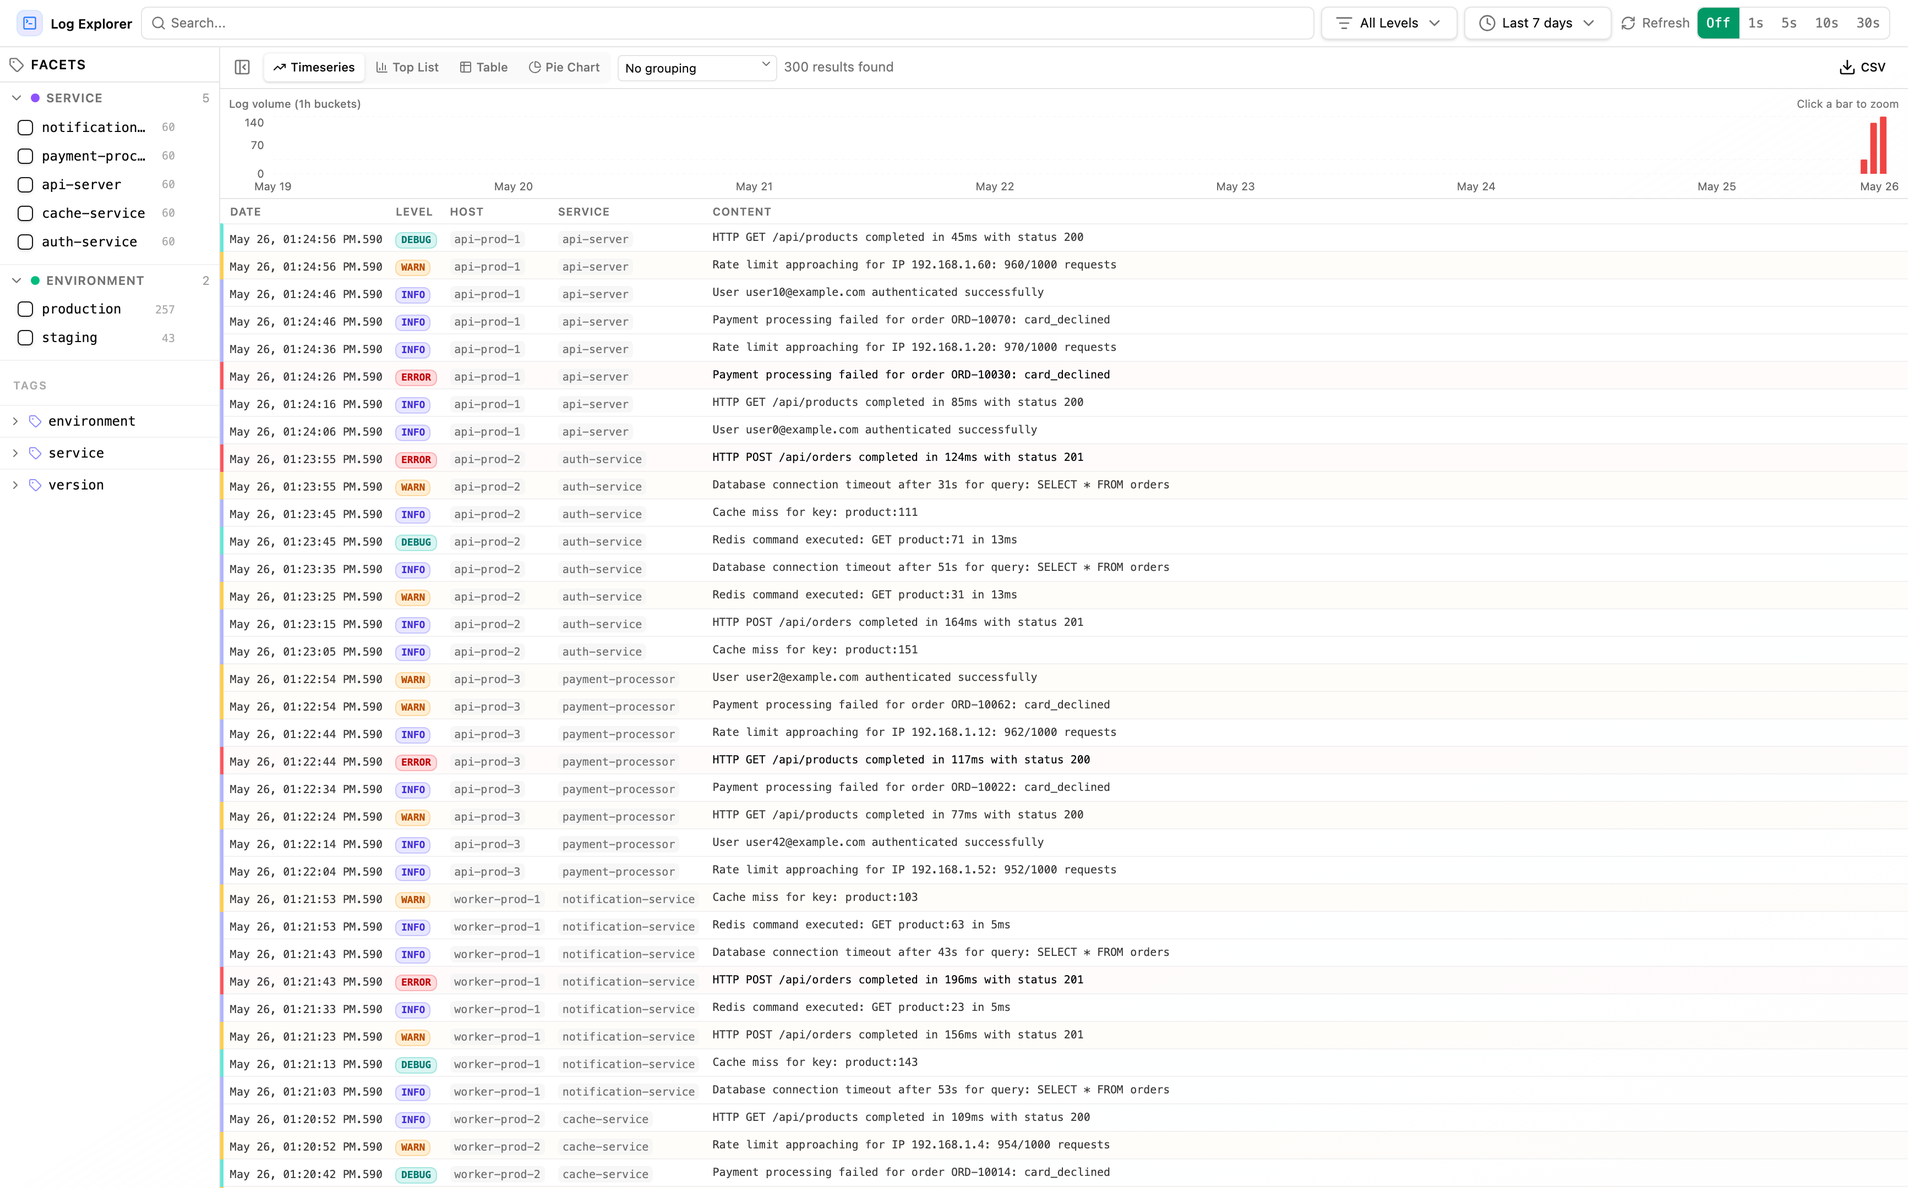
Moneat is the open-source observability platform that unifies error tracking, session replay, performance monitoring, logging, uptime checks, synthetics, product analytics, and AI observability into a single self-hosted application — replacing Sentry, Datadog, and Statuspage with one deployment. The Sentry SDK compatibility layer accepts data from @sentry/browser, @sentry/node, @sentry/react, @sentry/nextjs, sentry-sdk for Python, sentry-kotlin, sentry-java, sentry-android, sentry-cocoa, sentry-go, sentry-ruby, and Sentry.NET by updating one DSN endpoint. Datadog Agent compatibility redirects existing fleets by setting dd_url, and native OpenTelemetry OTLP ingestion accepts logs, traces, and metrics from any exporter or Collector. Error monitoring groups exceptions with smart deduplication, session replay records DOM-based user interactions linked to errors, distributed tracing visualizes transaction and span breakdowns with live service maps, and continuous profiling renders flamegraphs in pprof, JFR, and Sentry formats. Uptime monitoring runs HTTP, TCP, and ping checks with public status pages, while synthetics executes API tests, multi-step workflows, SSL checks, and DNS probes. Custom dashboards support drag-and-drop widgets with Grafana import, product analytics provides funnels and retention cohorts, release tracking surfaces crash-free rates with source map upload, and AI observability traces LLM calls end to end. Built on Kotlin and Java with ClickHouse for analytical storage, PostgreSQL for relational data, and Redis for caching, deployment uses Docker Compose with an interactive installer automating secrets and service orchestration. Running on a dedicated VPS on RepoCloud with guaranteed CPU, RAM, and SSD, full root SSH access, and a browser serial console. AGPL-3.0 licensed.
Benefits
- Drop-In Sentry and Datadog Replacement
- Accepts data from every Sentry SDK and Datadog Agent with no re-instrumentation required — change one endpoint URL and all existing monitoring continues working on your own infrastructure.
- Unified Observability in One Platform
- Errors, session replays, distributed tracing, profiling, logs, uptime, synthetics, dashboards, product analytics, and AI observability consolidated into a single self-hosted application.
- Native OpenTelemetry OTLP Ingestion
- Accepts logs, traces, and metrics from any OpenTelemetry exporter or Collector via standard OTLP/HTTP endpoints, avoiding vendor lock-in with open standards-based telemetry pipelines.
- Self-Hosted with Interactive Installer
- The interactive shell installer automates Docker Compose configuration, secret generation, port allocation, and service orchestration for production deployment on a single server.
Features
- Session Replay
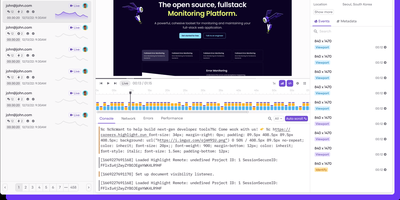
- DOM-based recordings capture user interactions linked to error events, enabling visual debugging of exactly what users experienced before crashes occurred.
- Continuous Profiling
- Flamegraph visualization supports pprof, JFR, and Sentry profiling formats with transaction-linked profiles for identifying performance bottlenecks in production.
- Synthetics Engine
- API tests, multi-step workflows, SSL certificate checks, DNS resolution tests, and TCP/UDP probes monitor service health with configurable scheduling and alerting.
- Custom Dashboards
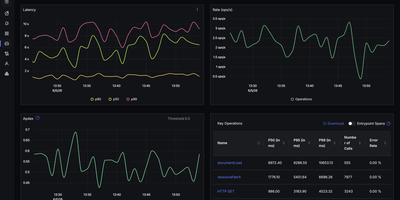
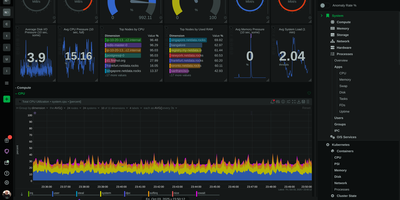
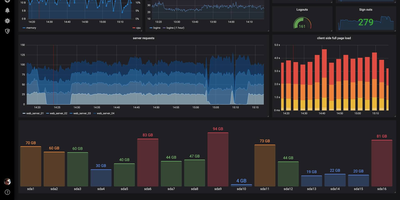
- Drag-and-drop widget builder with Grafana dashboard import creates operational dashboards combining metrics, logs, traces, and business analytics in one view.
- AI Observability
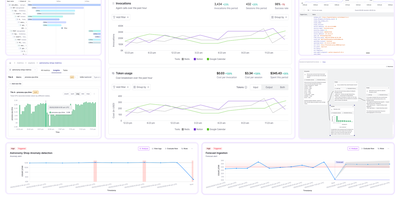
- Traces LLM calls and agent executions end to end with token usage tracking, cost analysis, and error attribution for AI-powered application monitoring.