Stars
Forks
Watchers
Developer links
VictoriaMetrics
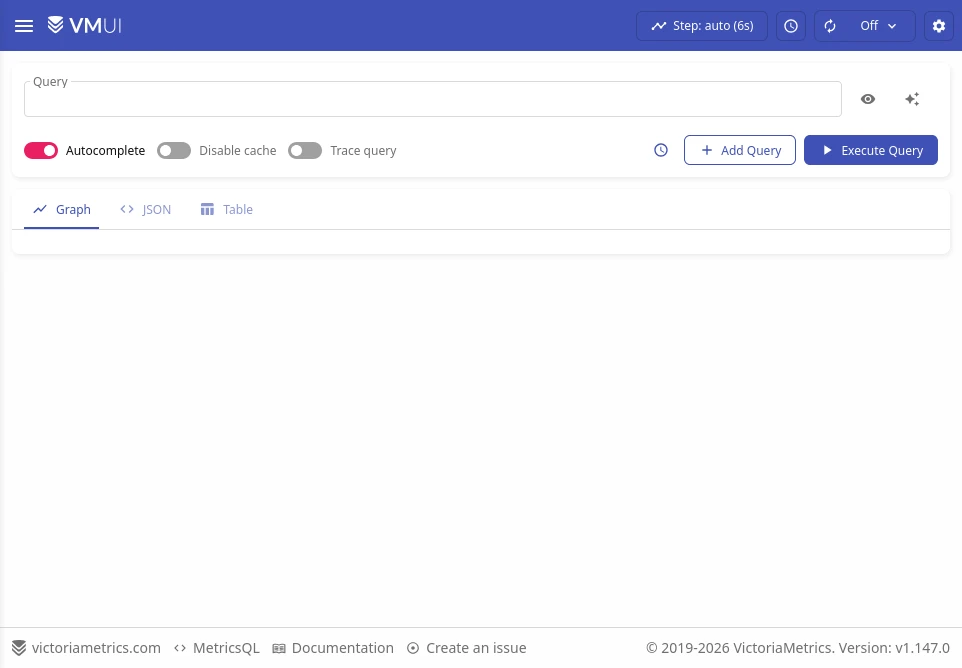
Trusted by thousands of organizations processing billions of time series data points and backed by 17,000+ GitHub stars, VictoriaMetrics delivers a monitoring and time series database that outperforms Prometheus by 16x on query speed while consuming 2.5x less disk space through its optimized compression and storage engine. The architecture supports both single-node deployments handling 10M+ active time series and a horizontally scalable cluster version with vminsert, vmstorage, and vmselect components providing multi-tenancy, replication, and independent namespace isolation. Data ingestion accepts both push protocols including InfluxDB line protocol, Graphite plaintext, OpenTSDB HTTP, CSV, and OpenTelemetry OTLP alongside pull-based Prometheus scraping and remote write, enabling drop-in replacement of existing monitoring stacks without reconfiguring exporters. MetricsQL extends standard PromQL with additional functions, subqueries, and implicit time range alignment while maintaining full backward compatibility with existing Prometheus alerts and Grafana dashboards. The vmalert component processes recording and alerting rules with Alertmanager integration, while vmbackup and vmrestore enable point-in-time snapshots to S3, GCS, and Azure Blob Storage. Stream aggregation operates as a StatsD alternative for pre-aggregating high-cardinality metrics before storage. NFS-compatible storage backends including Amazon EFS and Google Filestore allow shared persistent volumes across cluster nodes. Running on a dedicated VPS on RepoCloud with guaranteed CPU, RAM, and SSD, full root SSH access, and a browser serial console. Apache-2.0 licensed.
Benefits
- 16x Faster Than Prometheus
- Optimized Go storage engine with custom compression delivers 16x query performance improvement over Prometheus while consuming 2.5x less disk space for identical datasets.
- Drop-In Prometheus Replacement
- Full PromQL compatibility, remote write/read support, and native Grafana integration enable migration from Prometheus without modifying dashboards, alerts, or exporters.
- Multi-Protocol Data Ingestion
- Accepts metrics via InfluxDB line protocol, Graphite plaintext, OpenTSDB HTTP, CSV, OpenTelemetry OTLP, and Prometheus scraping simultaneously from one endpoint.
- Horizontal Cluster Scaling
- Cluster version separates ingestion, storage, and query into independent vminsert, vmstorage, and vmselect nodes with multi-tenancy, replication, and NFS storage support.
Features
- MetricsQL Query Language
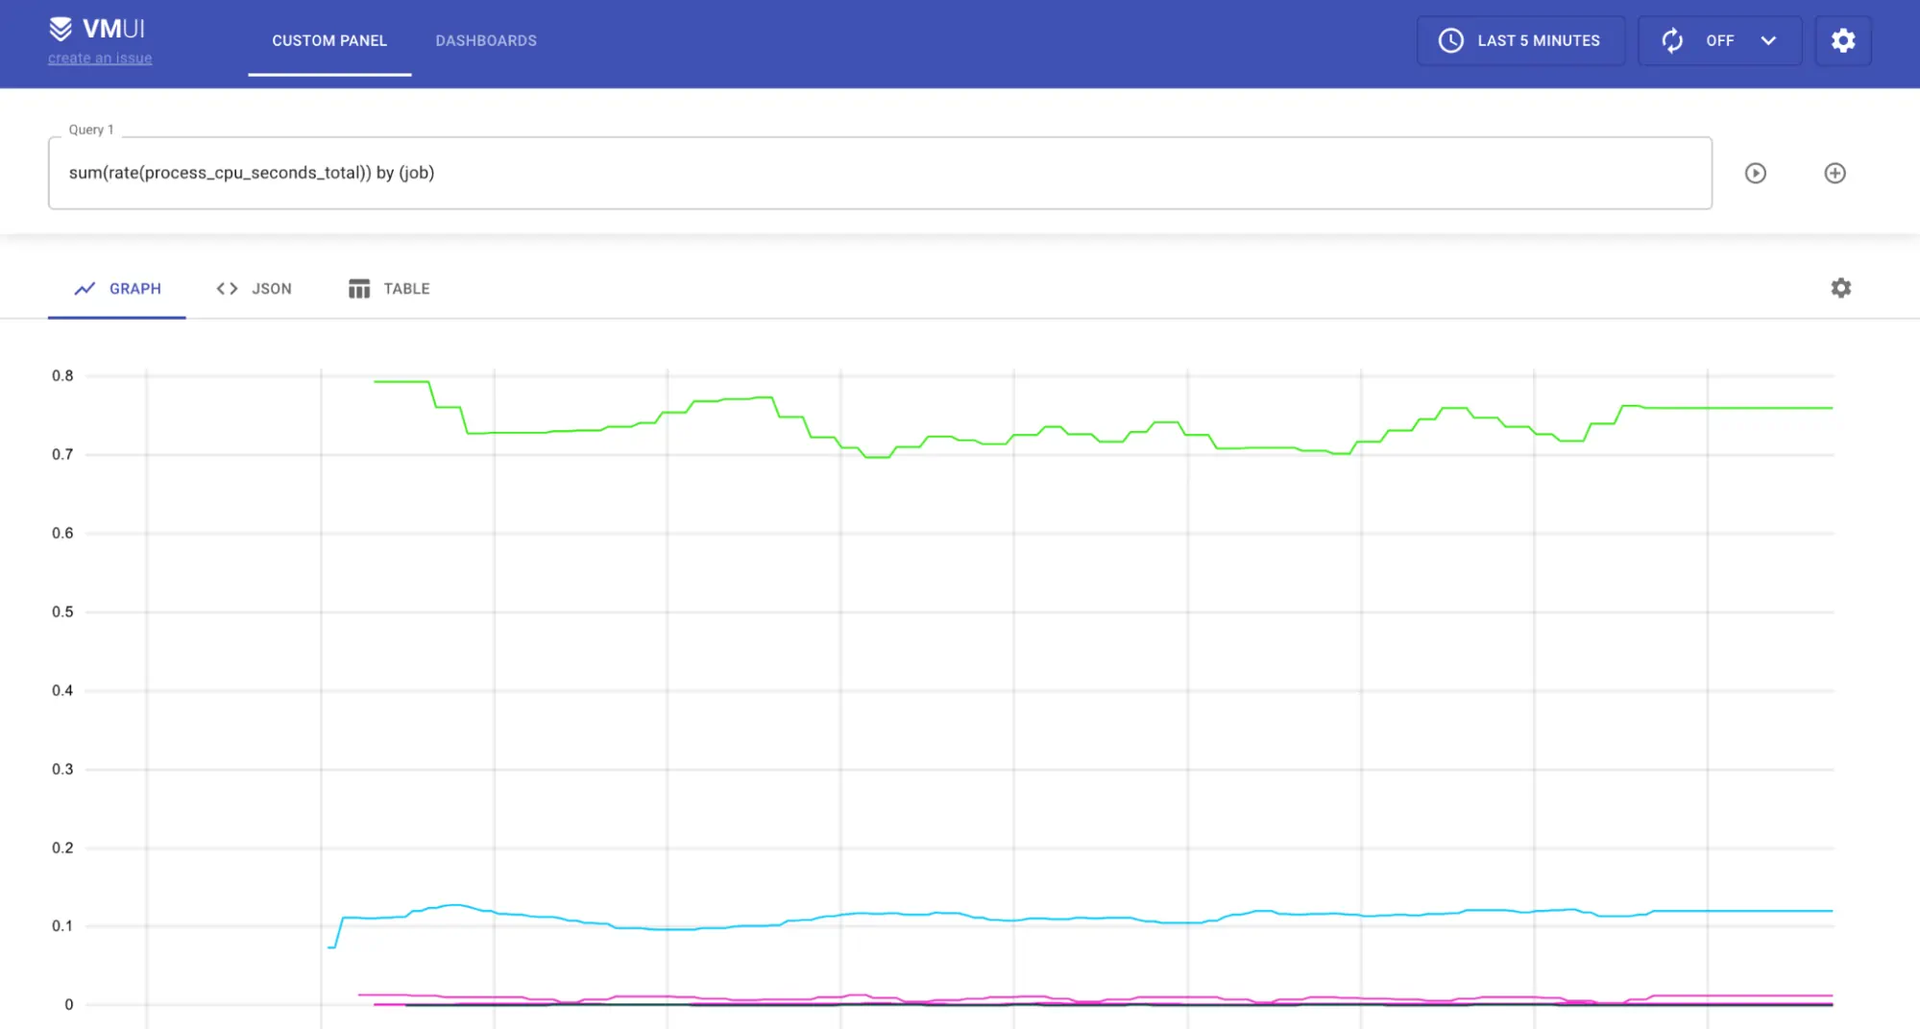
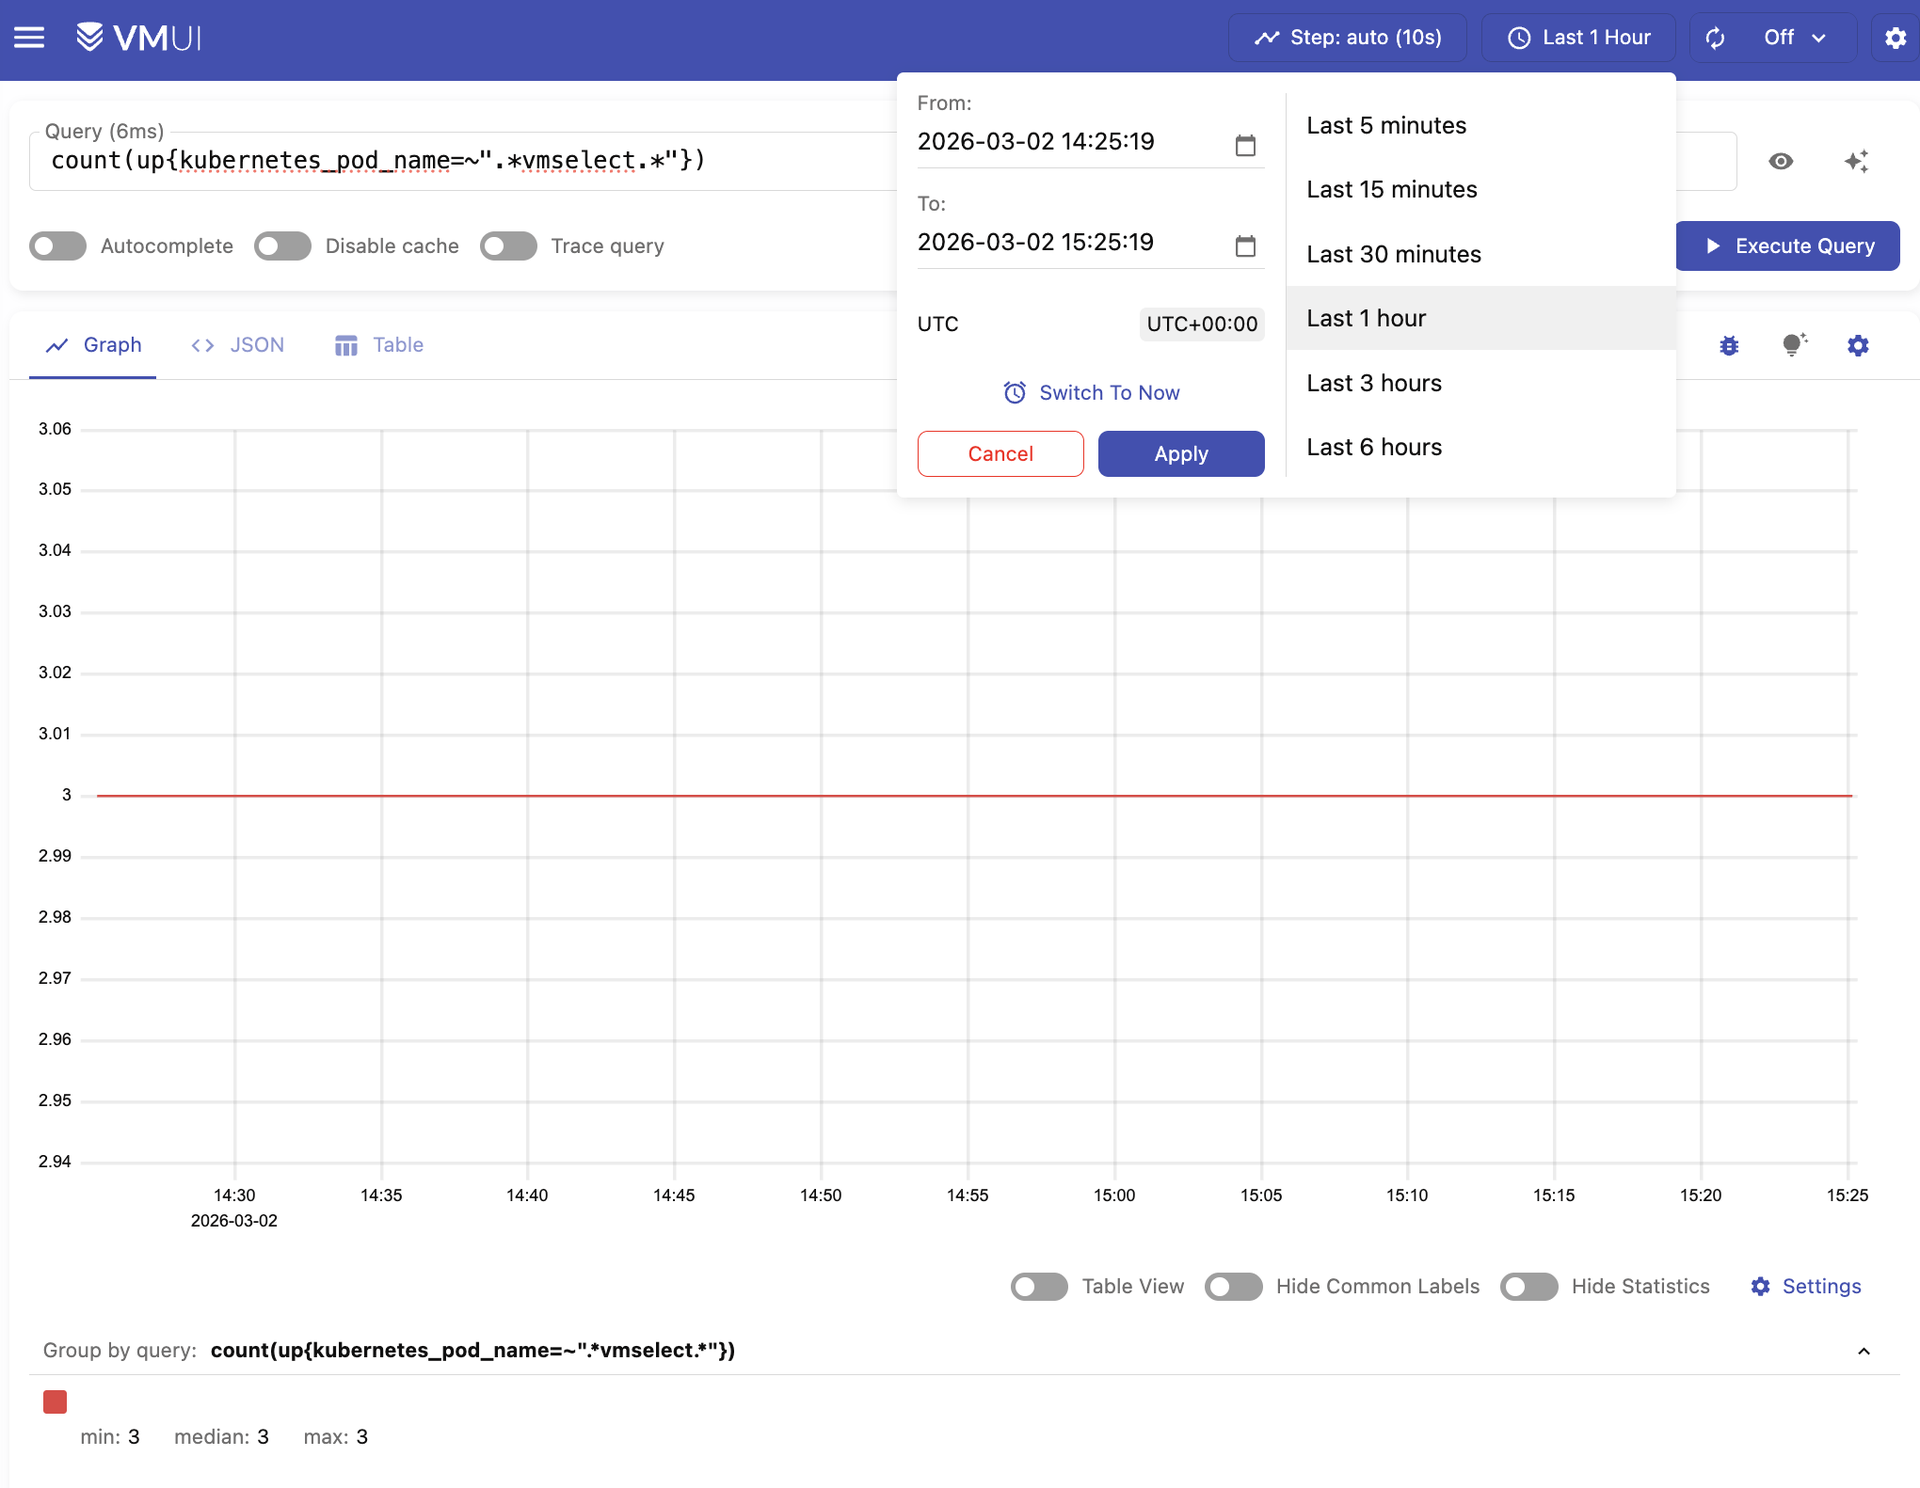
- Extends PromQL with additional functions, subqueries, implicit time range alignment, and query optimizations while maintaining full backward compatibility with existing Prometheus queries.
- Stream Aggregation Engine
- Pre-aggregates high-cardinality metrics before storage using StatsD-compatible protocol, reducing storage costs and query latency for large-scale deployments.
- vmalert Rule Processing
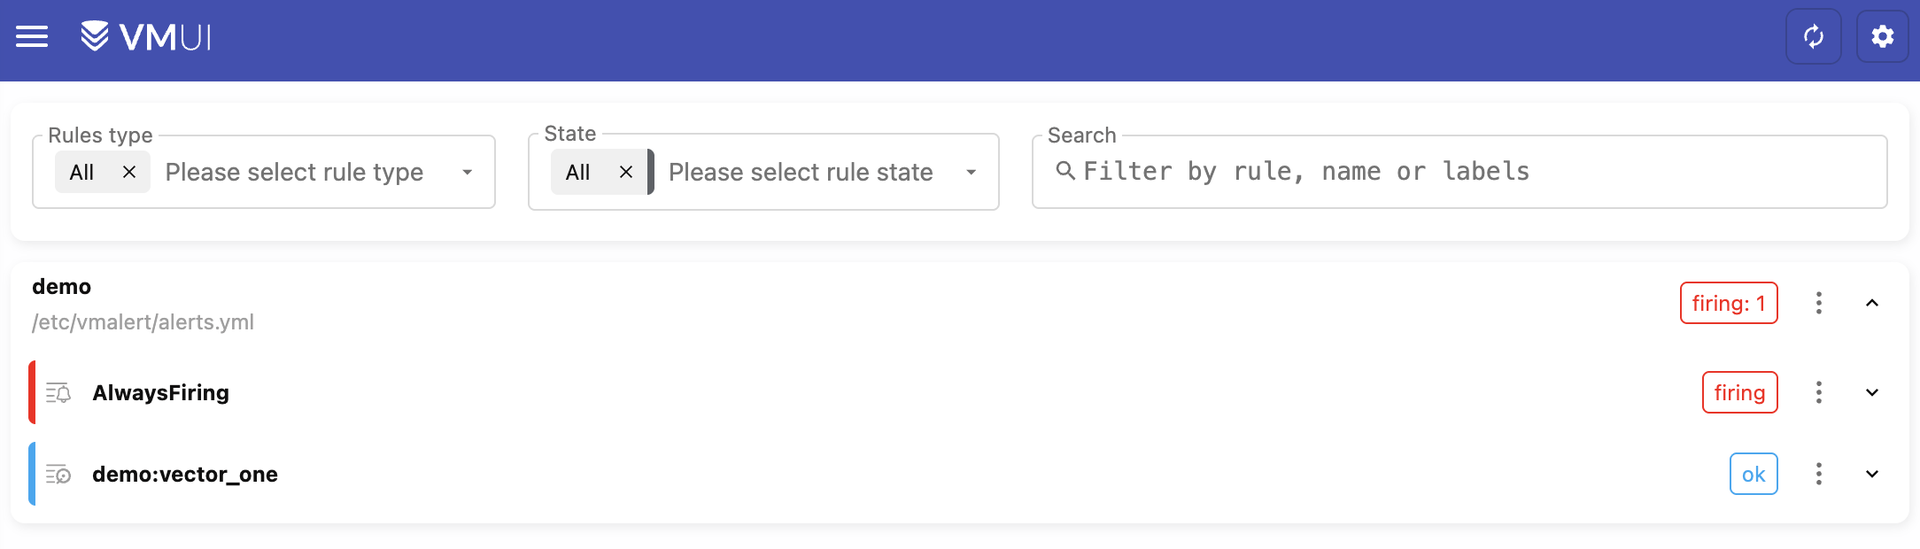
- Evaluates recording and alerting rules with native Alertmanager integration, multi-datasource support, and MetricsQL evaluation for complex threshold detection.
- Cloud-Native Backup
- vmbackup and vmrestore enable incremental point-in-time snapshots to Amazon S3, Google Cloud Storage, and Azure Blob Storage with deduplication.
- OpenTelemetry Integration
- Native OTLP ingestion endpoint accepts metrics from OpenTelemetry collectors and SDKs alongside Prometheus exporters on the same instance.