
Stars
Forks
Watchers
Developer links
Apache HertzBeat
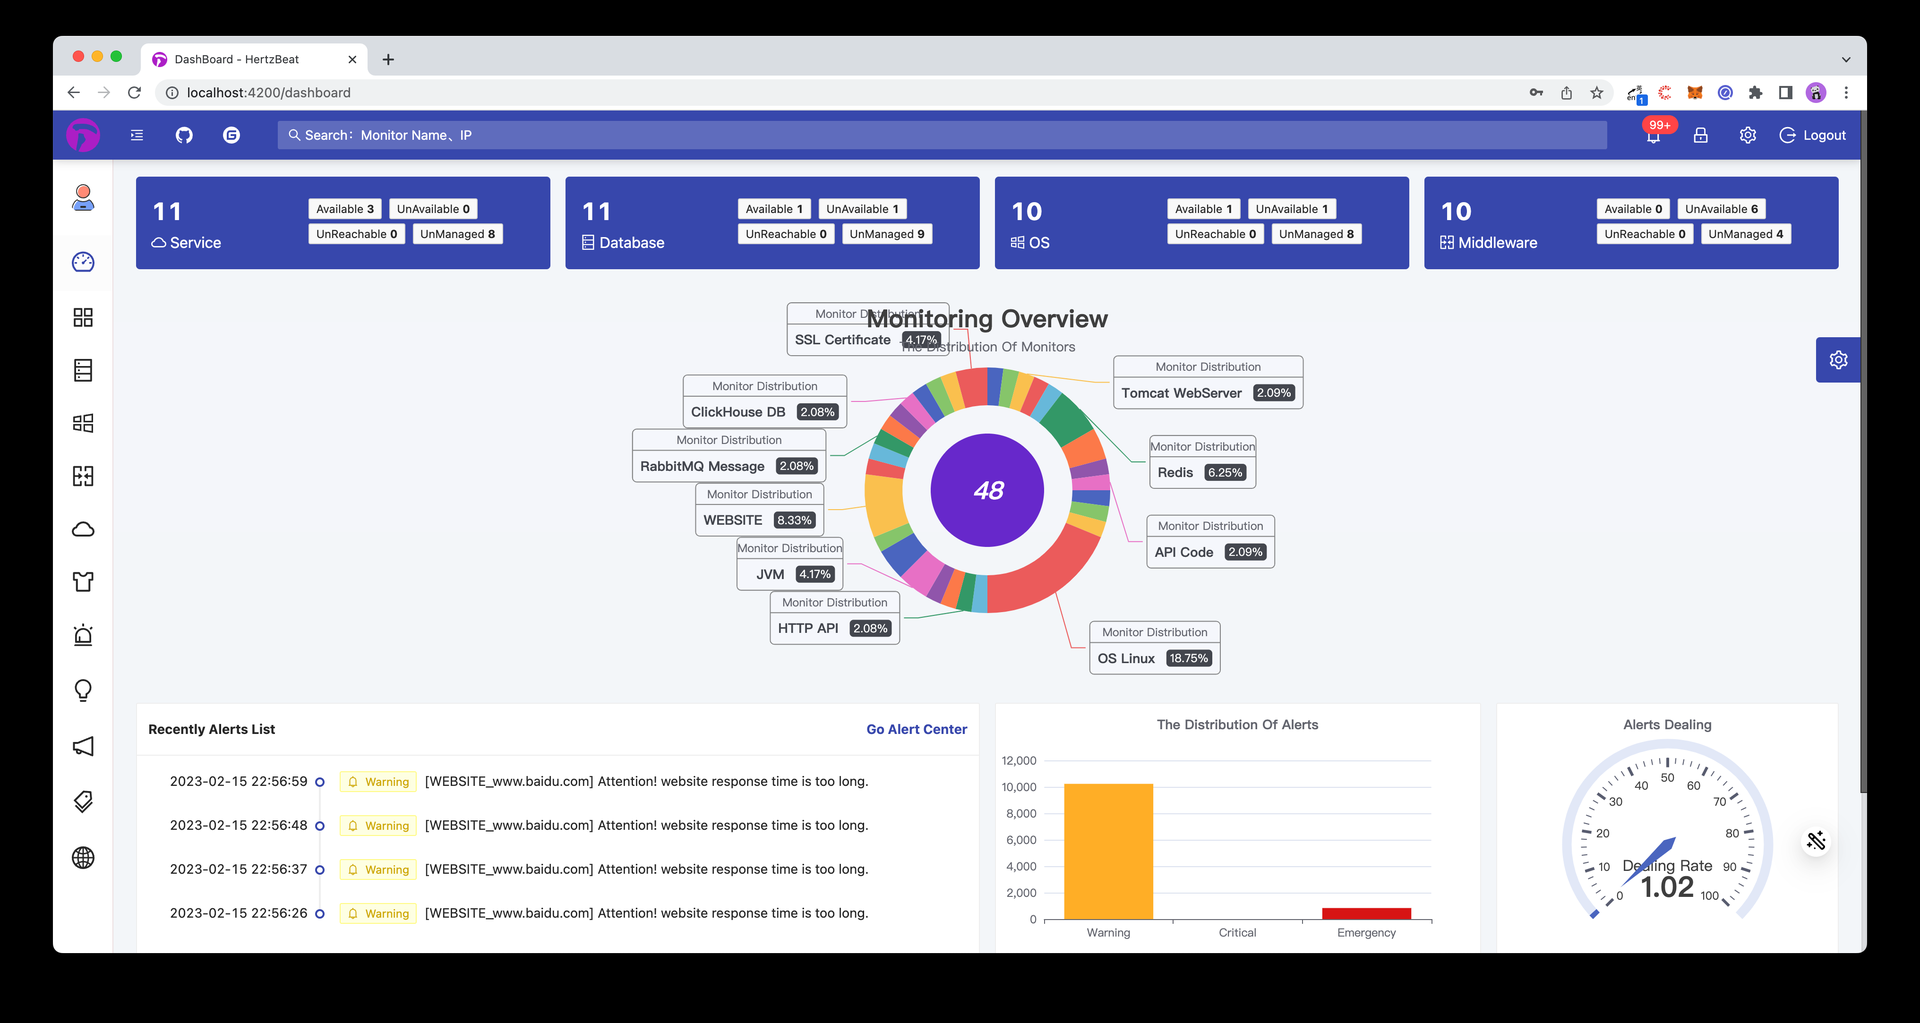
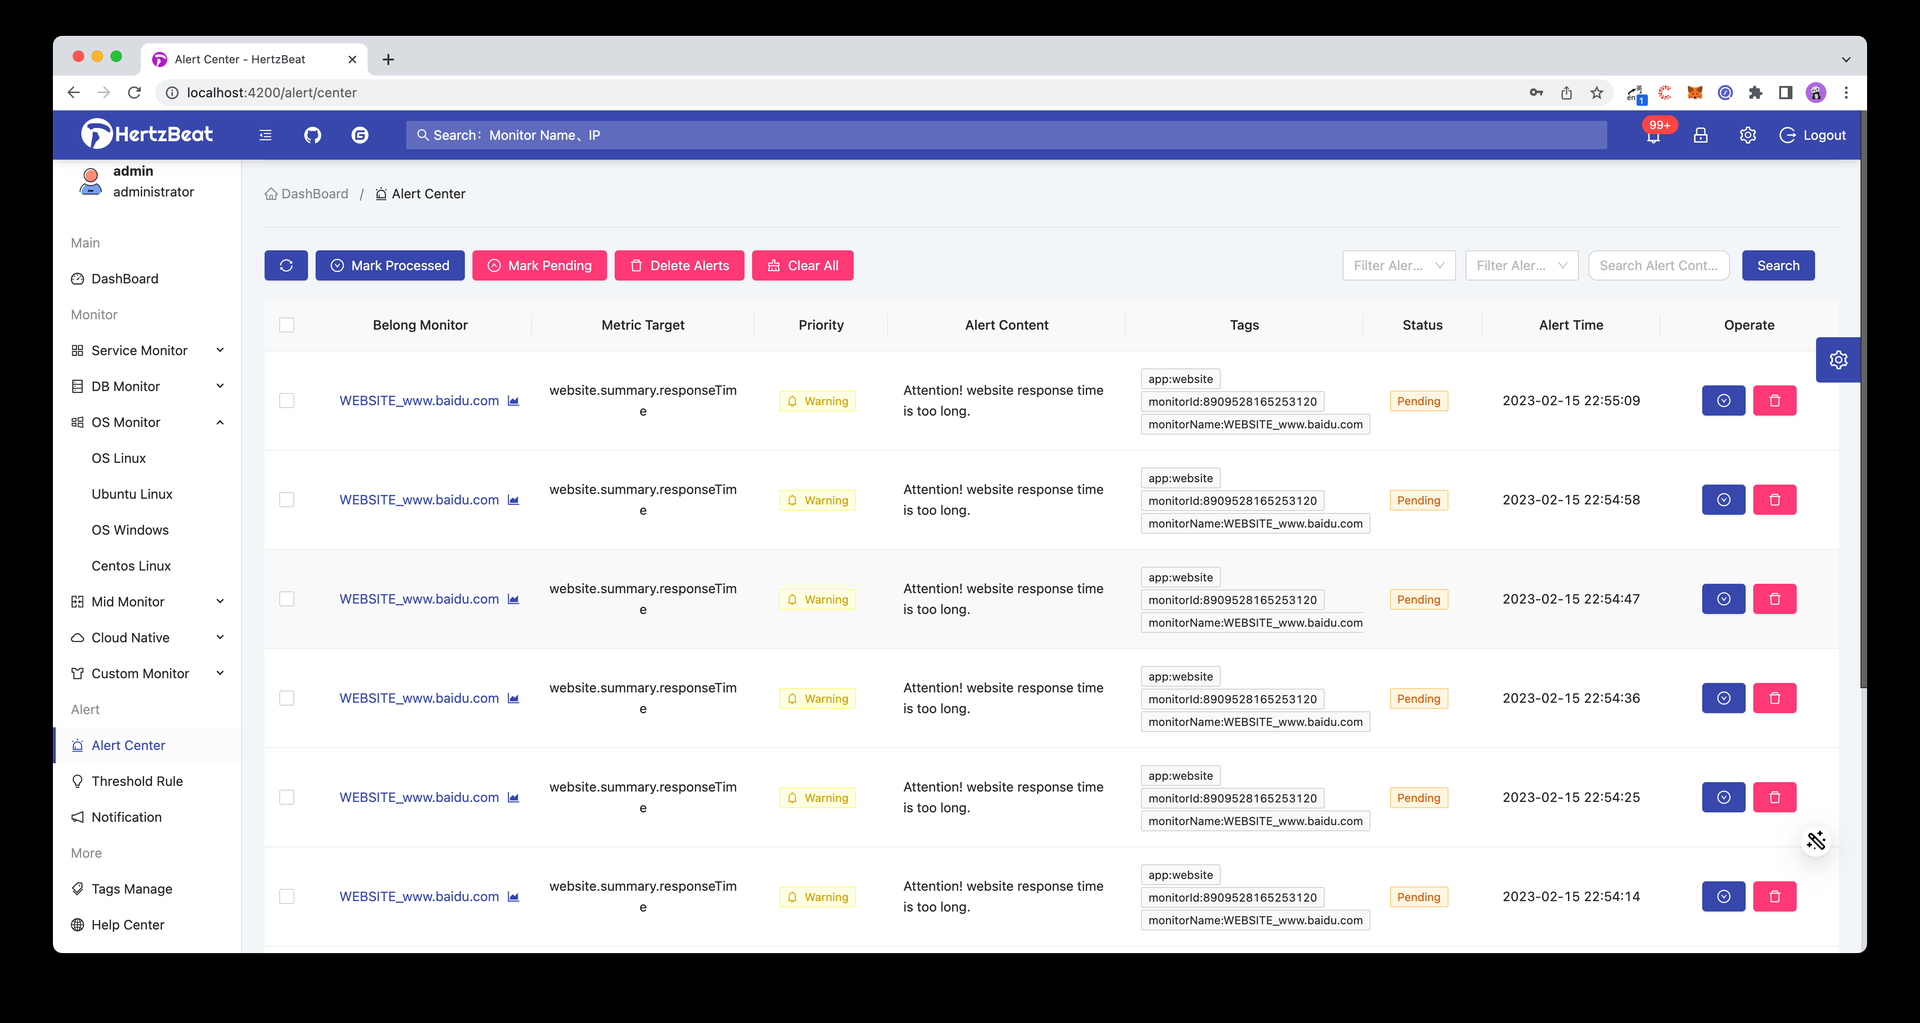
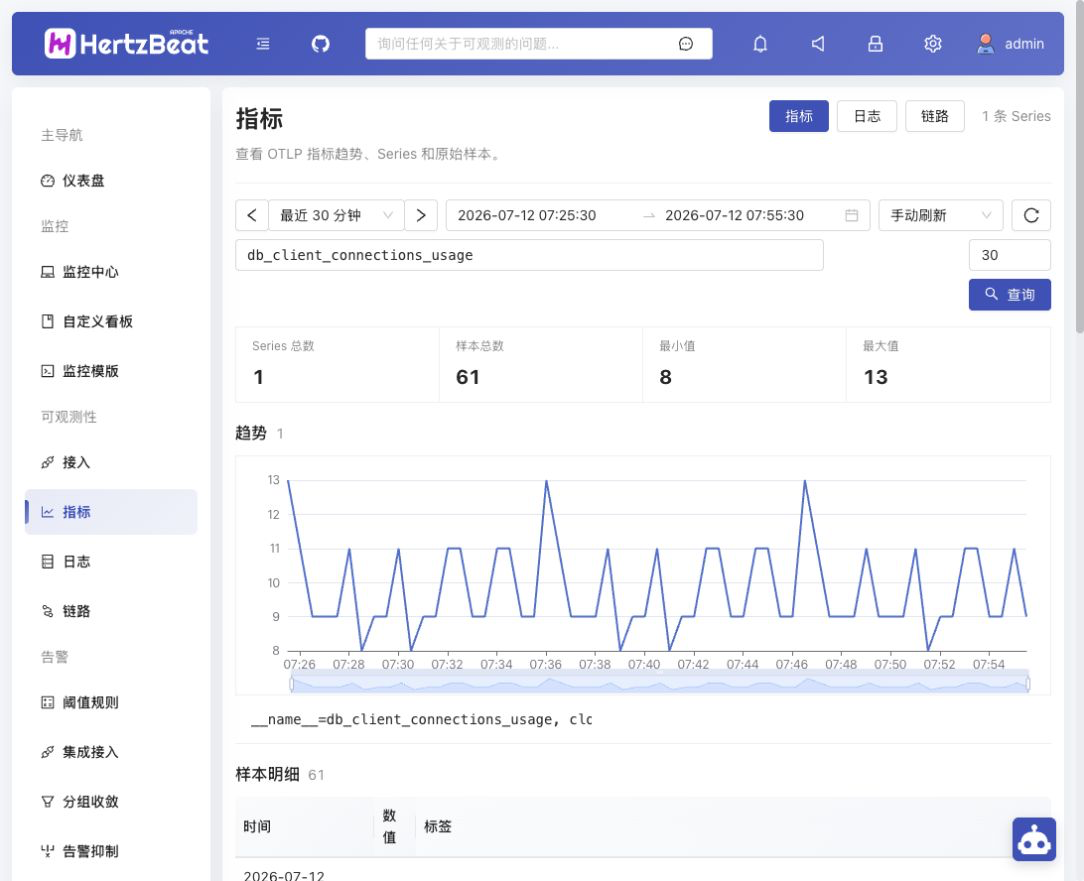
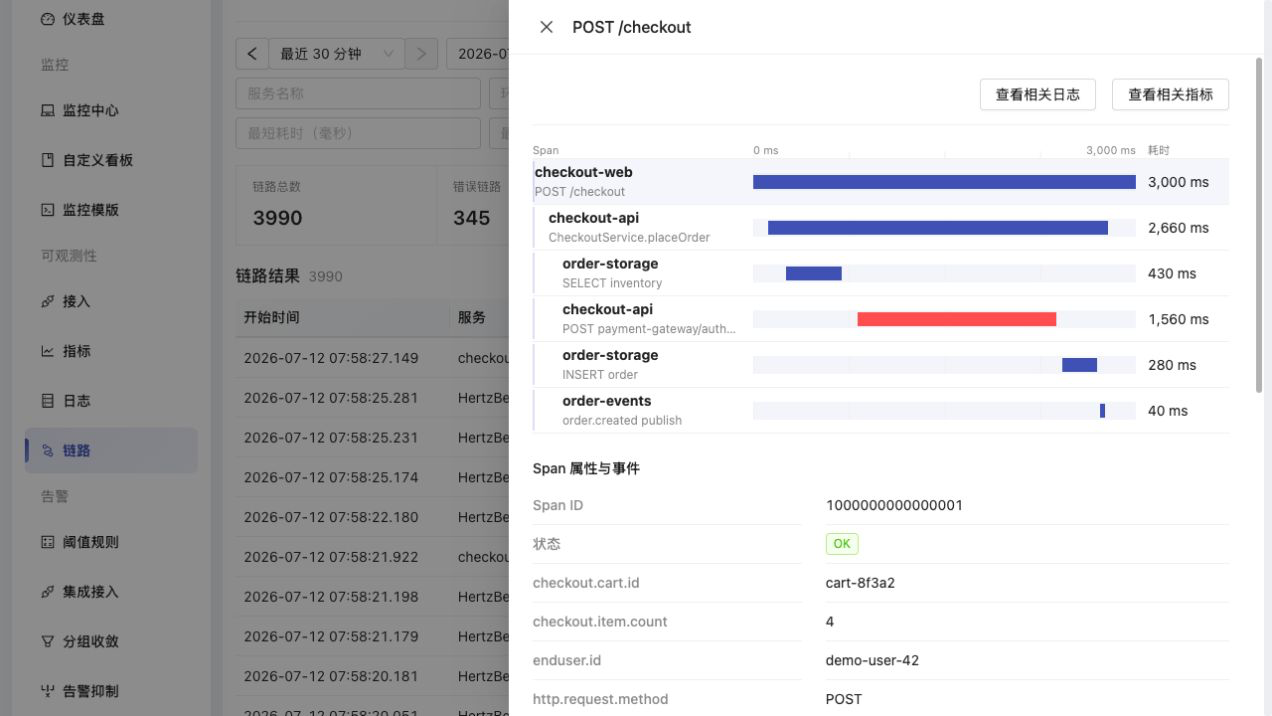
Instead of deploying proprietary background agents across dozens of target nodes, engineers rely on Apache HertzBeat to monitor real-time infrastructure health, metrics gathering, threshold alerting, and public status pages from a central operations platform. Operations teams can poll hundreds of target services without deploying proprietary background daemons, gathering performance data across Linux hosts, Kubernetes clusters, SQL databases, and network switches using native connection protocols. Engineers can define custom monitoring targets directly within the web dashboard by composing declarative YAML templates that specify polling intervals, parsing expressions, and metric extraction rules. The centralized alert engine processes inbound threshold events, suppresses cascading alert storms during maintenance windows, and dispatches actionable incident notifications to Discord channels, Slack rooms, Telegram groups, and webhook endpoints. Telemetry streams flow into interactive charts with customizable refresh cadences, enabling site reliability engineers to inspect latency waterfalls, correlate log spikes against CPU exhaustion, and track disk capacity trends over extended timeframes. Administrators can also publish real-time public status pages that inform external stakeholders about service availability, scheduled downtime, and ongoing incident resolutions. Running on a dedicated VPS on RepoCloud with guaranteed CPU, RAM, and SSD, full root SSH access, and a browser serial console. Apache 2.0 licensed.
Benefits
- Agentless Multi-Protocol Telemetry Collection
- Direct polling via native HTTP, SNMP, JMX, SSH, and JDBC connections gathers server and application metrics without requiring organizations to install and maintain proprietary background daemon processes on target nodes.
- Declarative YAML Monitoring Extensibility
- Creating and editing YAML configuration templates allows infrastructure engineers to define custom metrics, scrape rules, and thresholds for emerging services and hardware devices directly through the browser without recompiling server code.
- Intelligent Incident Alert Management
- Configurable threshold engines support alert convergence, maintenance silencing, and multi-channel notifications across Slack, Telegram, Discord, and webhooks to eliminate noisy paging while preventing critical production outages.
- Integrated Public Status Communication
- Built-in status page generators publish real-time component health and historical uptime records for internal teams and public users without requiring external subscriptions to hosted status services.
Features
- Agentless Metric Collection
- Query infrastructure using native HTTP, SNMP, JMX, SSH, and JDBC protocols without deploying client daemons on monitored hosts.
- Declarative Monitoring Templates
- Define custom metrics, extraction rules, and polling intervals by authoring YAML configuration templates directly within the management interface.
- Multi-Channel Alert Distribution
- Route threshold notifications to Slack, Discord, Telegram, SMS, WeChat, and generic webhook endpoints with customizable alert suppression rules.
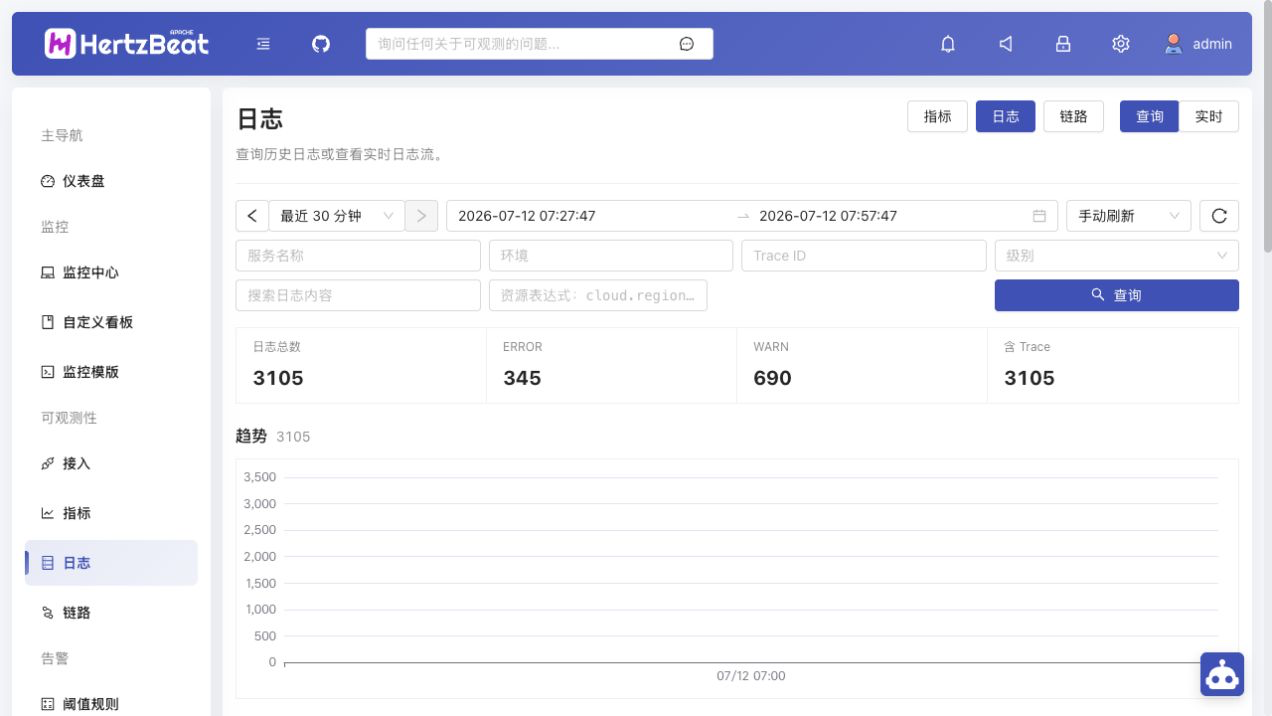
- OpenTelemetry Log Ingestion
- Ingest and correlate distributed logs via standard OTLP protocols to trace error propagation and diagnose infrastructure bottlenecks alongside metrics.
- Public Status Page Generator
- Publish branded service health dashboards displaying real-time uptime metrics, incident notifications, and maintenance schedules for external customers.