Stars
Forks
Watchers
Developer links
EaseProbe
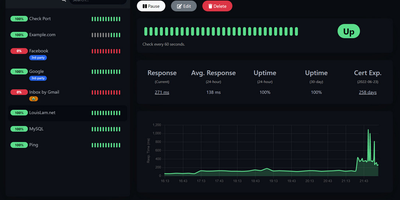
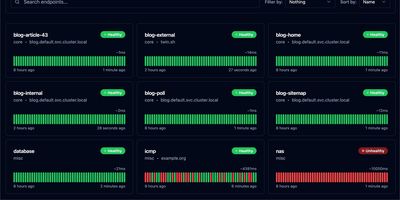
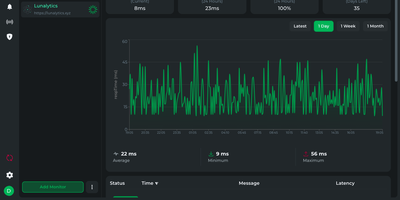
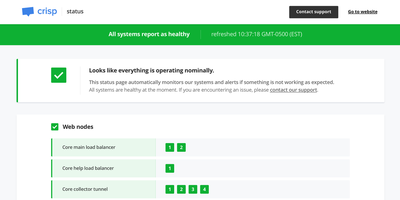
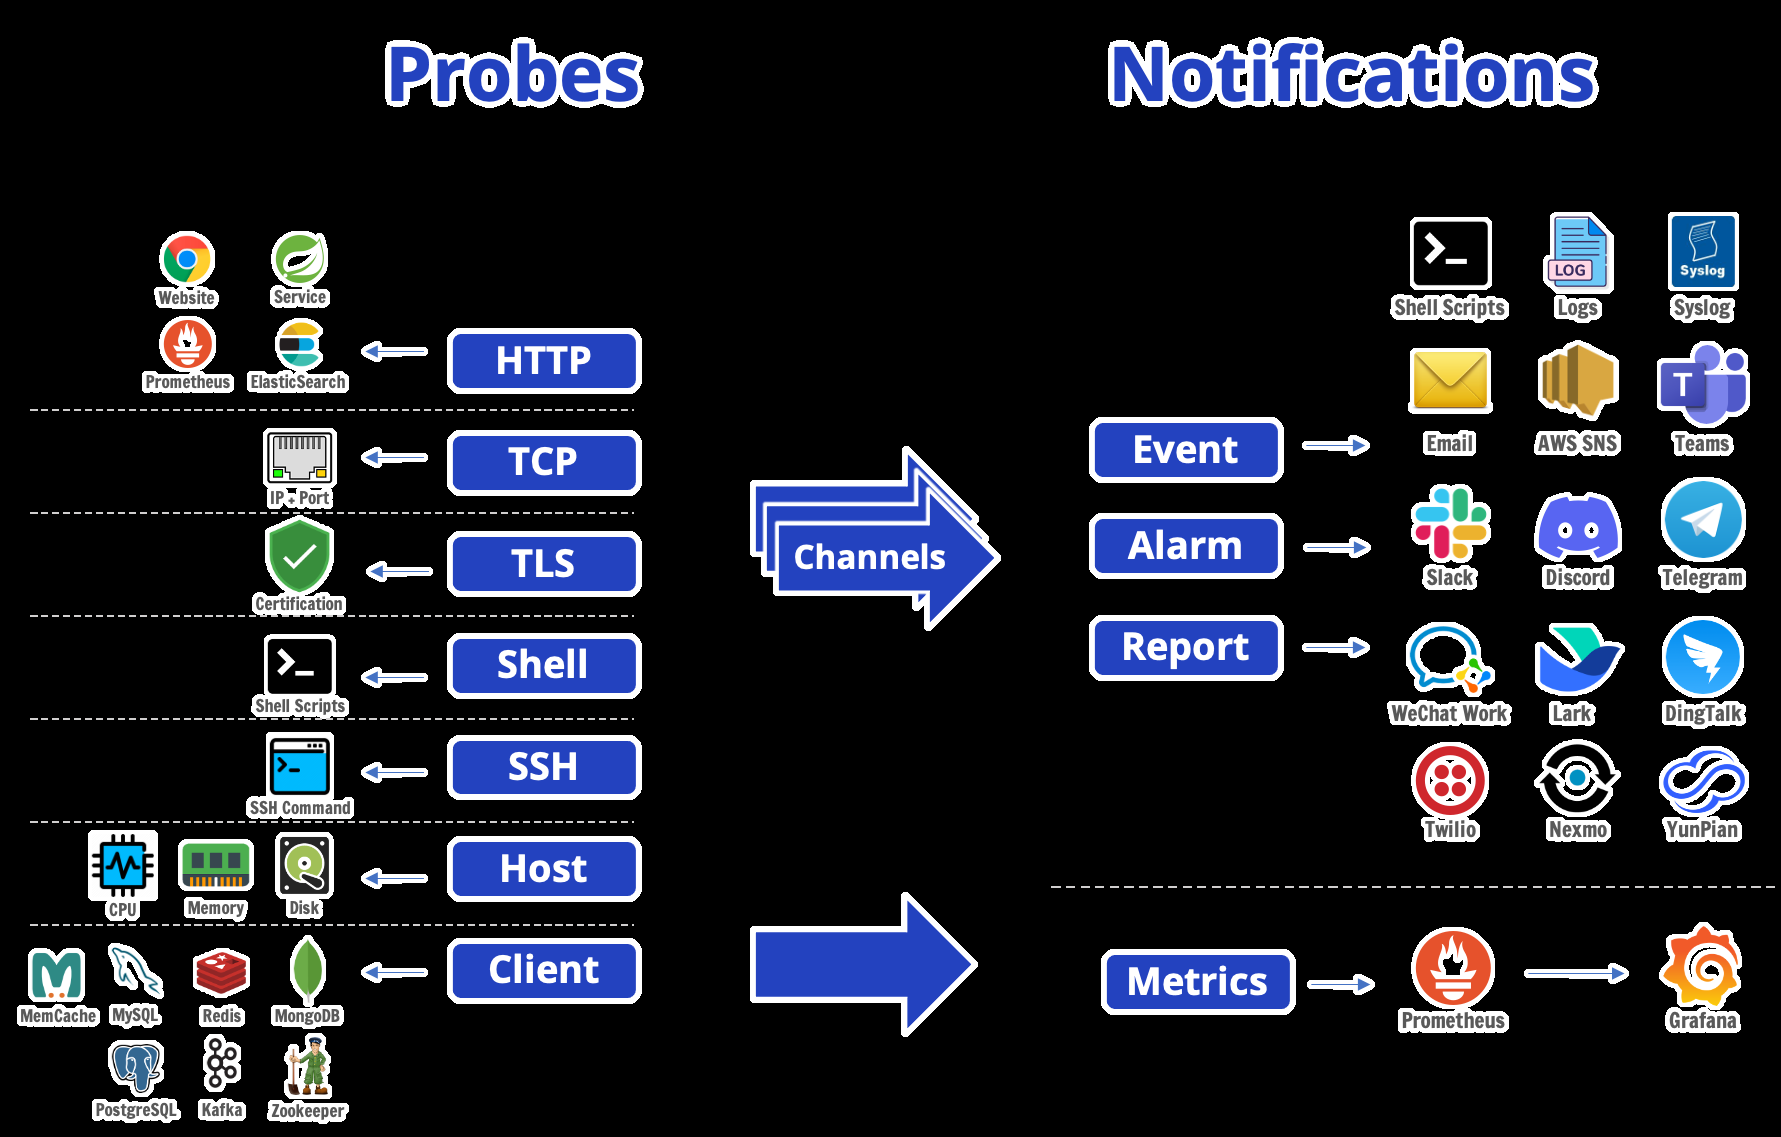
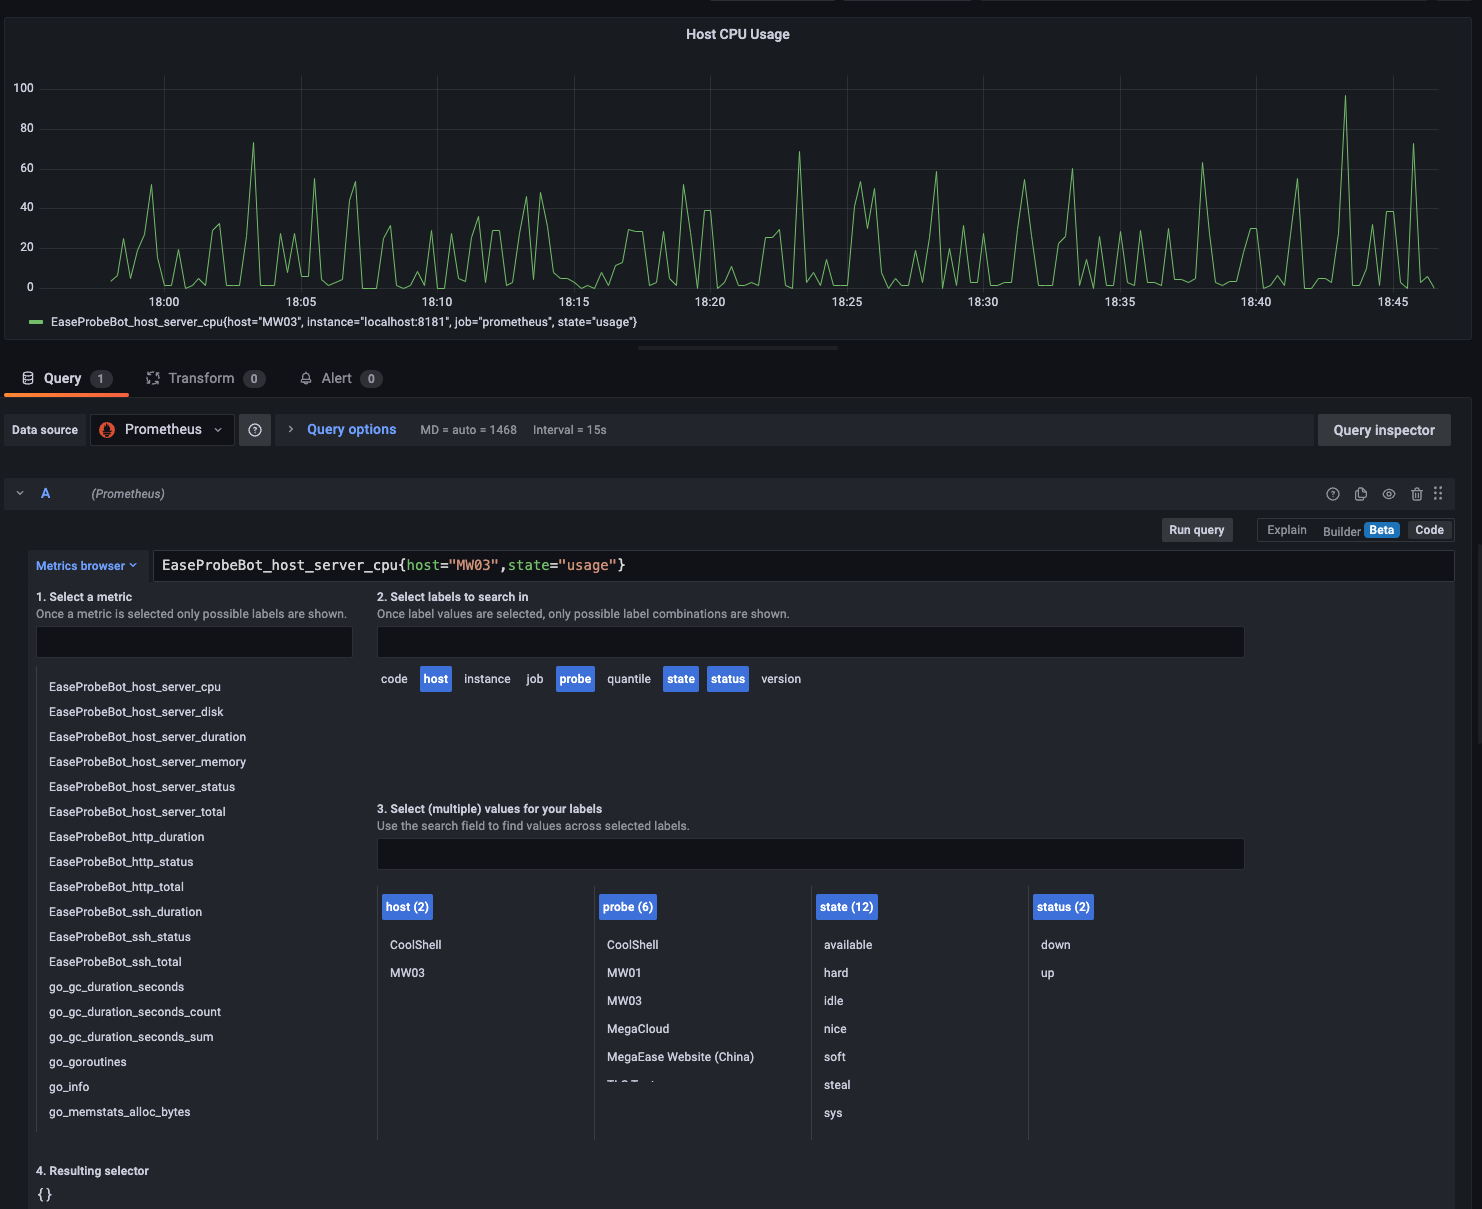
A single binary watches everything you care about and only bothers you when something breaks. EaseProbe is an open-source health and status checker that probes websites over HTTP, TCP ports, ping, TLS certificates, shell commands, SSH hosts, and native clients for MySQL, PostgreSQL, Redis, MongoDB, Kafka, Memcache, and ZooKeeper. Each target gets an interval, timeout, retry checks, and data validation, from HTTP status and XPath evaluation to a Redis key matching an expected value; SSH host probes also watch CPU, memory, and disk so slow saturation gets caught alongside hard failures. When a target flips state, edge-triggered notifications fan out to Slack, Discord, Telegram, Microsoft Teams, email, AWS SNS, WeCom, DingTalk, Lark, SMS providers, log files, syslog, or your own shell script, with repeat alerts and quiet recovery behavior under your control. Availability history accumulates into daily, weekly, or monthly SLA reports delivered through those same channels, plus a live SLA page and JSON endpoint served by the probe itself. Everything it measures also exits as Prometheus metrics with per-target status, latency, and uptime, ready for Grafana dashboards and alerting rules alongside the rest of your stack. Configuration is one YAML file, persistence is one local data file, and the same binary runs on a tiny VPS watching an entire fleet. Running on a dedicated VPS on RepoCloud with guaranteed CPU, RAM, and SSD, full root SSH access, and a browser serial console. Apache-2.0 licensed.
Benefits
- One Binary Watches Everything
- HTTP endpoints, TCP ports, certificates, SSH hosts, and seven database and queue clients are all probed by one small program with a single YAML configuration file.
- Alerts Only On Change
- Edge-triggered notification sends the first failure and the recovery to Slack, Teams, email, SMS, or a script, instead of repeating the same alarm every interval.
- SLA Numbers You Can Show
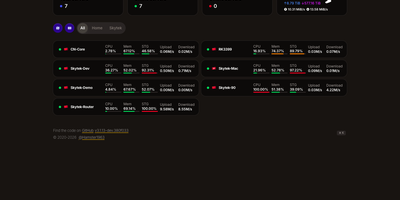
- Availability history becomes daily, weekly, or monthly SLA reports plus a live report page, giving clients and managers uptime figures without a separate reporting stack.
- Prometheus Metrics Built In
- Per-target status, latency, and uptime metrics feed your existing Grafana dashboards and alert rules, so this probe joins your stack instead of replacing it.
Features
- Seven Probe Families
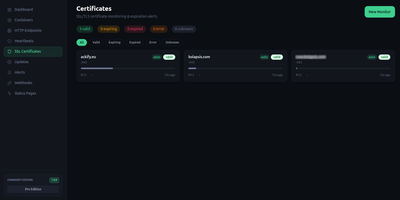
- HTTP with auth, headers, bodies, and XPath checks; TCP and ping reachability; TLS expiry and revocation; shell commands; SSH commands through bastion hosts.
- Native Database Clients
- MySQL, PostgreSQL, Redis, Memcache, MongoDB, Kafka, and ZooKeeper checks run real protocol operations, including value validation against expected results, all with mTLS support.
- Thirteen Notification Channels
- Slack, Discord, Telegram, Teams, email, AWS SNS, WeCom, DingTalk, Lark, three SMS providers, log files, syslog, and custom shell scripts receive events, alarms, and reports.
- Live SLA Report Server
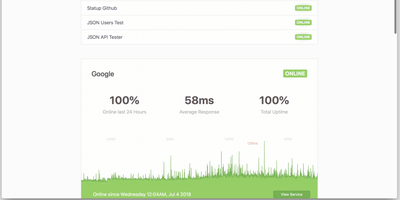
- The built-in HTTP server serves an HTML availability report and a JSON API for all targets, persisted locally so restarts keep the history intact.