Categories
Self-Hosted DevOps Monitoring Infrastructure Dashboard Alerting Uptime Monitoring Server MonitoringStars
Forks
Watchers
Developer links
Nezha Monitoring
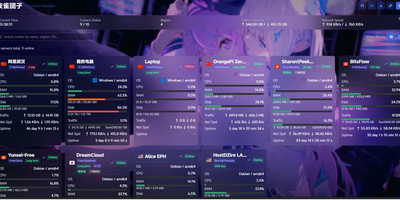
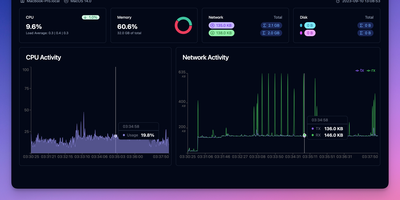
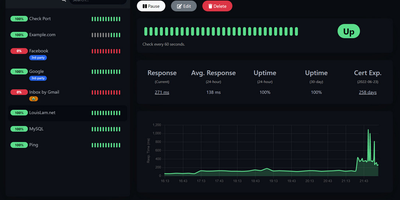
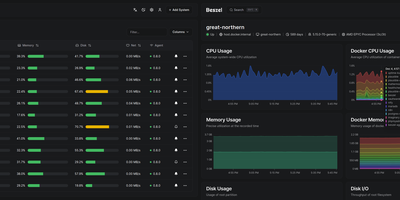
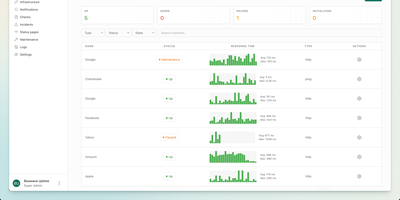
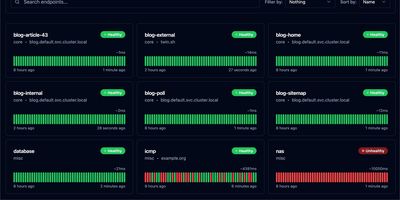
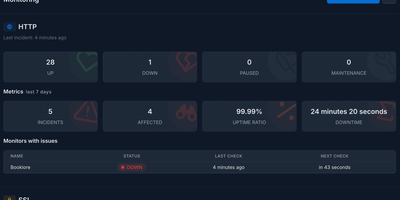
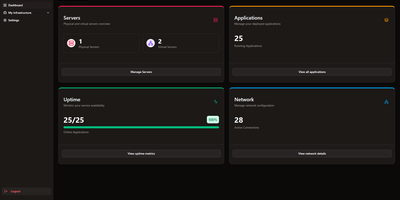
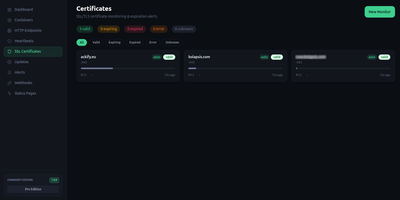
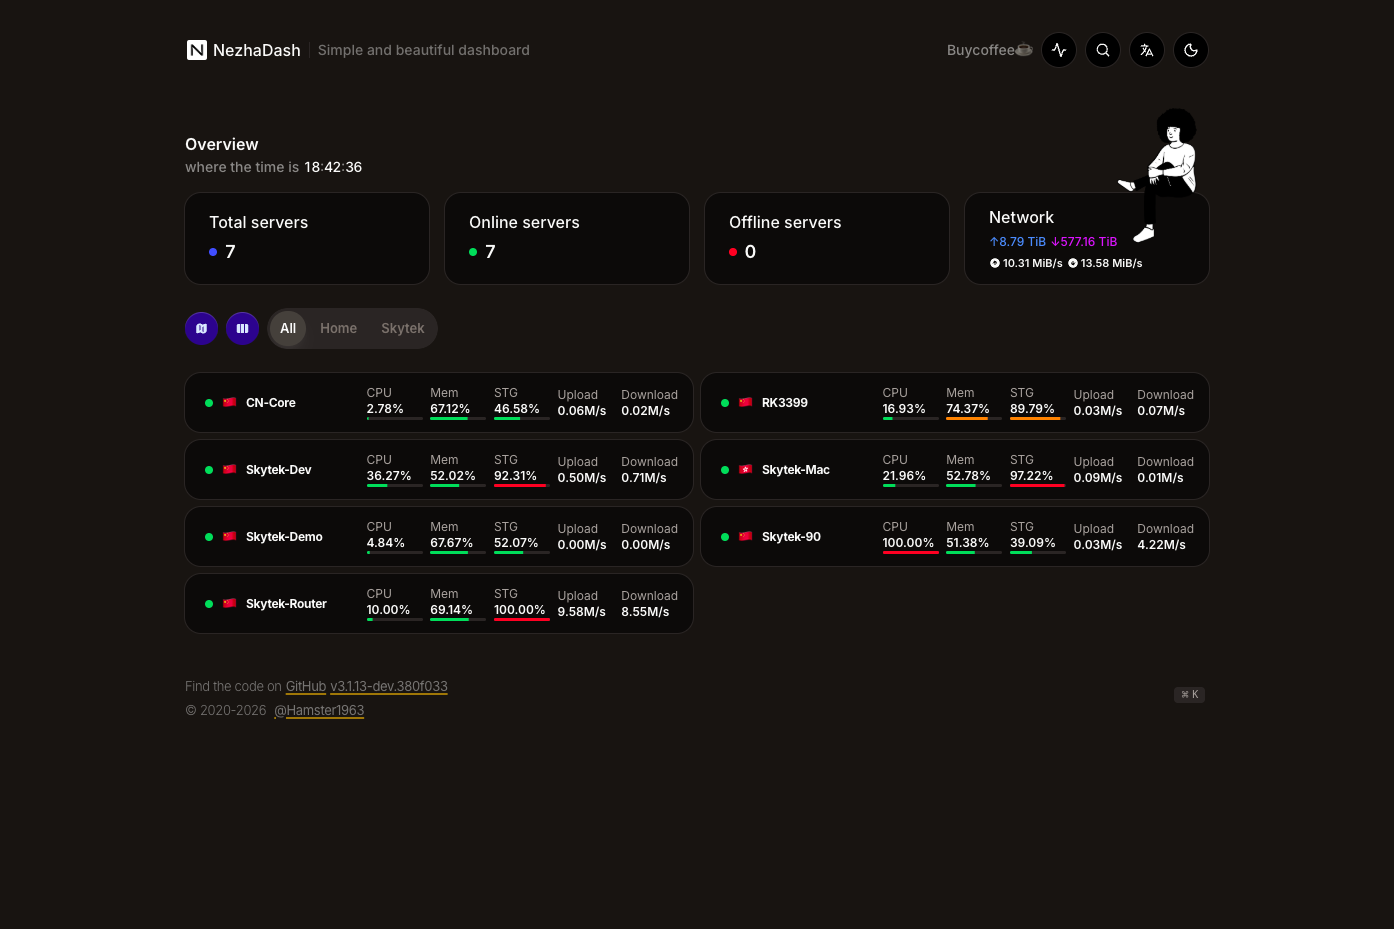
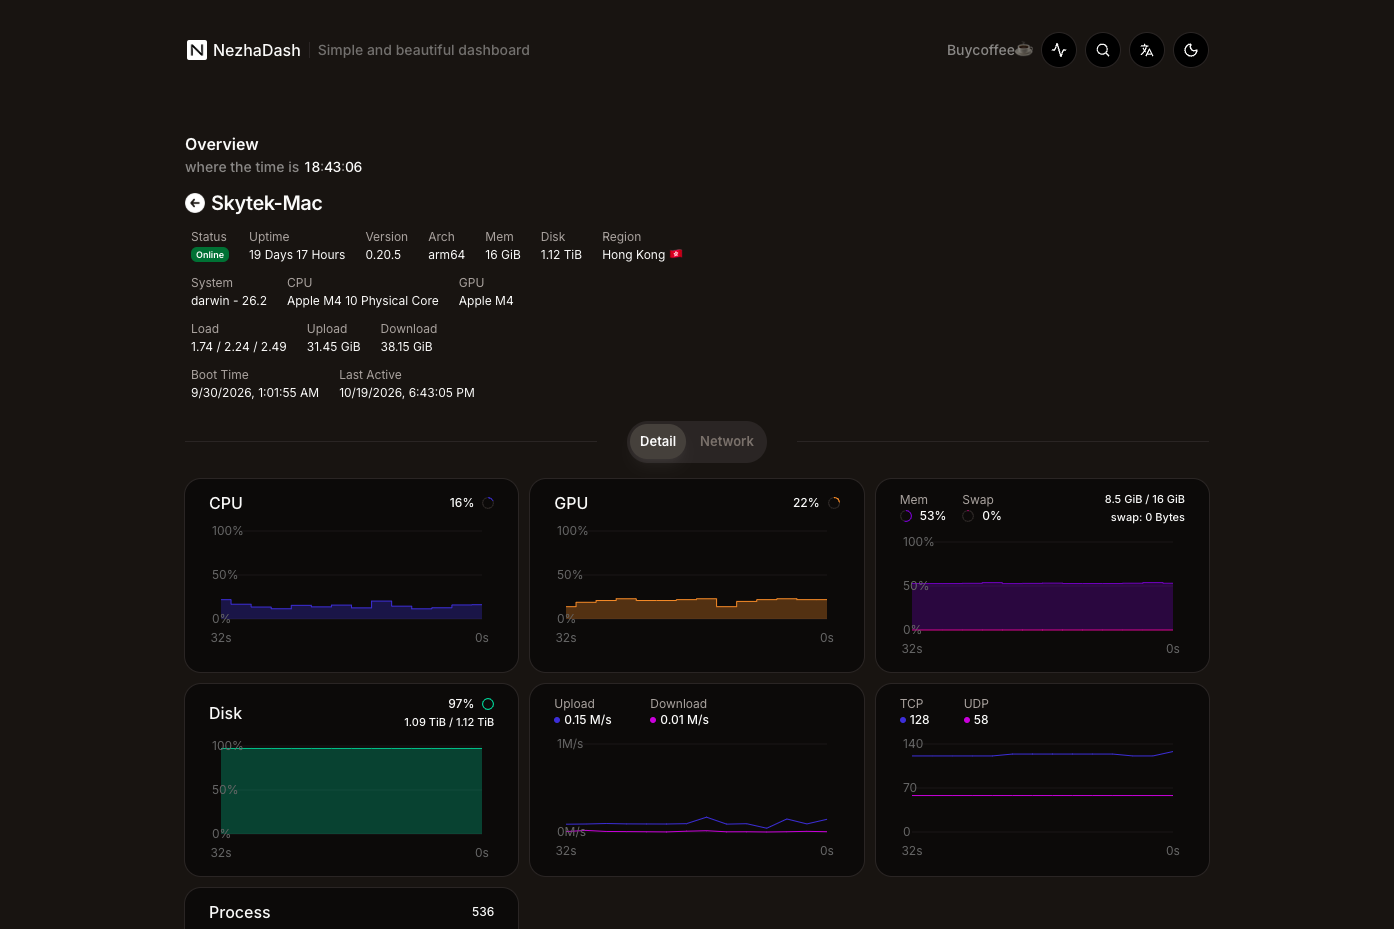
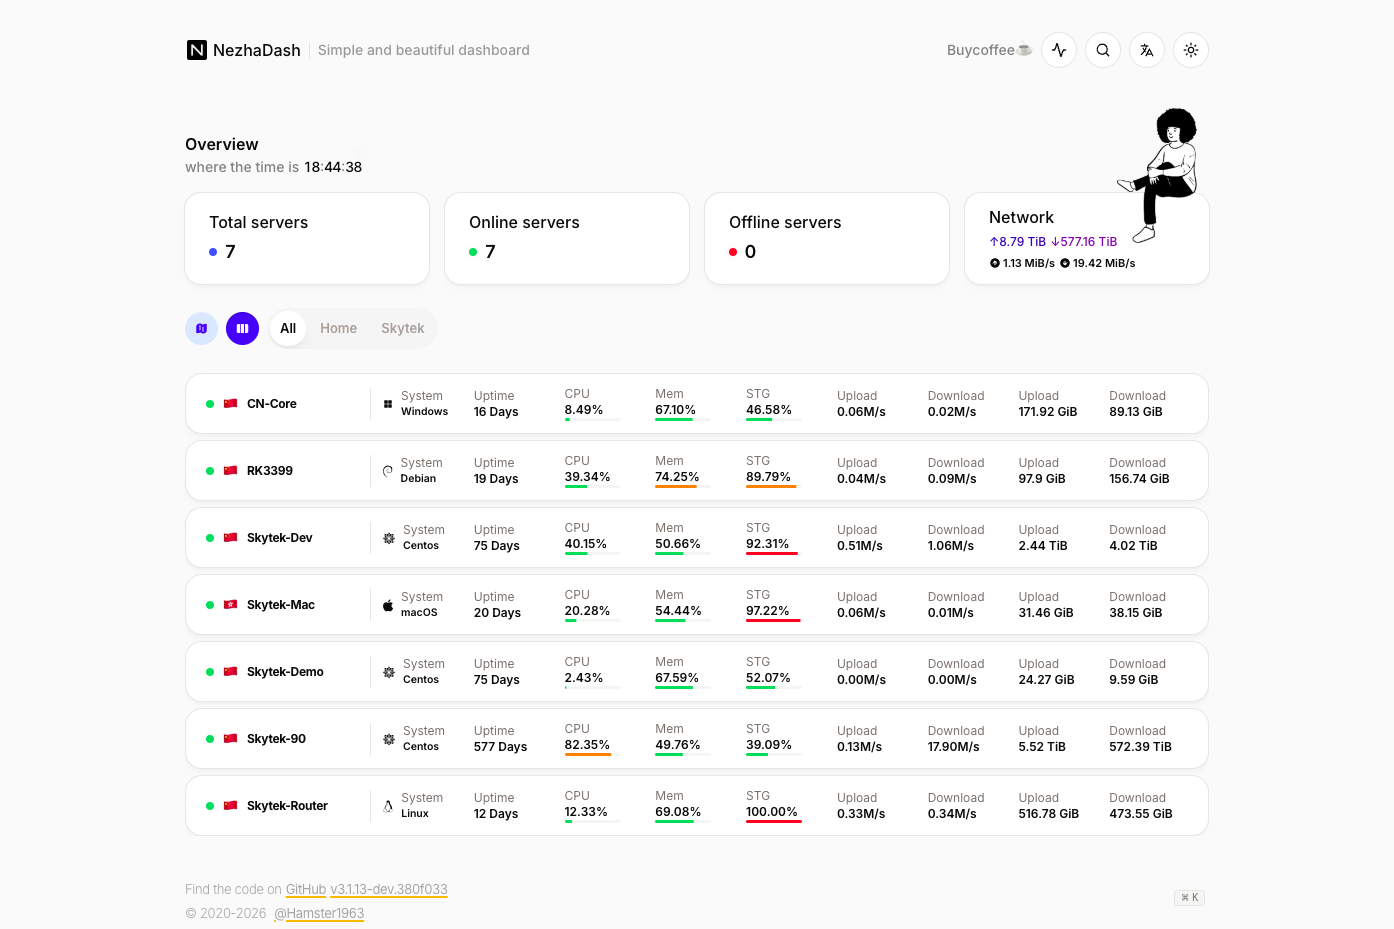
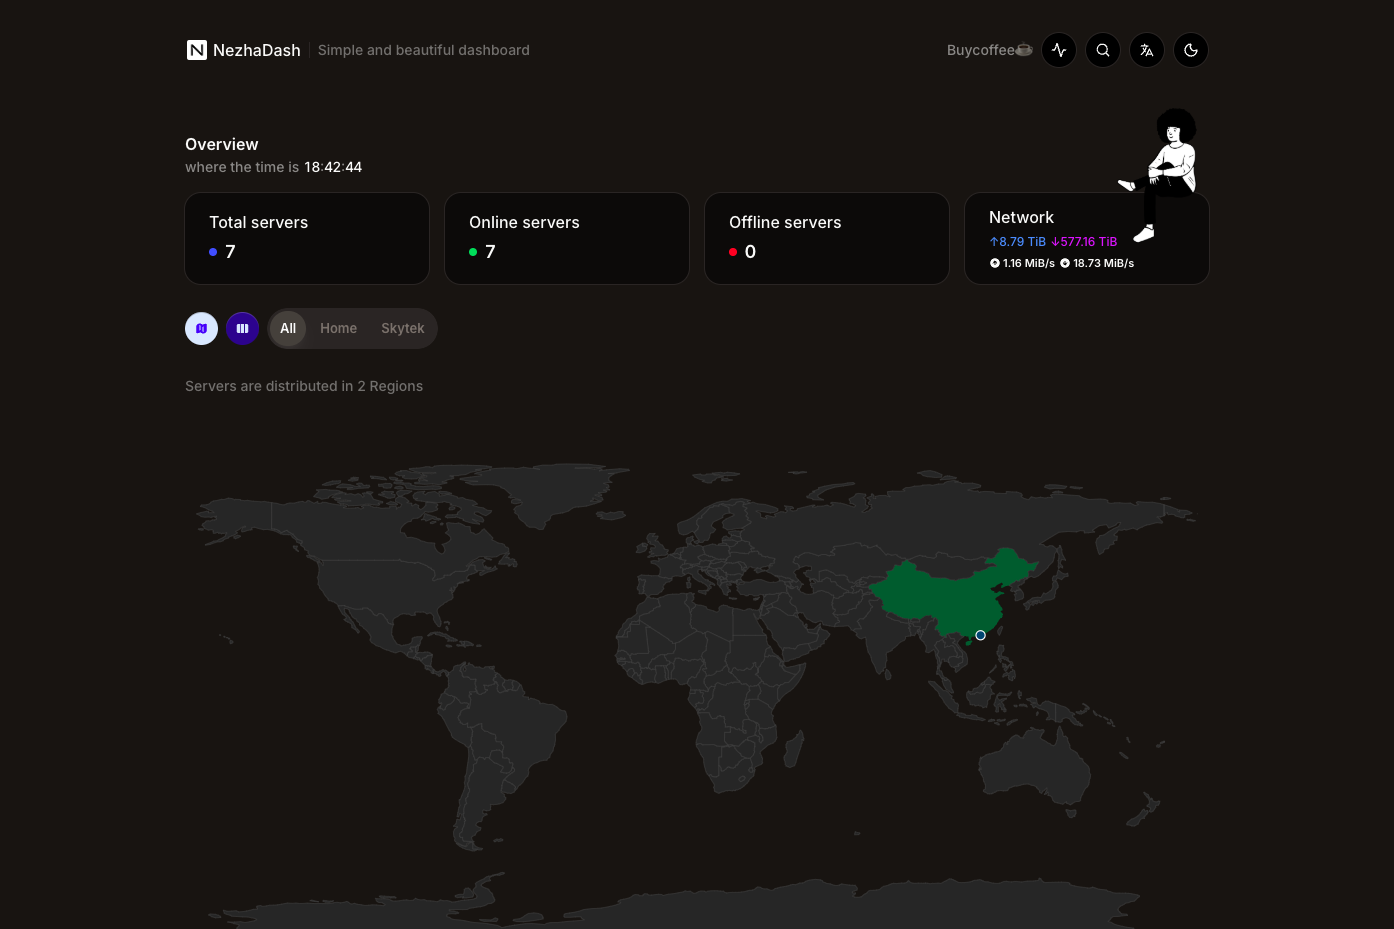
Keep every VPS, home-lab box, NAS, and router you run on one self-hosted dashboard, with a small agent on each machine reporting whether it is up and how hard it is working. Nezha tracks CPU, memory, swap, disk, load, traffic, process counts, and TCP and UDP connections on Linux, Windows, macOS, OpenWRT, and Synology machines, plus GPU and temperature where supported. Servers sort into groups and appear as cards, a list, or a world map, with live charts and, when the optional time-series database is on, 1, 7, and 30 days of history. HTTP GET, ICMP Ping, and TCPing monitors run from the servers you choose, chart latency and packet loss, and warn about HTTPS certificate changes and upcoming expiry. Alert rules watch offline servers, resource use, bandwidth, and cycle traffic limits, then message Telegram, Slack, Matrix, Feishu, DingTalk, or any webhook. A browser terminal and file manager handle quick fixes, while scheduled or alert-triggered tasks run backups, restarts, and scripts across many servers. DDNS updates Cloudflare, Tencent Cloud, or Hurricane Electric records when an agent's IP changes, and NAT traversal publishes a home router or NAS page on your own domain. Admin and user roles, scoped API tokens, and an optional MCP endpoint let people and AI tools list servers and run commands within their permissions. Running on a dedicated VPS on RepoCloud with guaranteed CPU, RAM, and SSD, full root SSH access, and a browser serial console. Apache-2.0 licensed.
Benefits
- One dashboard for every machine
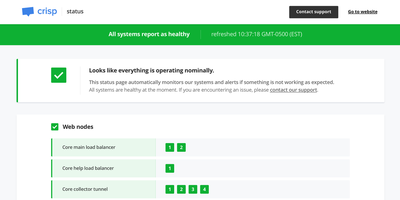
- Lightweight agents for Linux, Windows, macOS, OpenWRT, and Synology feed one status page, so VPS fleets, cloud servers, NAS boxes, and home-lab hardware stay visible together.
- Catch outages before users do
- Offline, resource, bandwidth, and monthly traffic rules plus HTTP, Ping, and TCP checks notify Telegram, Slack, Matrix, Feishu, DingTalk, or any webhook, and can run a task when an alert fires or recovers.
- Operate servers from the browser
- A web terminal for Linux and Windows, a file manager for Unix-like systems, and cron-style tasks cover quick fixes, restic or rclone backups, and scheduled restarts without a separate SSH client.
- Light enough for a small VPS
- One CPU core and 512 MB of RAM are enough for most deployments, and a single port, 8008 by default, serves both the web interface and Agent connections.
Features
- Live Server Metrics
- Agents report CPU, memory, disk, load, traffic, process counts, and TCP and UDP connections, plus GPU and temperature where supported, with optional 1, 7, and 30 day history charts.
- Service and Certificate Checks
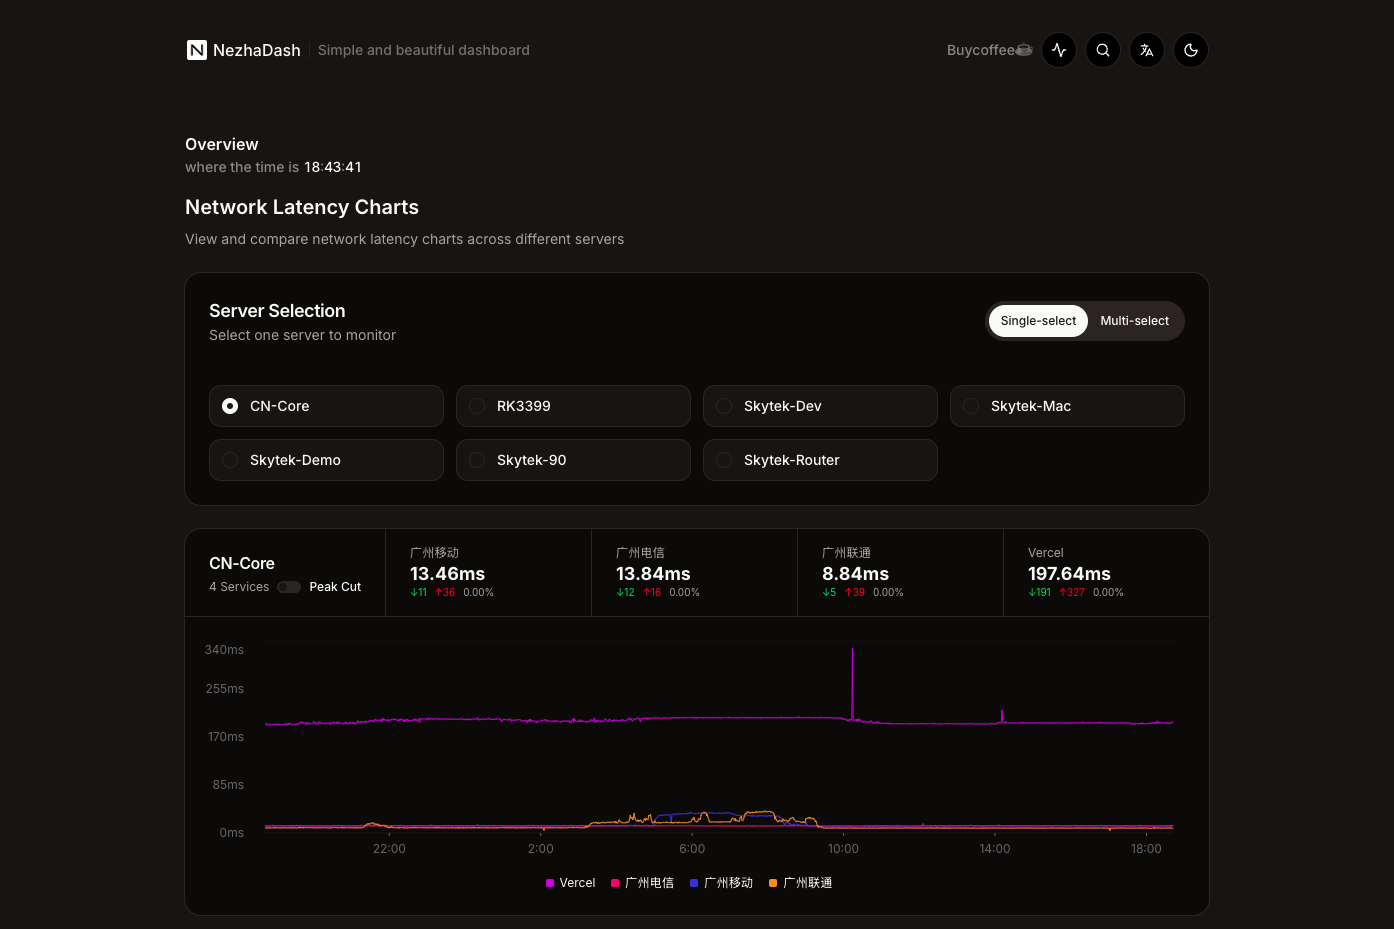
- HTTP GET, ICMP Ping, and TCPing monitors run from chosen Agents, track availability and latency, chart packet loss, and warn when an HTTPS certificate changes or nears expiry.
- Alert Rules and Notifications
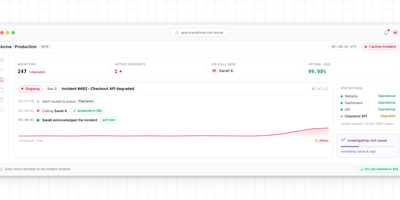
- Threshold rules cover offline state, CPU, memory, disk, bandwidth, load, connections, and cycle traffic, then send webhook, Telegram, Slack, Matrix, DingTalk, or Feishu messages to notification groups.
- Terminal, Files, and Tasks
- A WebShell works on Linux and Windows, the file manager uploads and downloads on Unix-like systems, and cron-scheduled or alert-triggered tasks run commands across selected servers.
- DDNS and NAT Traversal
- DDNS updates Cloudflare, Tencent Cloud, Hurricane Electric, or webhook-based records when an Agent's IP changes; NAT traversal exposes HTTP services, such as a router page, on a bound domain.
- REST API and MCP
- Scoped API tokens with server allowlists secure the REST API, and an optional MCP endpoint lets AI tools list servers, run one-shot commands, and read or write files.