Categories
Network Monitoring Server Monitoring Infrastructure Monitoring IT Operations Alert Management Monitoring Dashboard Business Process MonitoringStars
Forks
Watchers
Developer links
Icinga Web 2
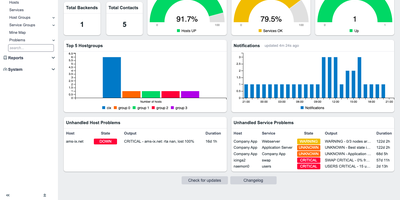
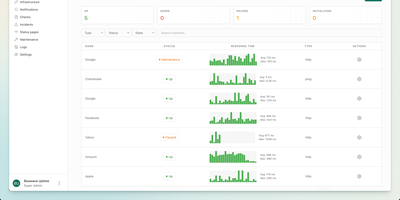
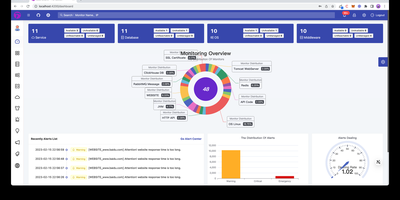
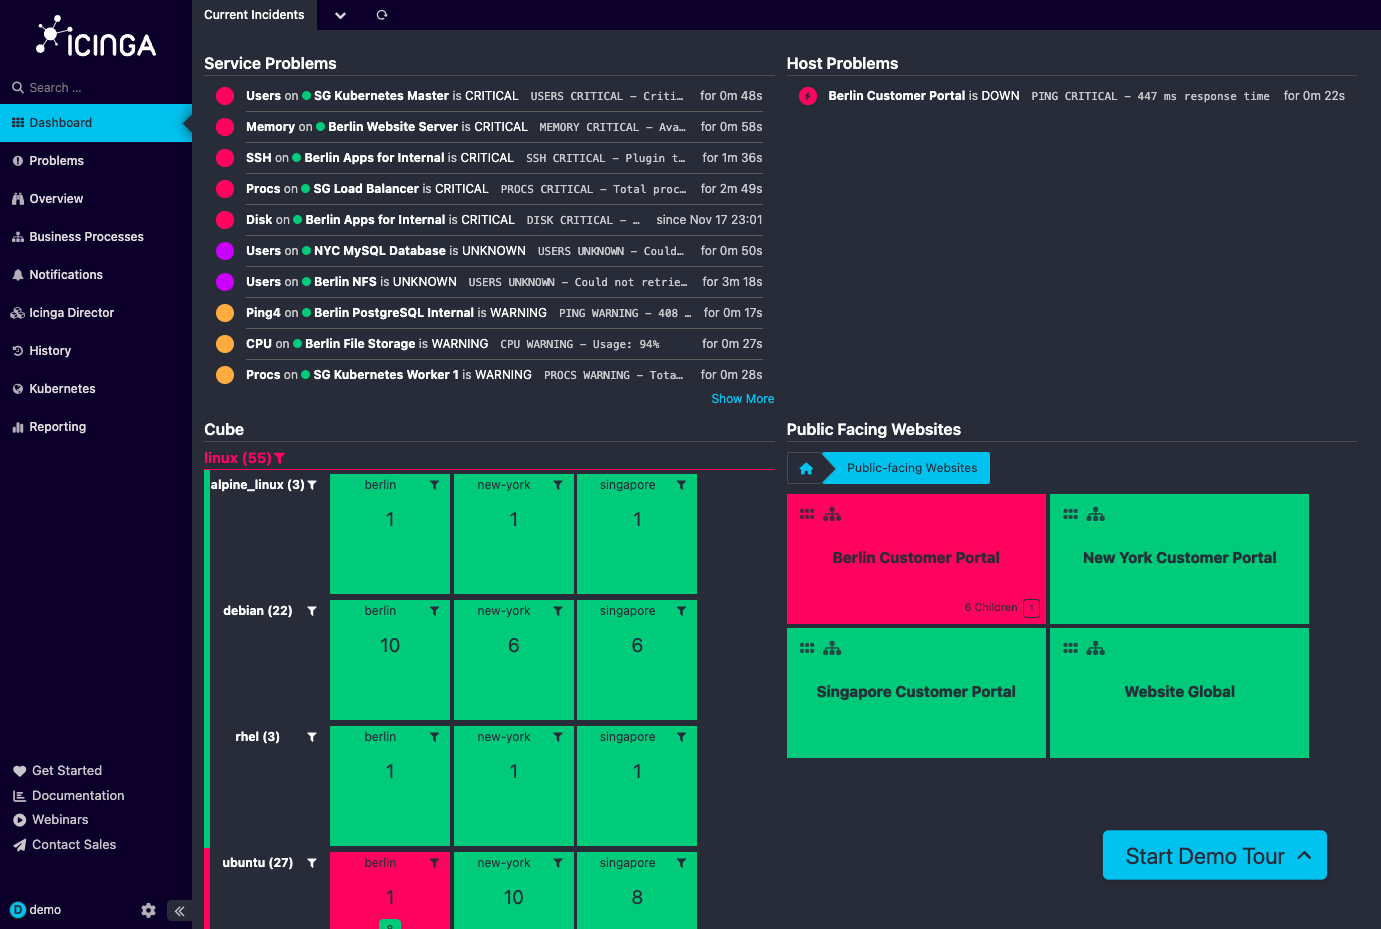
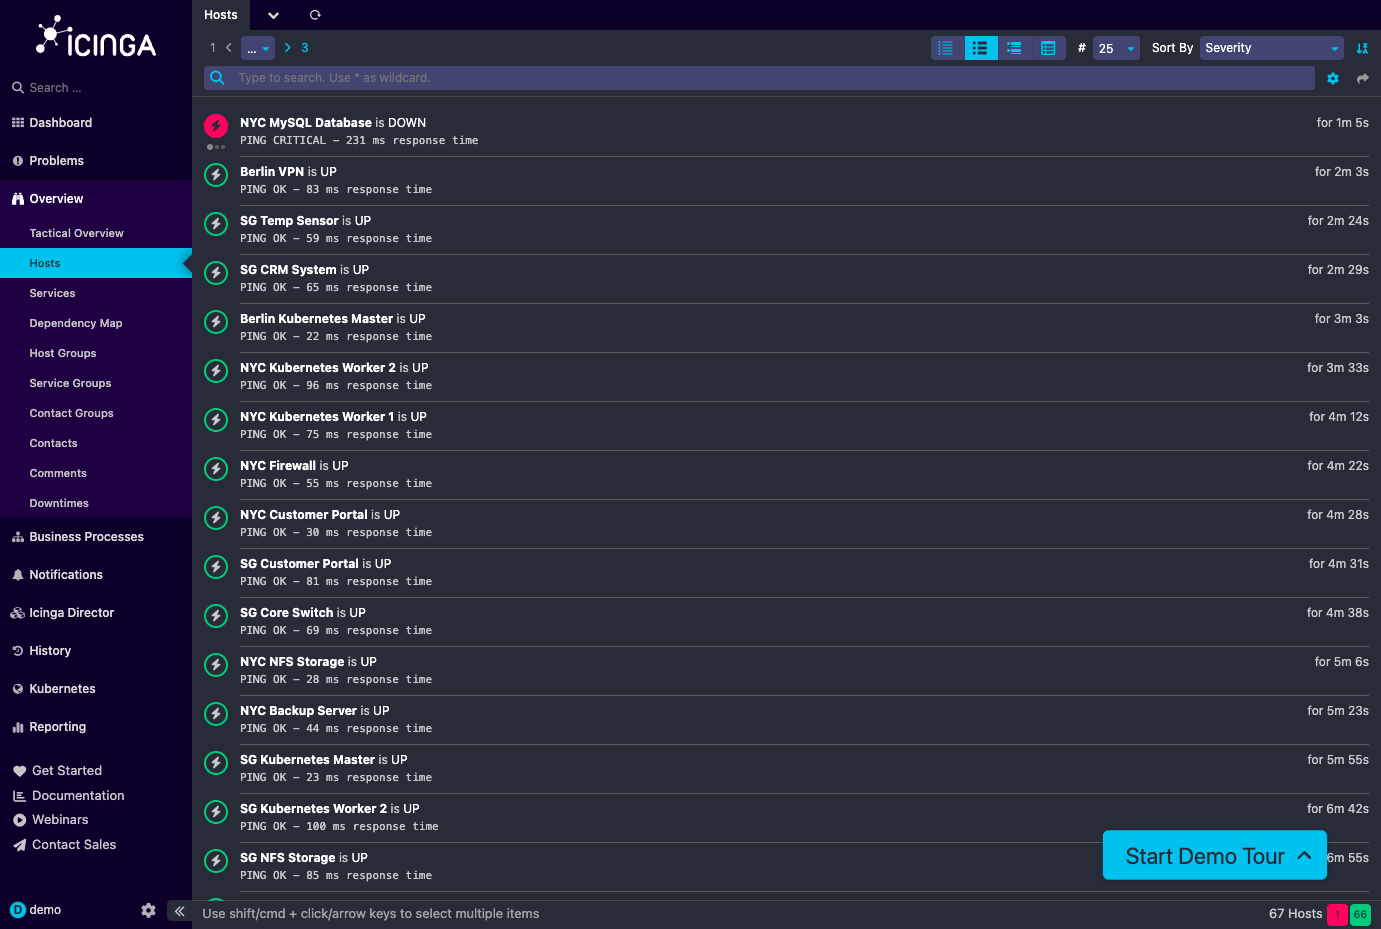
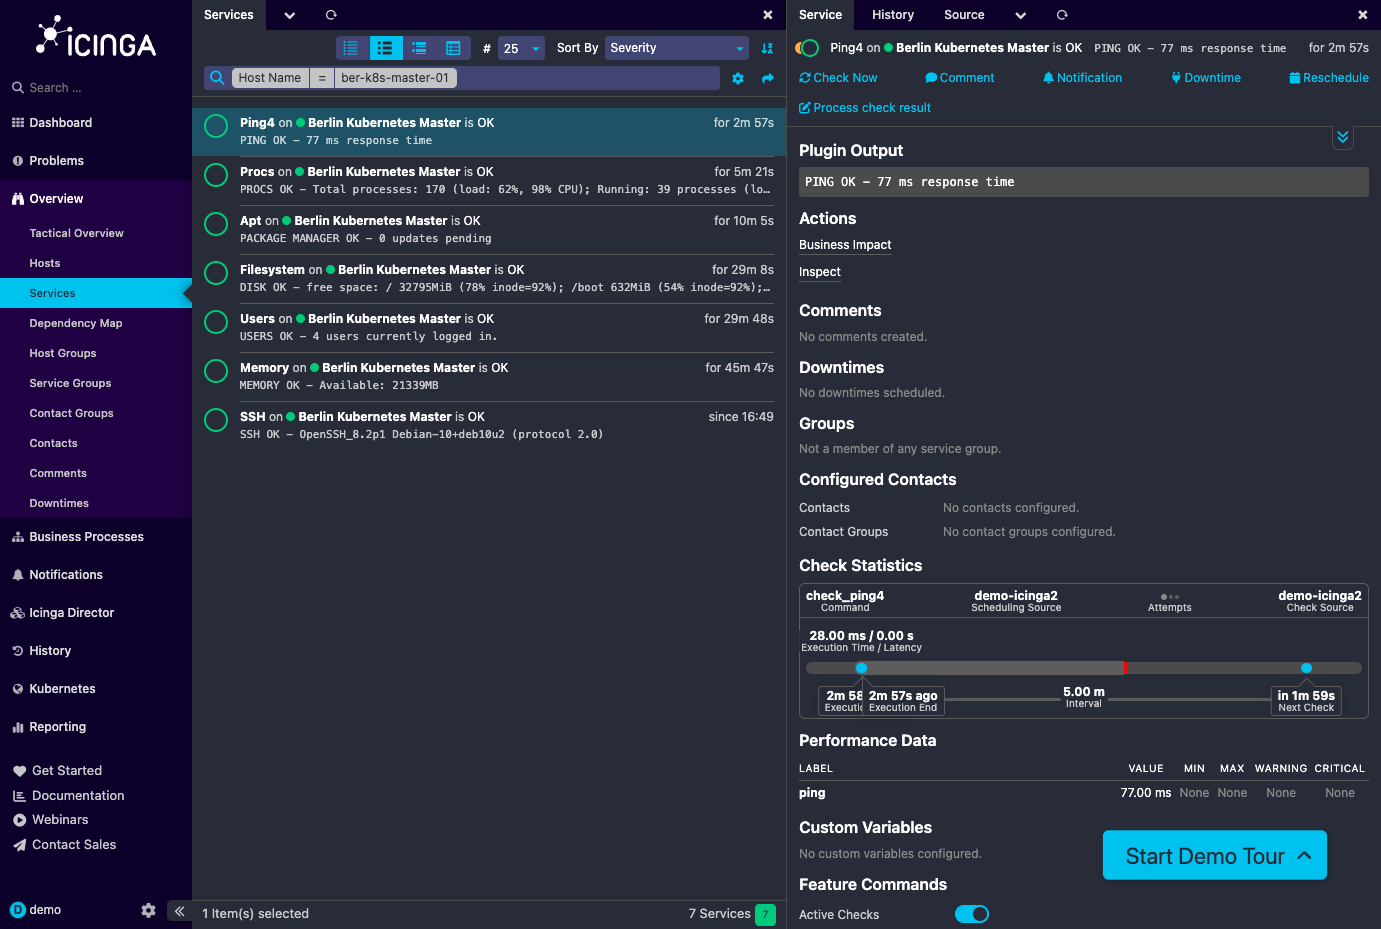
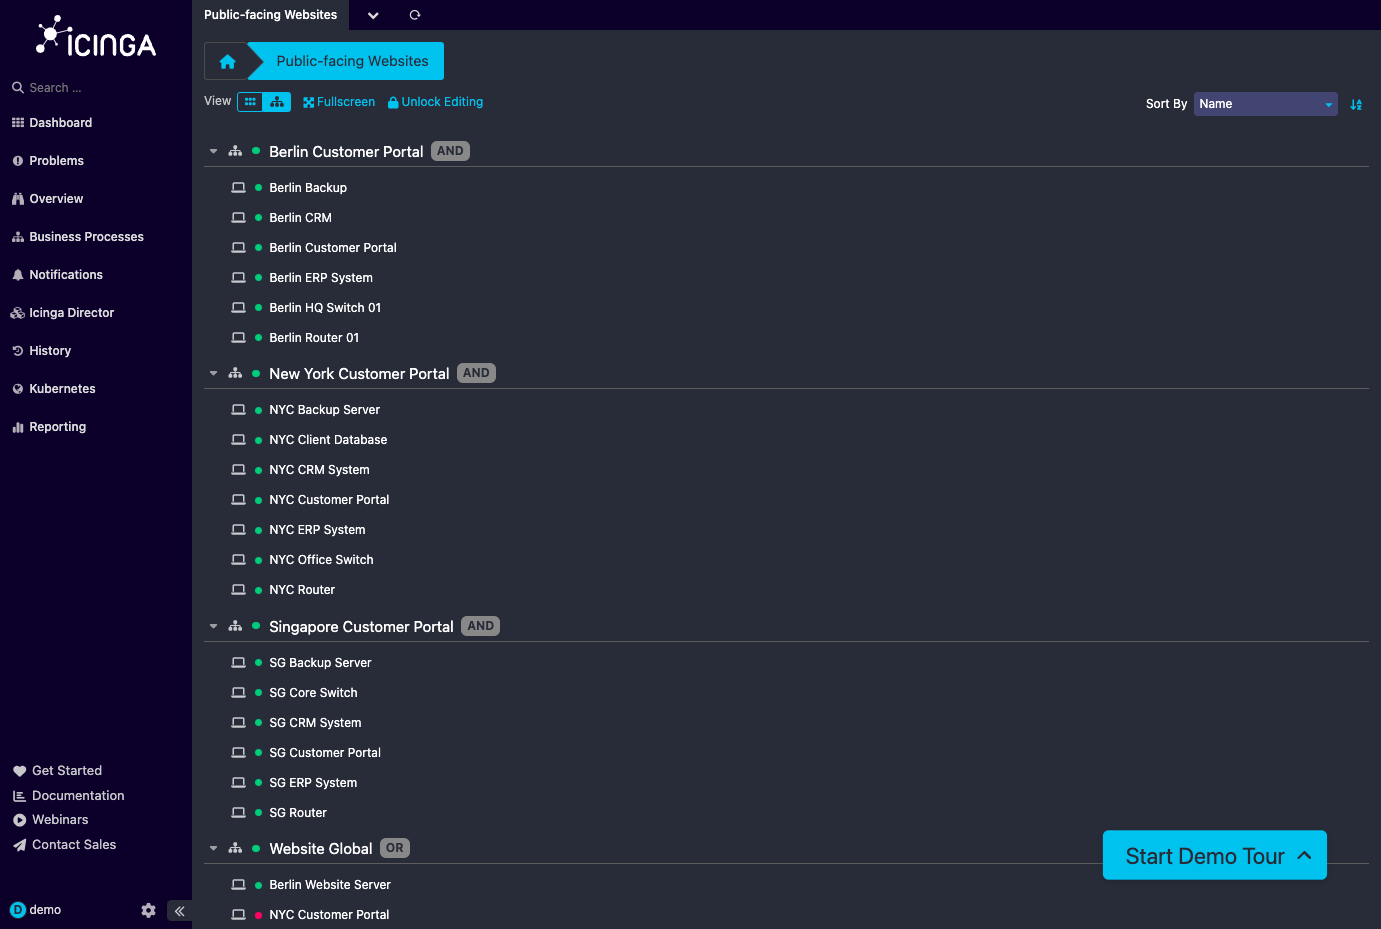
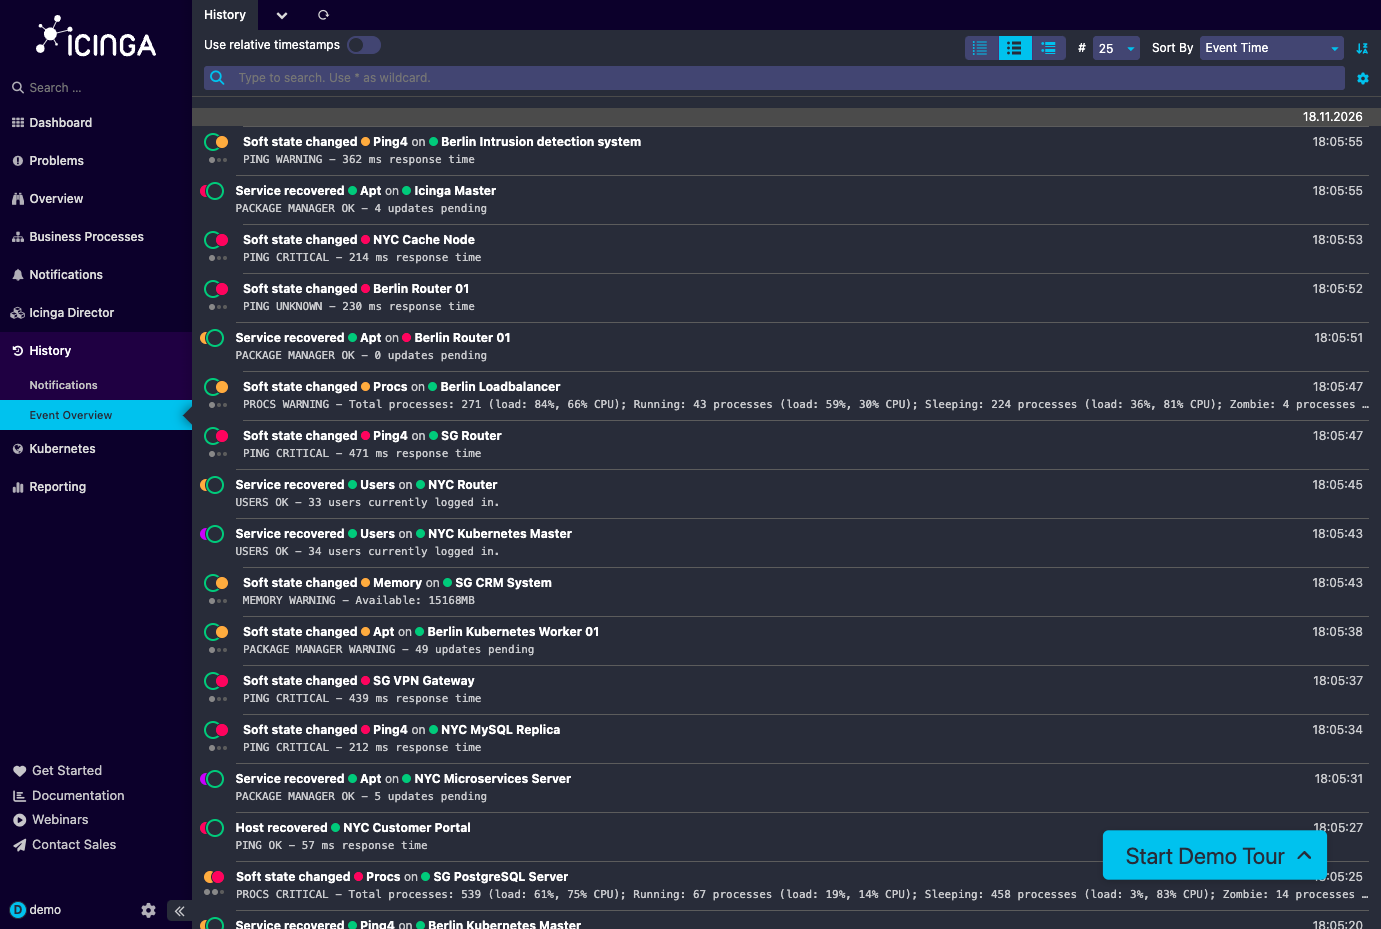
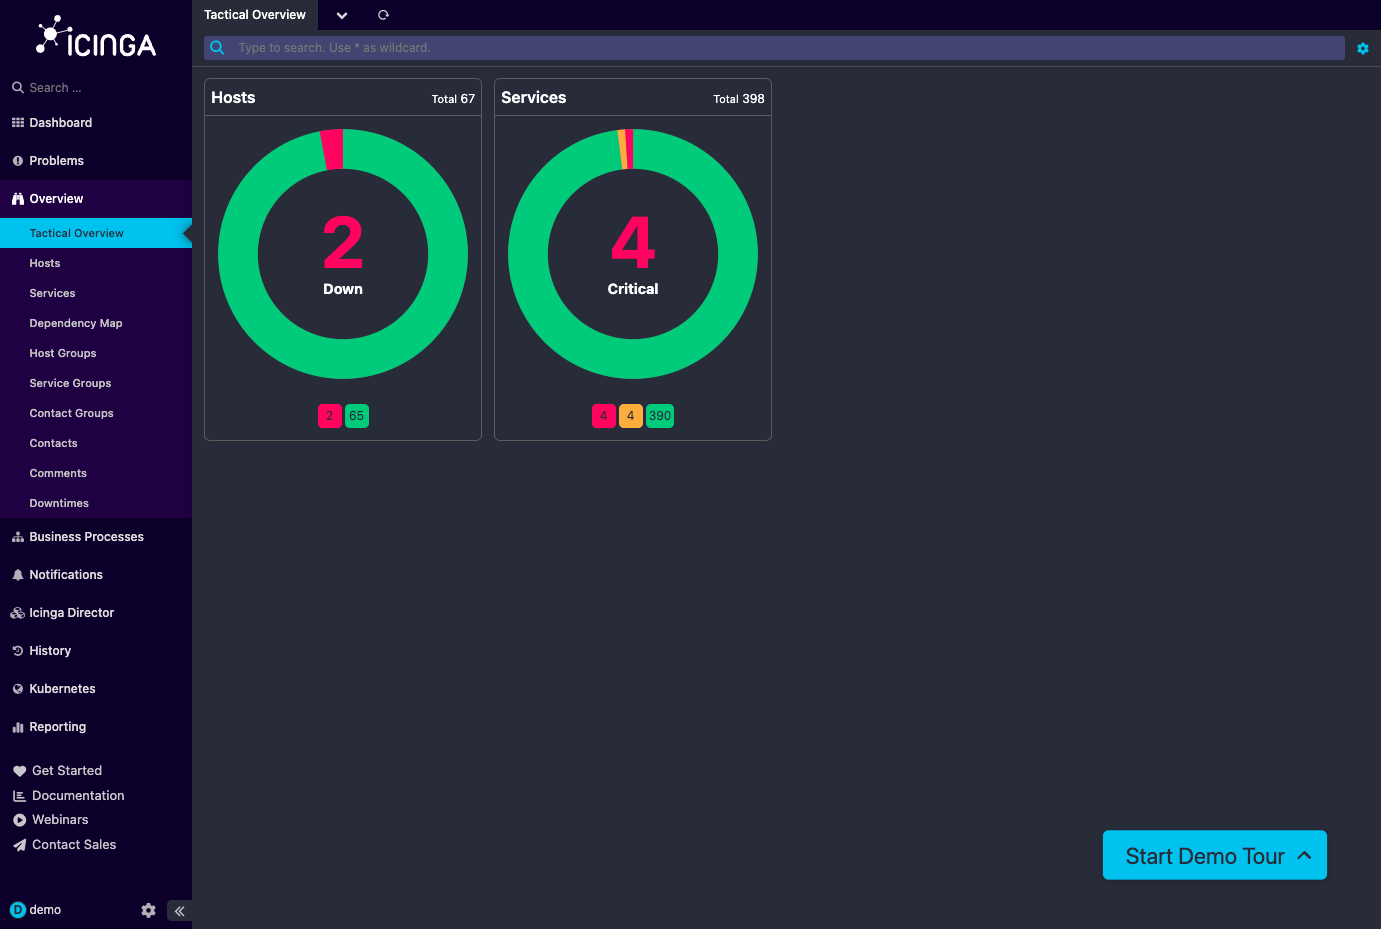
Icinga Web 2 is the browser interface for Icinga monitoring, giving operations teams one place to see which hosts and services are failing, how long they have been down, and what to fix first. Service problems, host problems, and summary tiles share a single dashboard page, and any filtered view can be added to a dashboard or the menu. Host and service lists switch between minimal, common, detailed, and table layouts, sort by severity, and filter through a search bar that autocompletes and accepts wildcards. A click on a service opens details beside the list, with plugin output, check statistics, performance data, comments, downtimes, and custom variables, plus buttons for Check Now, Comment, Downtime, and Reschedule. Modal dialogs keep acknowledgements and scheduled downtimes in context, and bulk operations act on a whole filtered list. The Tactical Overview condenses host and service states into two donut charts, and the Event Overview lists state changes and recoveries with their check output. Modules add Business Processes that group hosts and services into AND and OR trees, plus Cube, Director, Reporting, Notifications, and Kubernetes views. Roles combine permissions, refusals, and restrictions so each team sees only its own hosts, and logins run through Active Directory, LDAP, a database, or the web server. Language, time zone, and light or dark mode are set per user. Running on a dedicated VPS on RepoCloud with guaranteed CPU, RAM, and SSD, full root SSH access, and a browser serial console. GPL-3.0 licensed.
Benefits
- See Problems At A Glance
- Service Problems, Host Problems, and summary tiles share one dashboard, and the Tactical Overview totals hosts and services in donut charts, so the first look at the screen shows what needs attention.
- Respond From The Detail View
- Detail panes show plugin output, check statistics, and performance data beside one-click Check Now, Comment, Downtime, and Reschedule buttons, and modal dialogs keep the list in view during acknowledgements.
- Give Each Team Its Own View
- Roles bundle permissions, refusals, and filter restrictions, so a team sees only its own hosts and services, and logins run through Active Directory, LDAP, a database, or the web server.
- Extend It With Modules
- Business Processes, Cube, Director, Reporting, Notifications, and Kubernetes views plug in as modules, enabled in the interface or with icingacli, and teams can write their own.
Features
- Flexible List Layouts
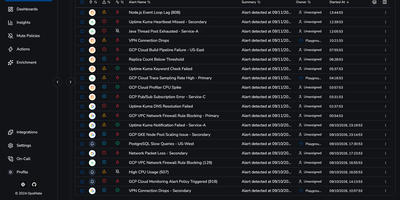
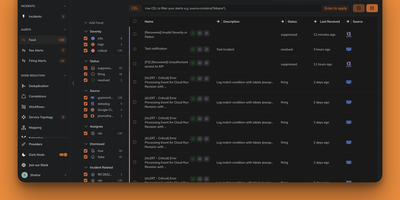
- Host and service lists offer minimal, common, detailed, and table layouts, severity sorting, and a search bar with wildcard filters, autocompletion, and a filter editor for complex queries.
- Service And Host Details
- Detail panes open beside the list and show plugin output, actions, comments, downtimes, groups, contacts, check statistics, performance data, custom variables, and feature command toggles.
- Business Process Trees
- The Business Processes module models AND and OR trees of hosts and services and shows each process as a dashboard tile or a tree with its state colour.
- Roles And Authentication
- Permissions, refusals, restrictions, and role inheritance control access, and users sign in through Active Directory, LDAP, MariaDB, MySQL, PostgreSQL, or the web server, chained as fallbacks.
- Event History
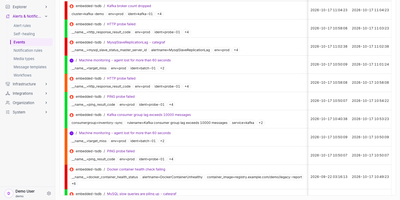
- History lists state changes, recoveries, and soft state changes with plugin output, a relative or absolute timestamp switch, and the same filter bar as the other views.
- Command Line And Exports
- The icingacli tool handles setup and module commands, and list views export as CSV or JSON through the format URL parameter, with SQL output available for manual analysis.