SaaS Alternative
Datadog Nagios XI PRTG Network Monitor SolarWinds Network Performance Monitor ManageEngine OpManagerCategories
Network Monitoring Server Monitoring Infrastructure Monitoring Alerting and Notifications Dashboards and Maps Prometheus Integration Event CorrelationStars
Forks
Watchers
Developer links
openITCOCKPIT
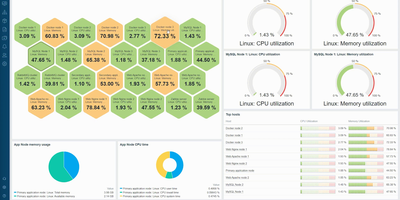
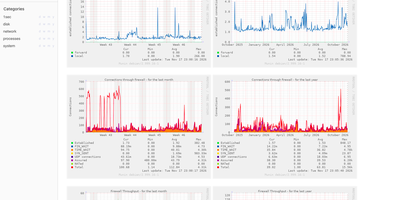
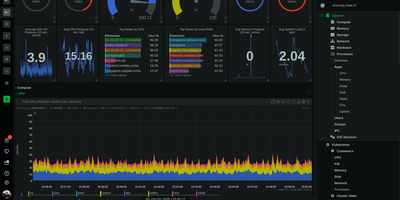
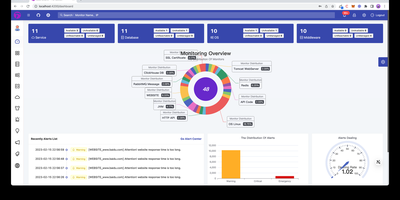
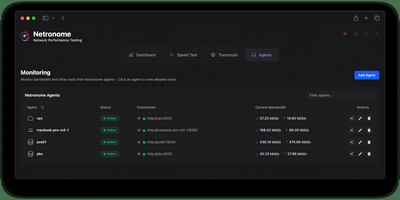
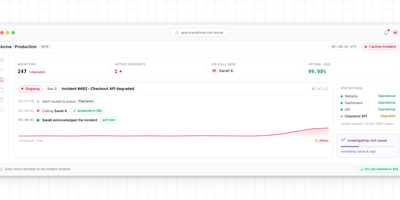
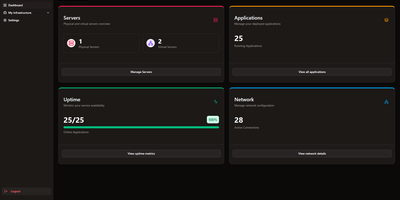
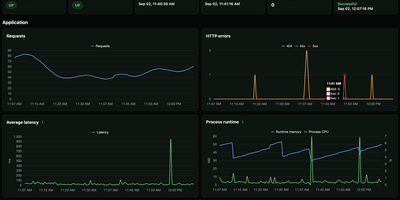
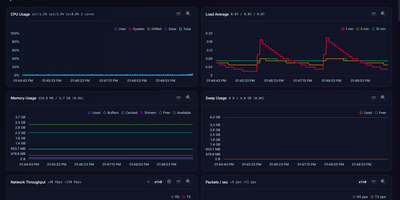
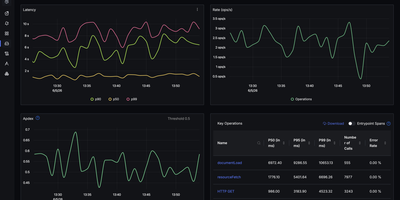
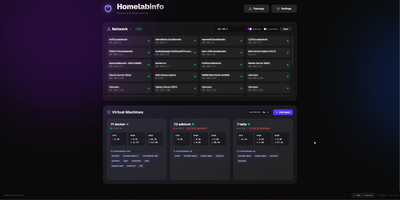
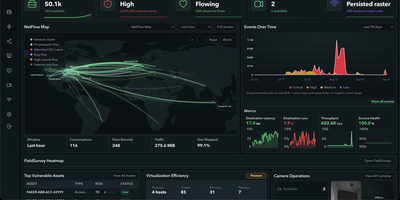
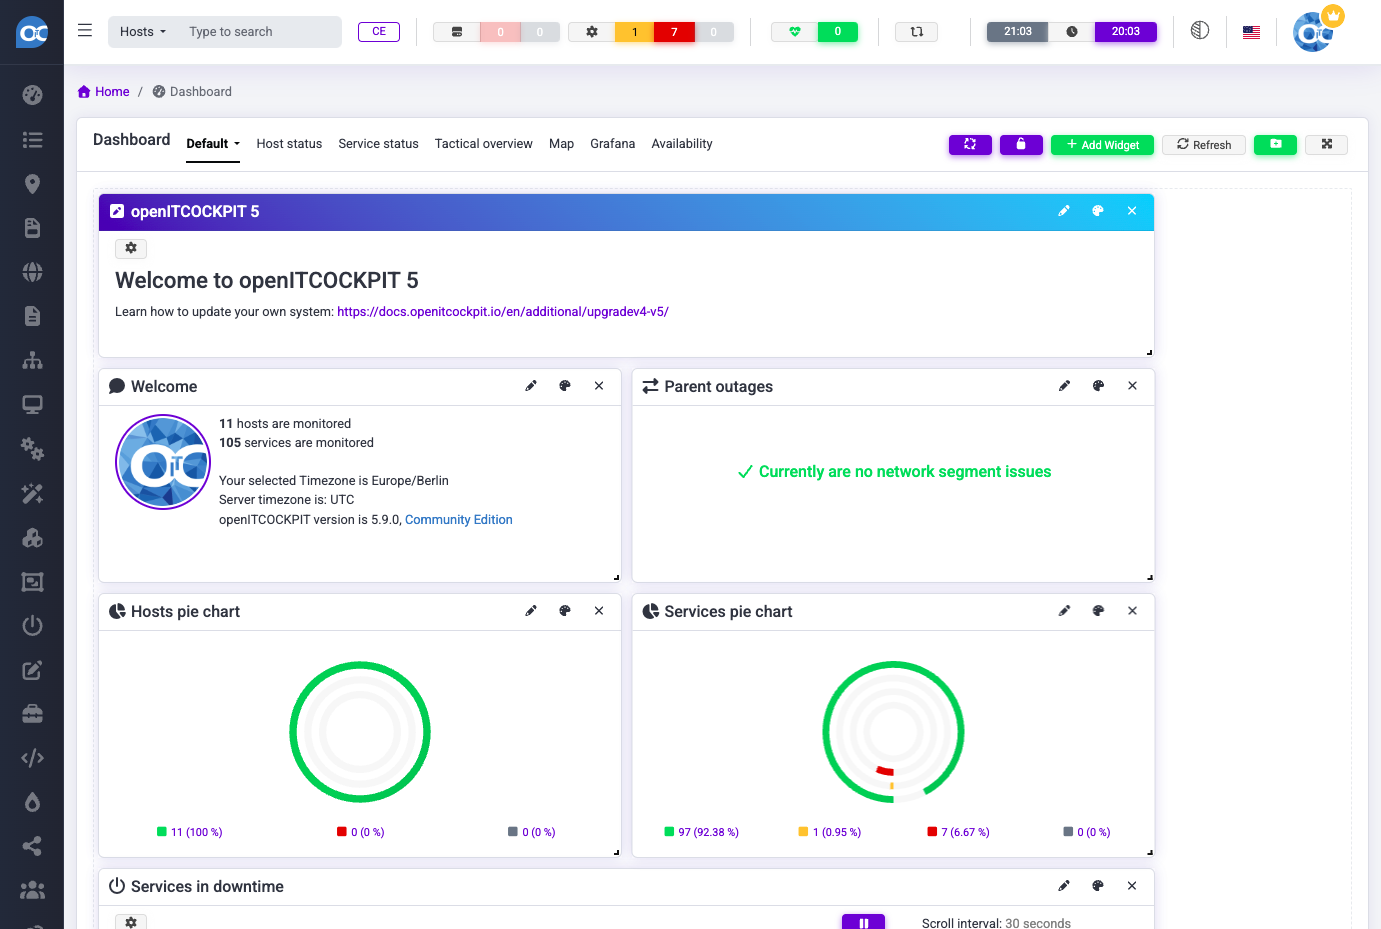
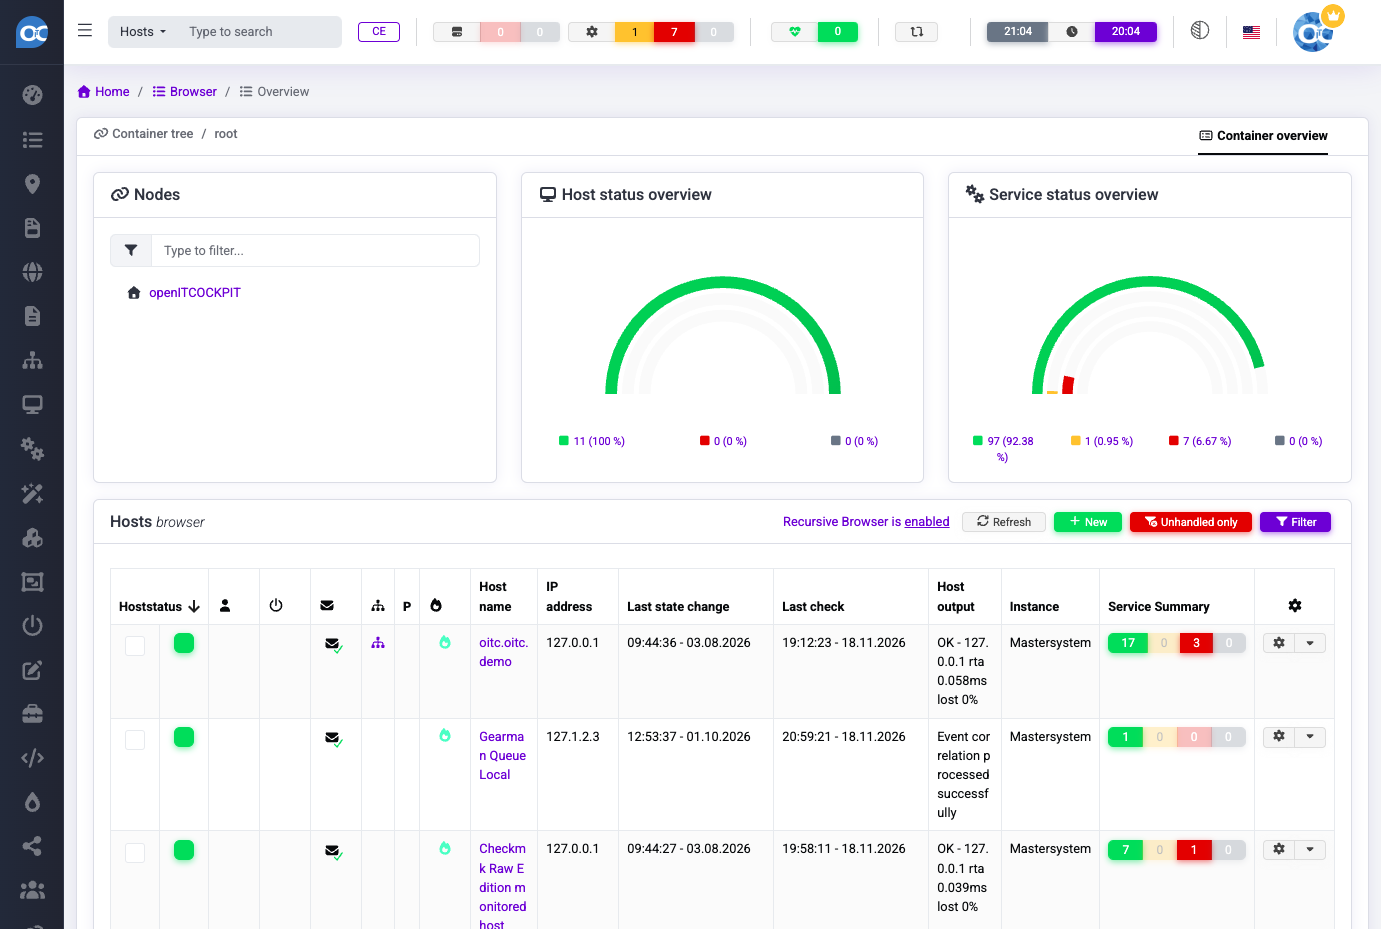
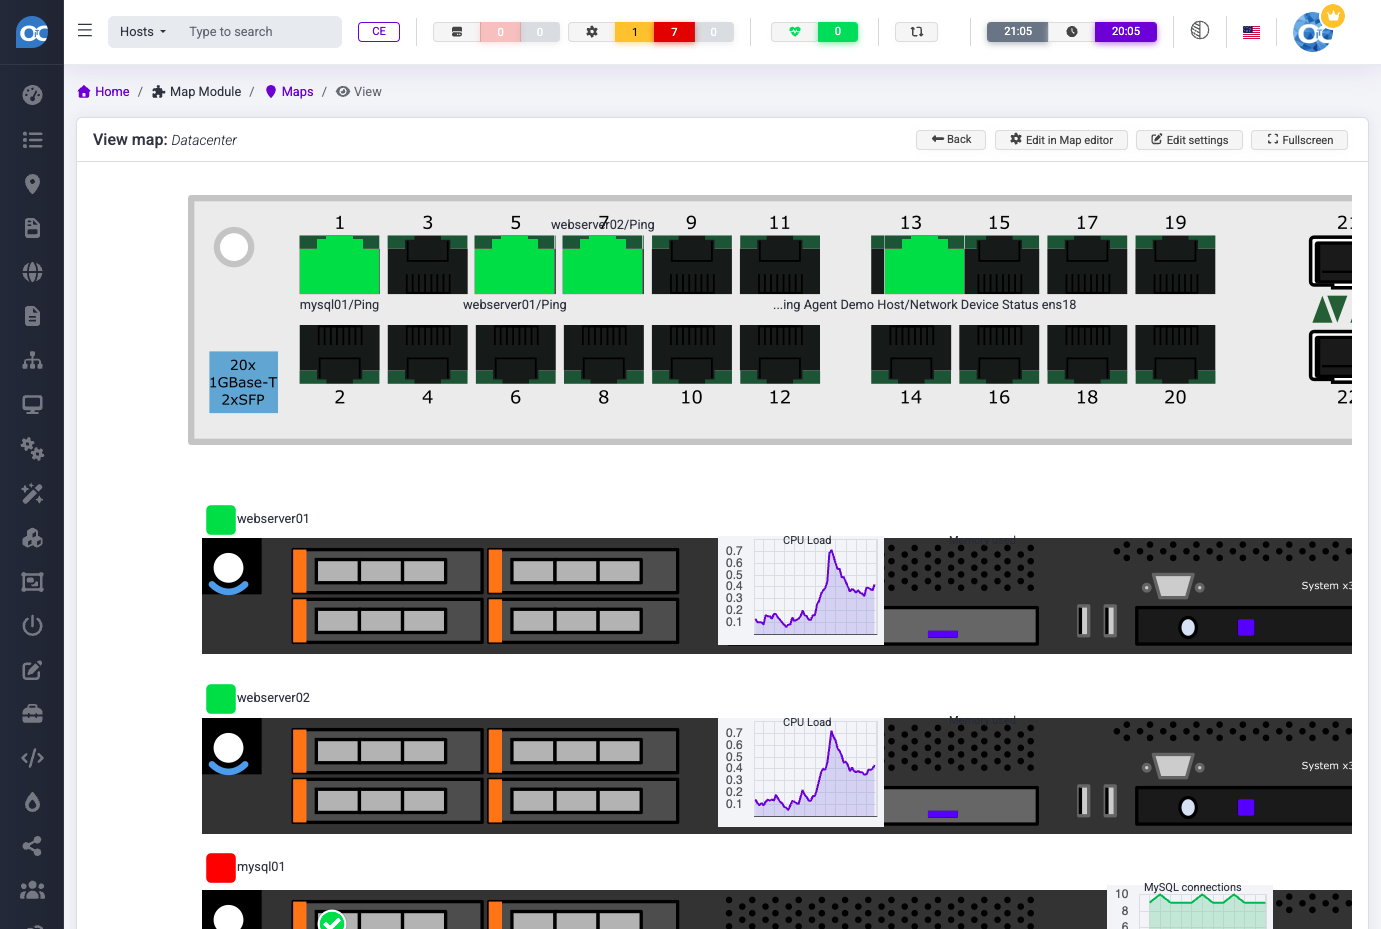
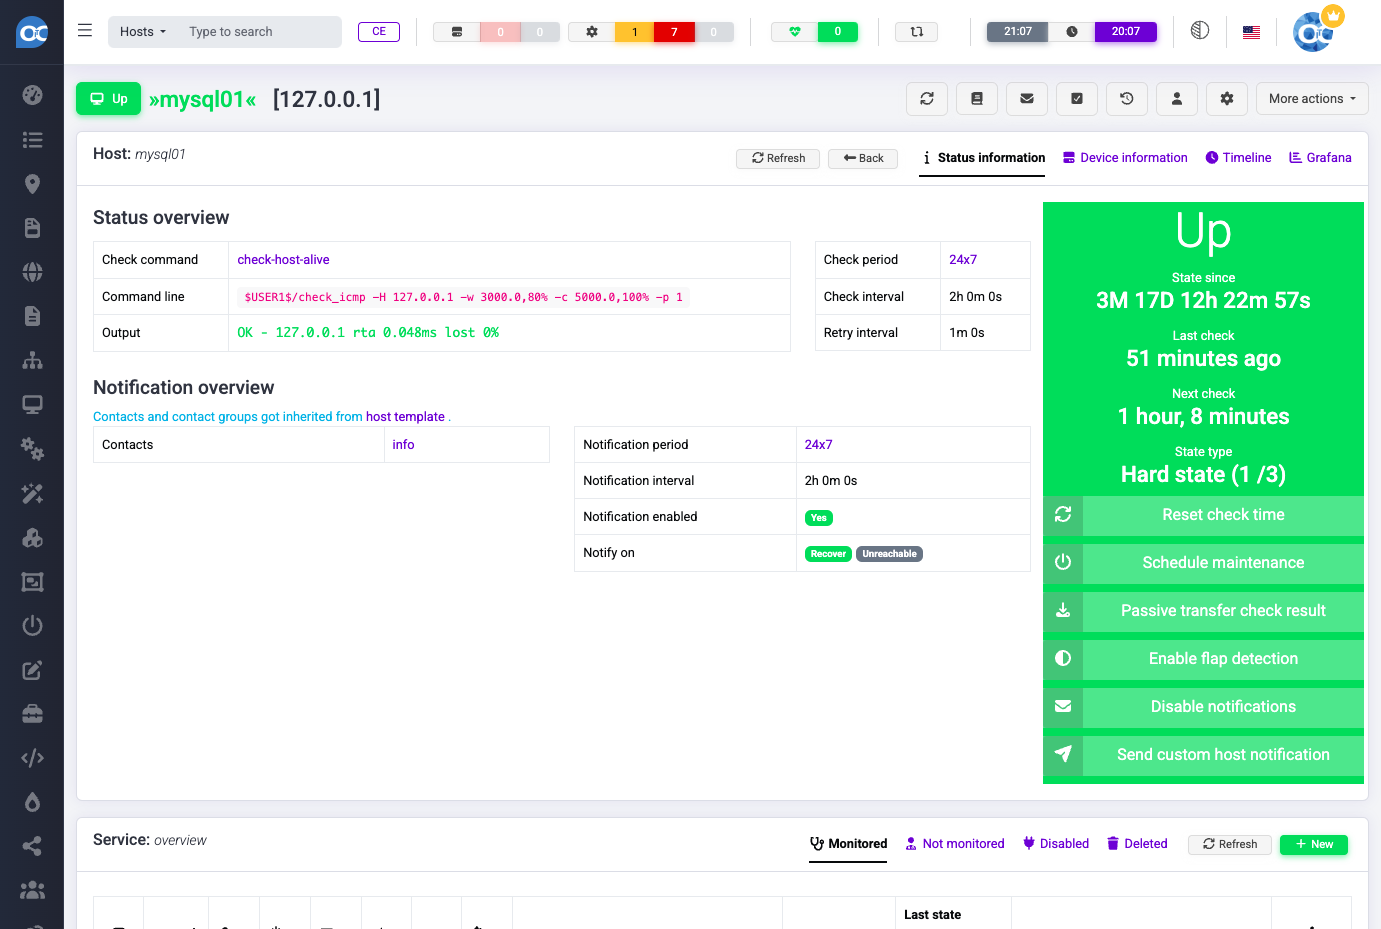
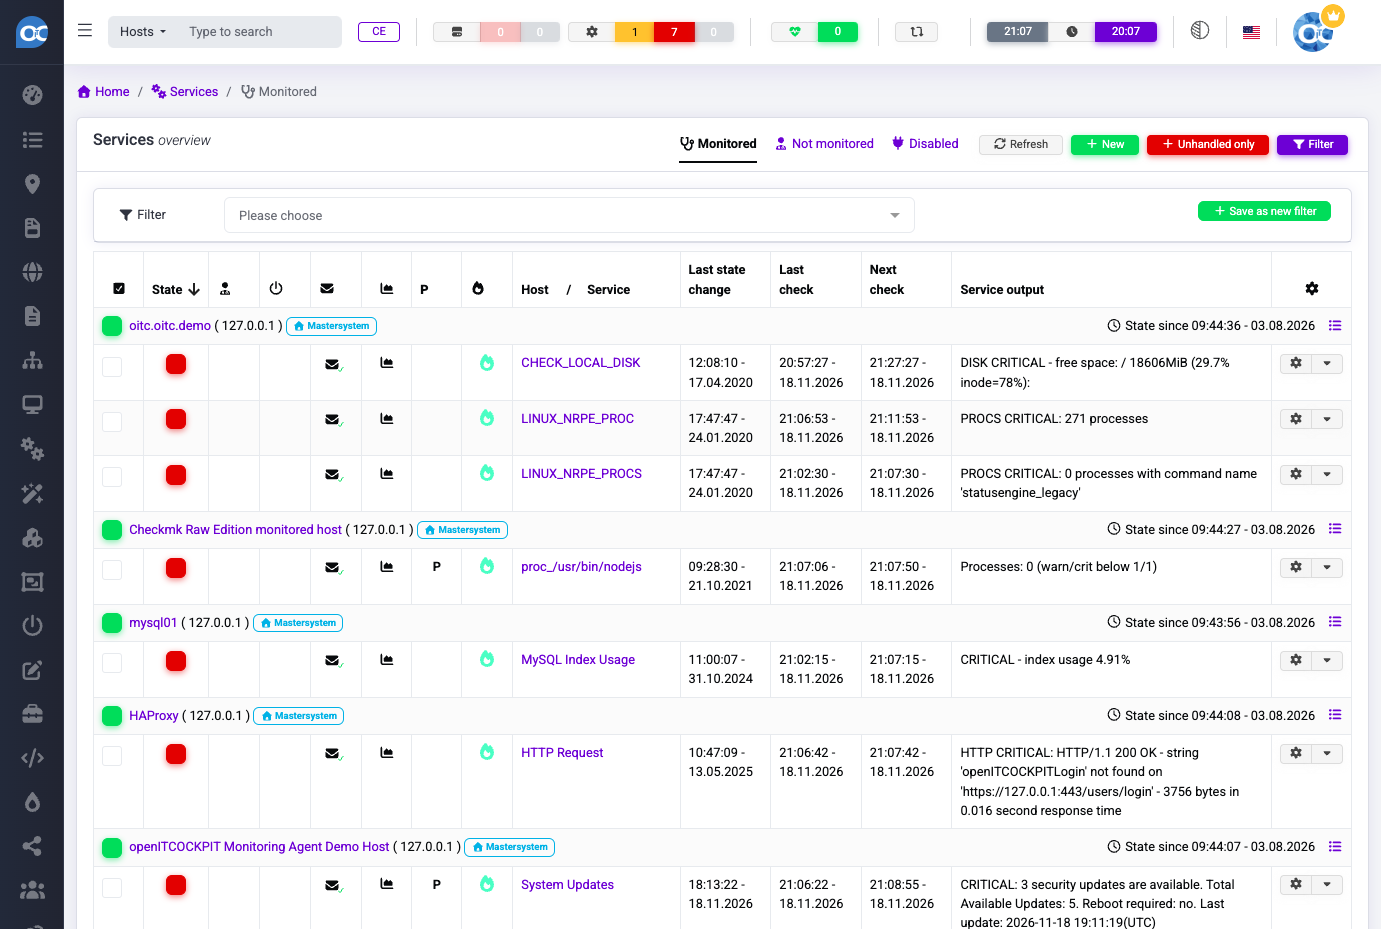
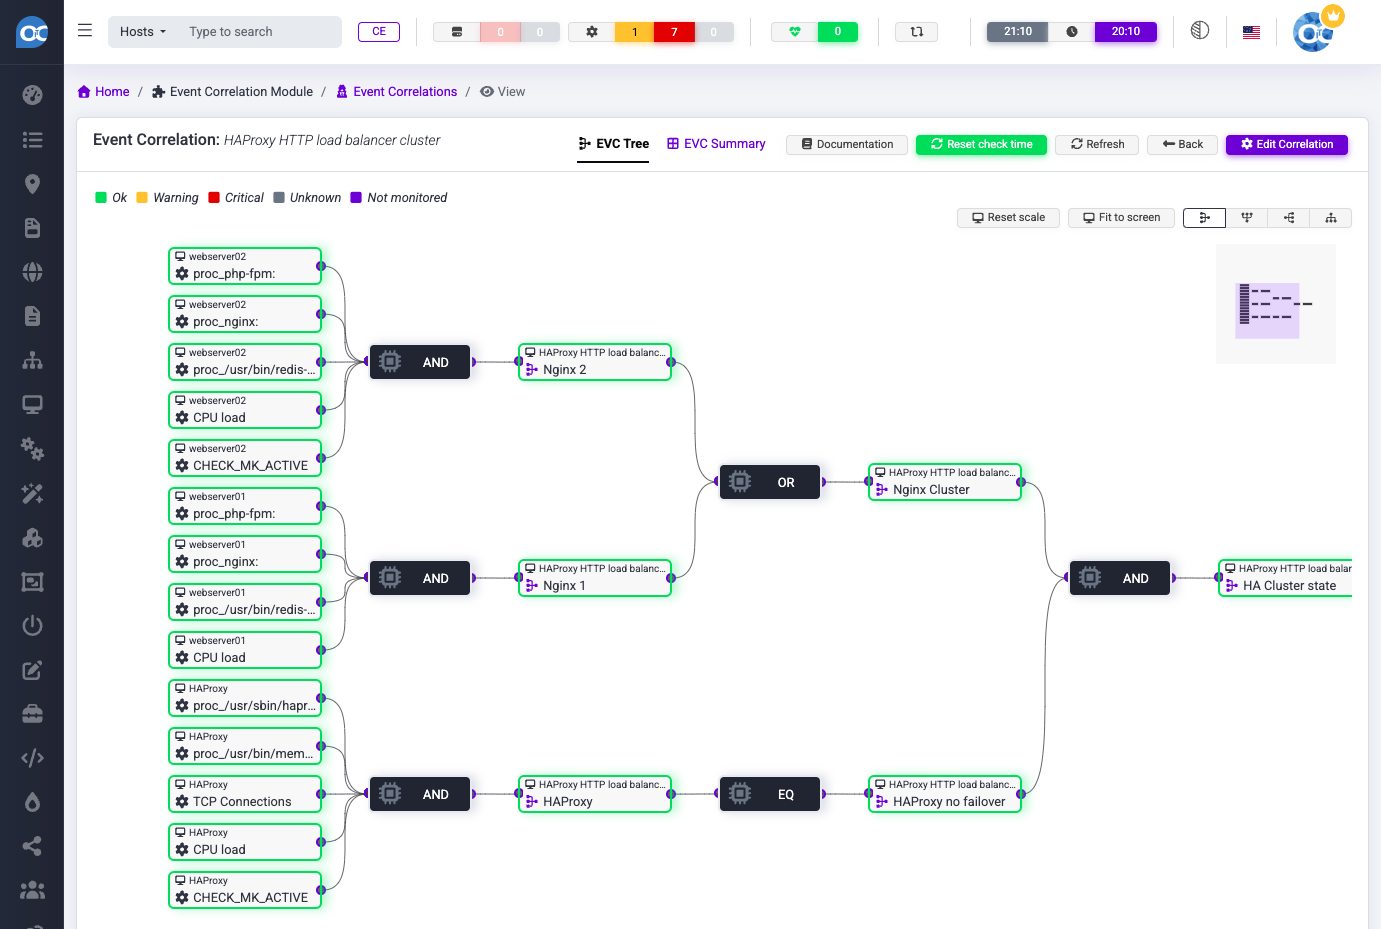
Point a browser at openITCOCKPIT, and templates and wizards create the monitoring checks that watch servers, network devices, containers, and applications. Wizards for Linux, Windows, macOS, MySQL, and network gear create hosts and services. A JSON API exposes the same configuration to scripts. A single-binary agent for Linux, macOS, and Windows reports CPU, memory, disks, services, processes, temperatures, and Docker containers over encrypted pull or push connections. Prometheus exporters, alert rules, and PromQL metrics sit beside classic Naemon checks and feed the same reports. Teams share dashboards with traffic lights, tachometers, and tables and show them on big screens, and Grafana boards are generated for every host. A WYSIWYG map editor places hosts, gauges, and charts on uploaded backgrounds like site plans or server racks, and a status map draws parent-child links automatically. Event correlation joins checks with logical operators into business services, so one cluster state replaces a flood of single alerts. Instant, downtime, and scheduled auto reports summarize availability, and a timeline records state changes, downtimes, and notifications. Alerts reach people by email, Mattermost, Pushover, or Telegram and can be acknowledged from the chat, and recurring downtimes silence planned maintenance. Multi-tenancy, role-based permissions, LDAP or Active Directory login, and single sign-on scope what each team sees. Running on a dedicated VPS on RepoCloud with guaranteed CPU, RAM, and SSD, full root SSH access, and a browser serial console. GPL-3.0 licensed.
Benefits
- Configure Monitoring From the Browser
- Host templates, service templates, and wizards create checks, contacts, and notification rules in a few clicks, and the JSON API lets scripts and other tools manage the same objects.
- Combine Checks and Prometheus Metrics
- Prometheus exporters, alert rules, and PromQL queries run beside Nagios-compatible plugins, so one server alerts, graphs, and reports on traditional servers, network devices, and metric-driven services alike.
- Share Live Status With Everyone
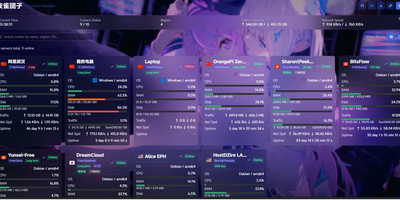
- Shared dashboards, per-host Grafana boards, and WYSIWYG maps with uploaded backgrounds turn monitoring data into big-screen views that operators and managers can read at a glance.
- Cut Alert Noise With Logic
- Event correlation combines checks with logical operators into business services, and recurring downtimes plus email, Mattermost, Pushover, and Telegram notifications route the remaining alerts to the right people.
Features
- Template-Based Configuration
- Host templates, service templates, and wizards for Linux, Windows, macOS, MySQL, and network devices generate Naemon check configuration, so new hosts need only a few clicks.
- Cross-Platform Monitoring Agent
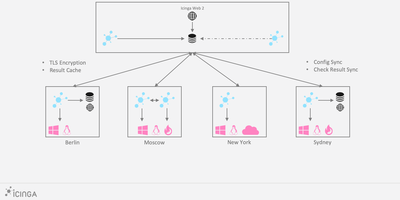
- The single-binary agent installs from DEB, RPM, PKG, or MSI packages, secures traffic with TLS in pull or push mode, and stays compatible with the Nagios plugin API.
- Prometheus Integration
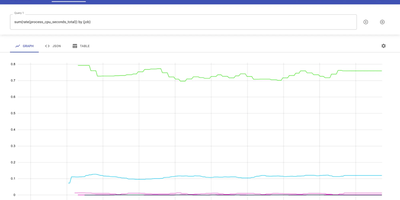
- Manage exporters, create alert rules, and build services from Prometheus metrics in a graphical interface, then mix them with classic checks in the same reports.
- Dashboards and Grafana
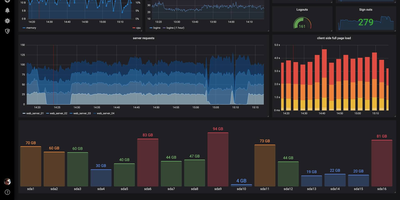
- Tabbed, shareable dashboards offer traffic lights, tachometers, tiles, and tables, and a Grafana dashboard is generated automatically for every host.
- Maps and Status Pages
- The WYSIWYG map editor places hosts, gauges, and charts on uploaded backgrounds, an automatic status map shows parent-child links, and status pages can be published.
- Event Correlation and Reports
- Logical operators merge checks into business services, and instant, downtime, current-state, and auto reports plus a timeline document availability and history.