Stars
Forks
Watchers
Developer links
NUT WebGUI
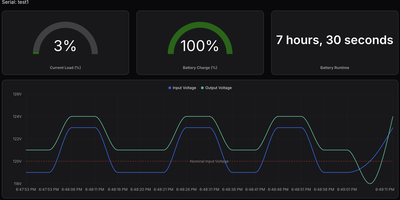
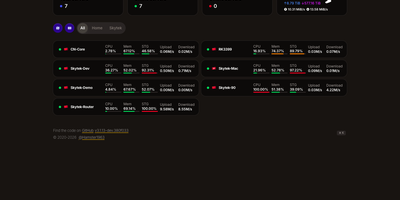
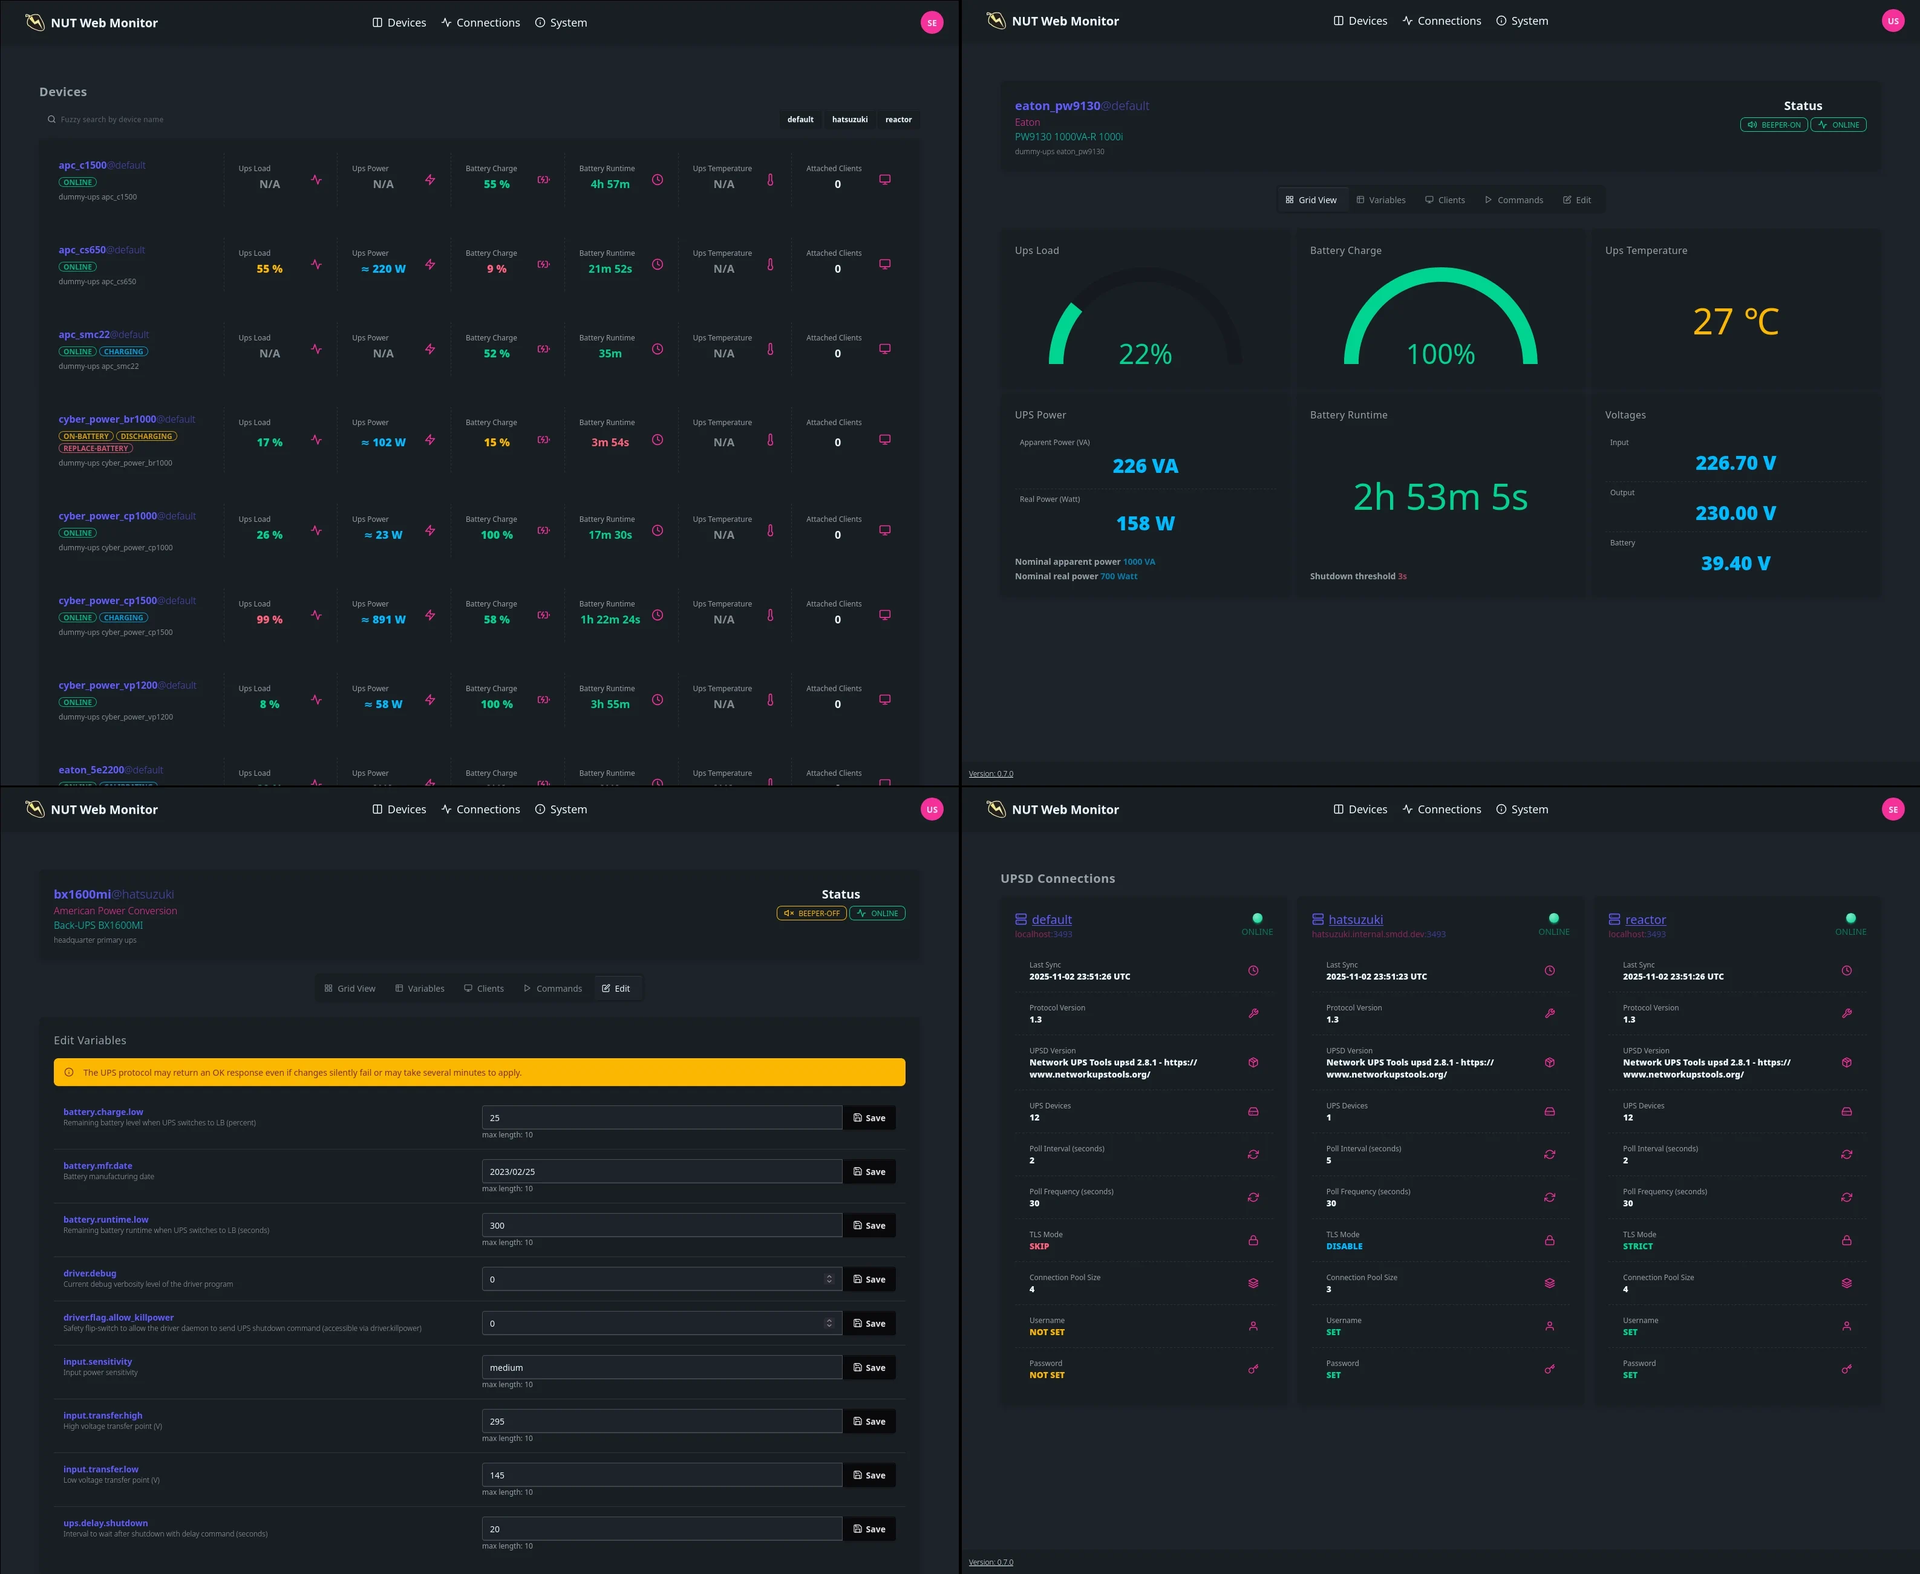
When the power blinks at 3 a.m., NUT WebGUI is the page that tells you whether the UPS in the closet is coasting or dying, without a serial cable in sight. Point it at one or several Network UPS Tools servers and it polls charge, load, input voltage, and estimated runtime, refreshing critical status every couple of seconds while background variables update on a calmer thirty-second cadence. The dashboard renders device cards, gauges, sparklines, and a topology view of how units chain together, and it stays readable on a phone when you are standing in front of a humming rack. Authorized users can issue instant commands, set variables, or trigger a forced shutdown from the browser, while everyone else gets a strictly read-only view. A JSON API under /api serves device lists, variables, and instant commands to your own scripts, health and readiness probes fit container orchestrators, and OpenMetrics output feeds Prometheus without extra exporters. The whole thing is a single small binary that runs happily on a Raspberry Pi, an old ARM board, or a RISC-V box, reads one TOML file, and supports multi-user sign-in with scoped API keys when you share it with a team. Running on a dedicated VPS on RepoCloud with guaranteed CPU, RAM, and SSD, full root SSH access, and a browser serial console. Apache-2.0 licensed.
Benefits
- Every UPS On One Page
- Multiple NUT servers roll into a single auto-refreshing dashboard with per-device gauges and sparklines, so a rack of mixed units reads at a glance instead of five separate status tools.
- Act Before Batteries Die
- Critical variables poll every two seconds, and authorized users can run instant commands, adjust variables, or force a shutdown from the browser while there is still charge to spare.
- APIs For The Rest
- A JSON device API, WebSocket event stream, health probes, and OpenMetrics endpoints let Prometheus, uptime checkers, and your own scripts consume UPS data without scraping HTML.
- Runs On A Potato
- The single Rust binary sips memory and disk, ships images for ARM and RISC-V, and reads one TOML file, so the spare board taped inside the rack becomes the monitor.
Features
- Live UPS Variables
- Charge, load, voltages, and runtime poll from upsd (critical values every 2 seconds, the rest every 30) and render as gauges, cards, sparklines, and a topology graph.
- Instant Commands And FSD
- The GUI issues INSTCMD actions, SET VAR changes, and forced shutdowns against NUT devices when the configured upsd account carries administrative privileges; otherwise it stays read-only.
- Data And Events APIs
- Endpoints under /api expose devices, variables, and system information, while a WebSocket EventsAPI streams state changes and OpenMetrics output feeds Prometheus directly.
- Health And Readiness Probes
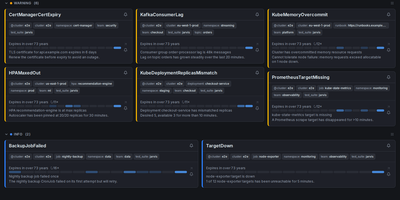
- /probes/health and /probes/readiness report READY, DEGRADED, or DEAD per server namespace, so Docker, Podman, and Kubernetes restart or reroute a sick monitor automatically.
- Users And API Keys
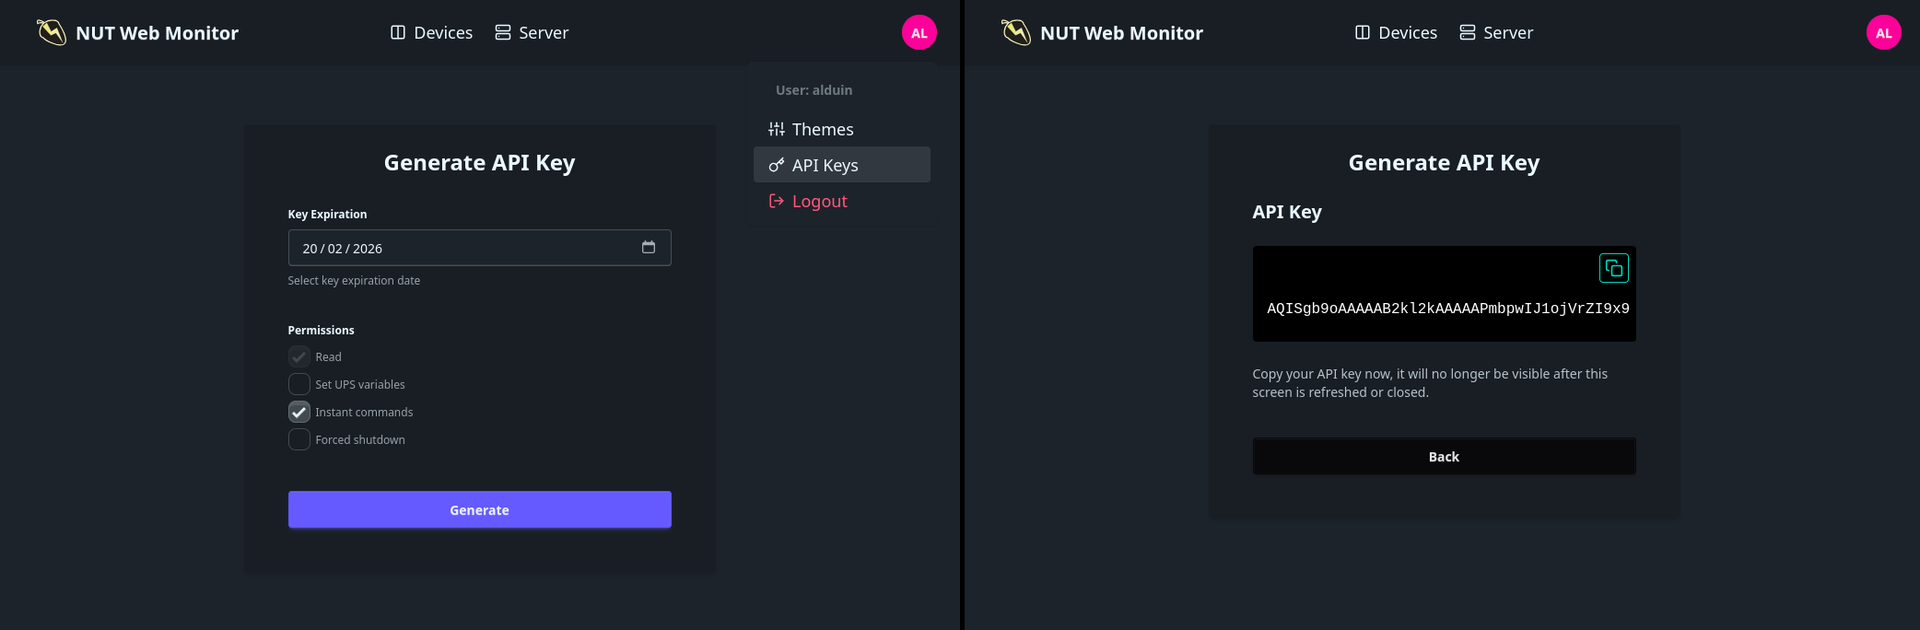
- Optional authentication enables per-user accounts and bearer API keys issued from the /api-keys page, each key capped at the permissions of whoever created it.