Categories
Self-Hosted Observability Alerting Network Monitoring Infrastructure Monitoring Security Analytics Network Topology NetFlow AnalyticsStars
Forks
Watchers
Developer links
ServiceRadar
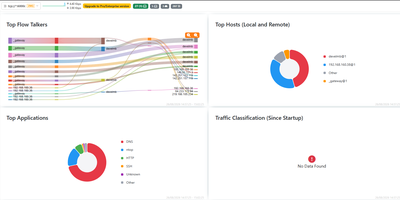
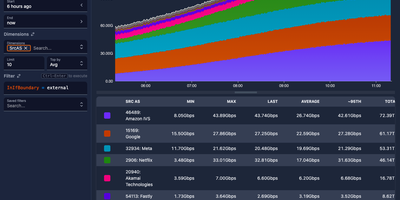
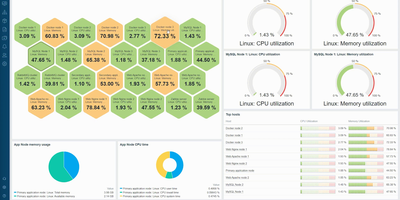
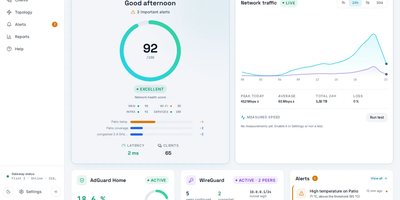
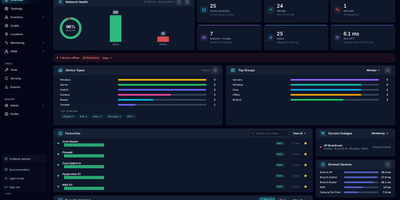
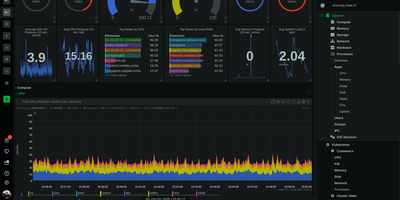
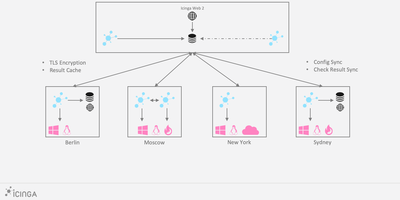
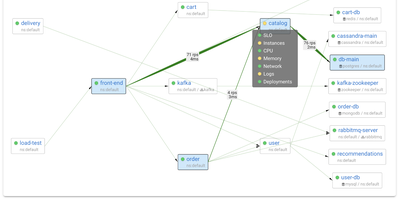
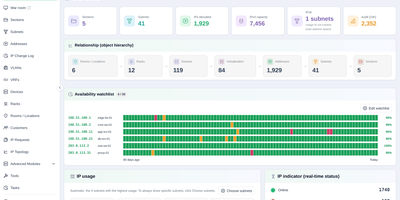
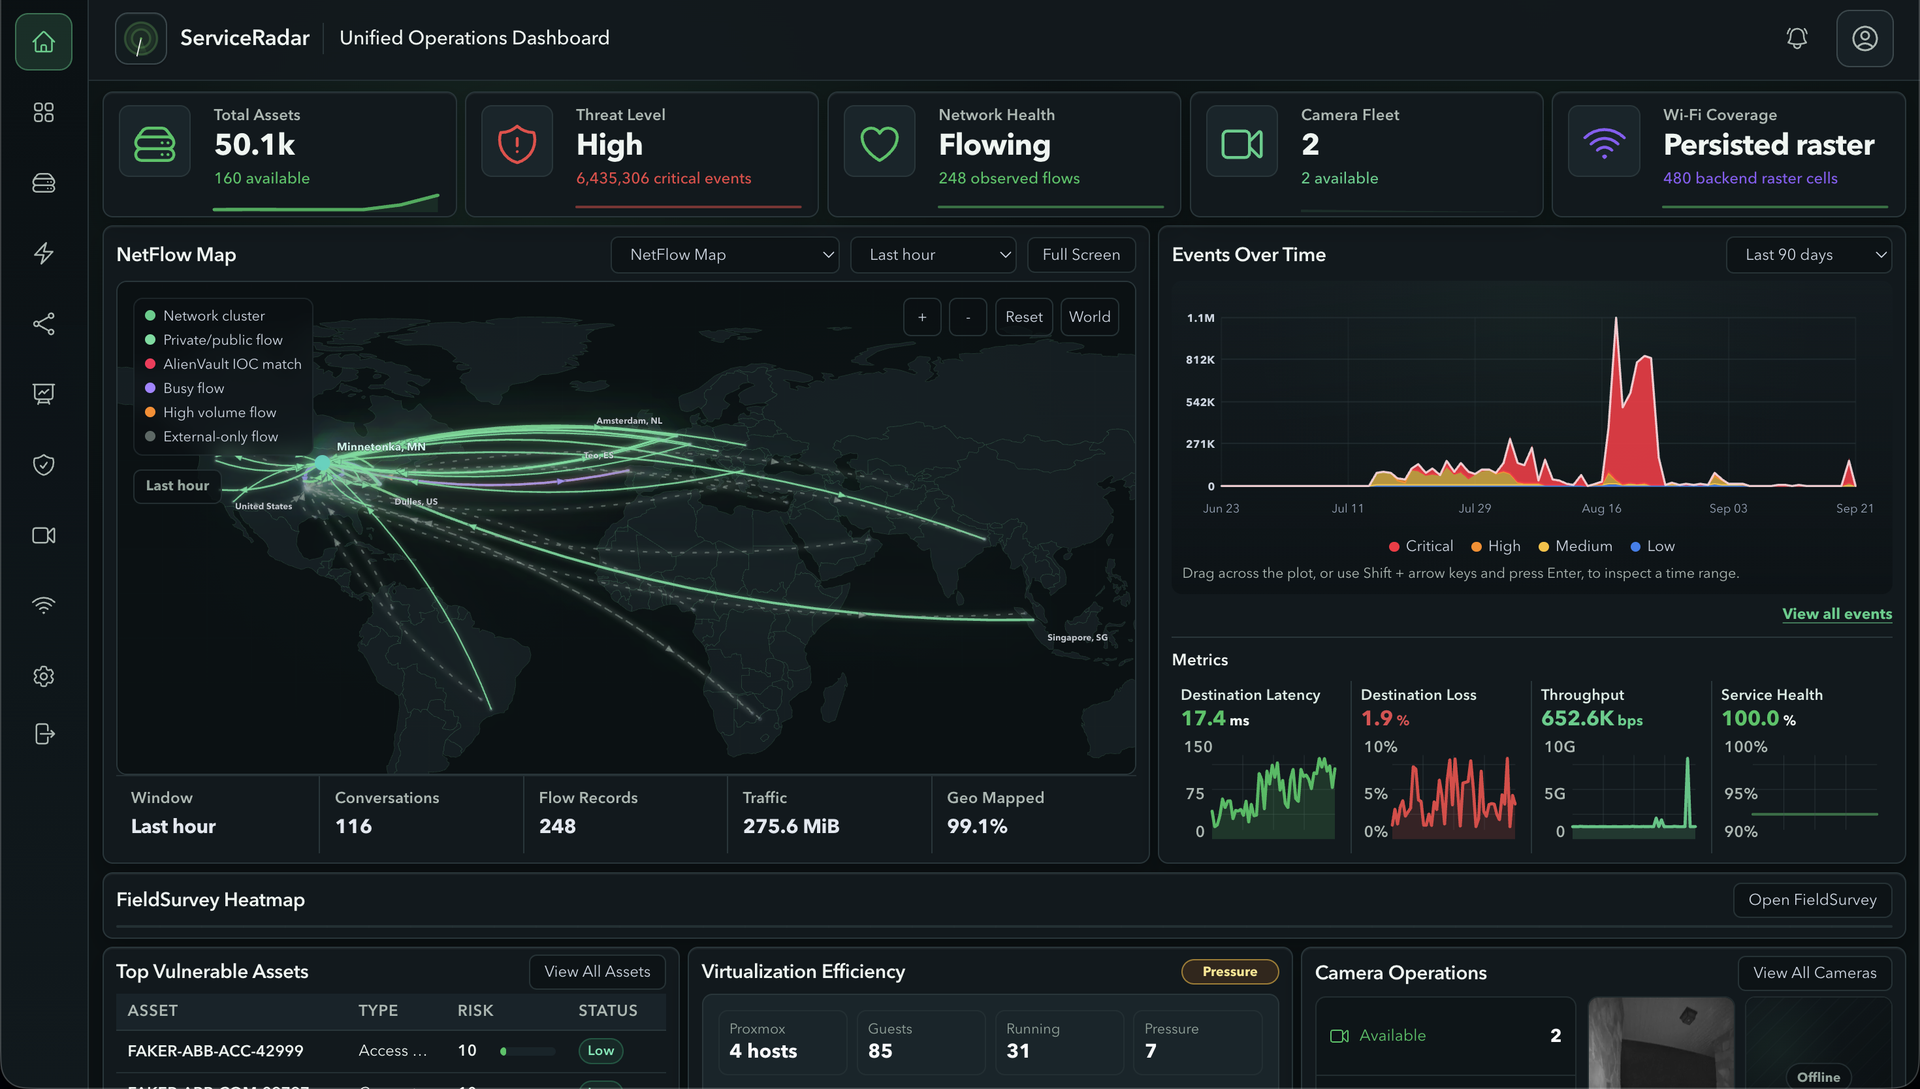
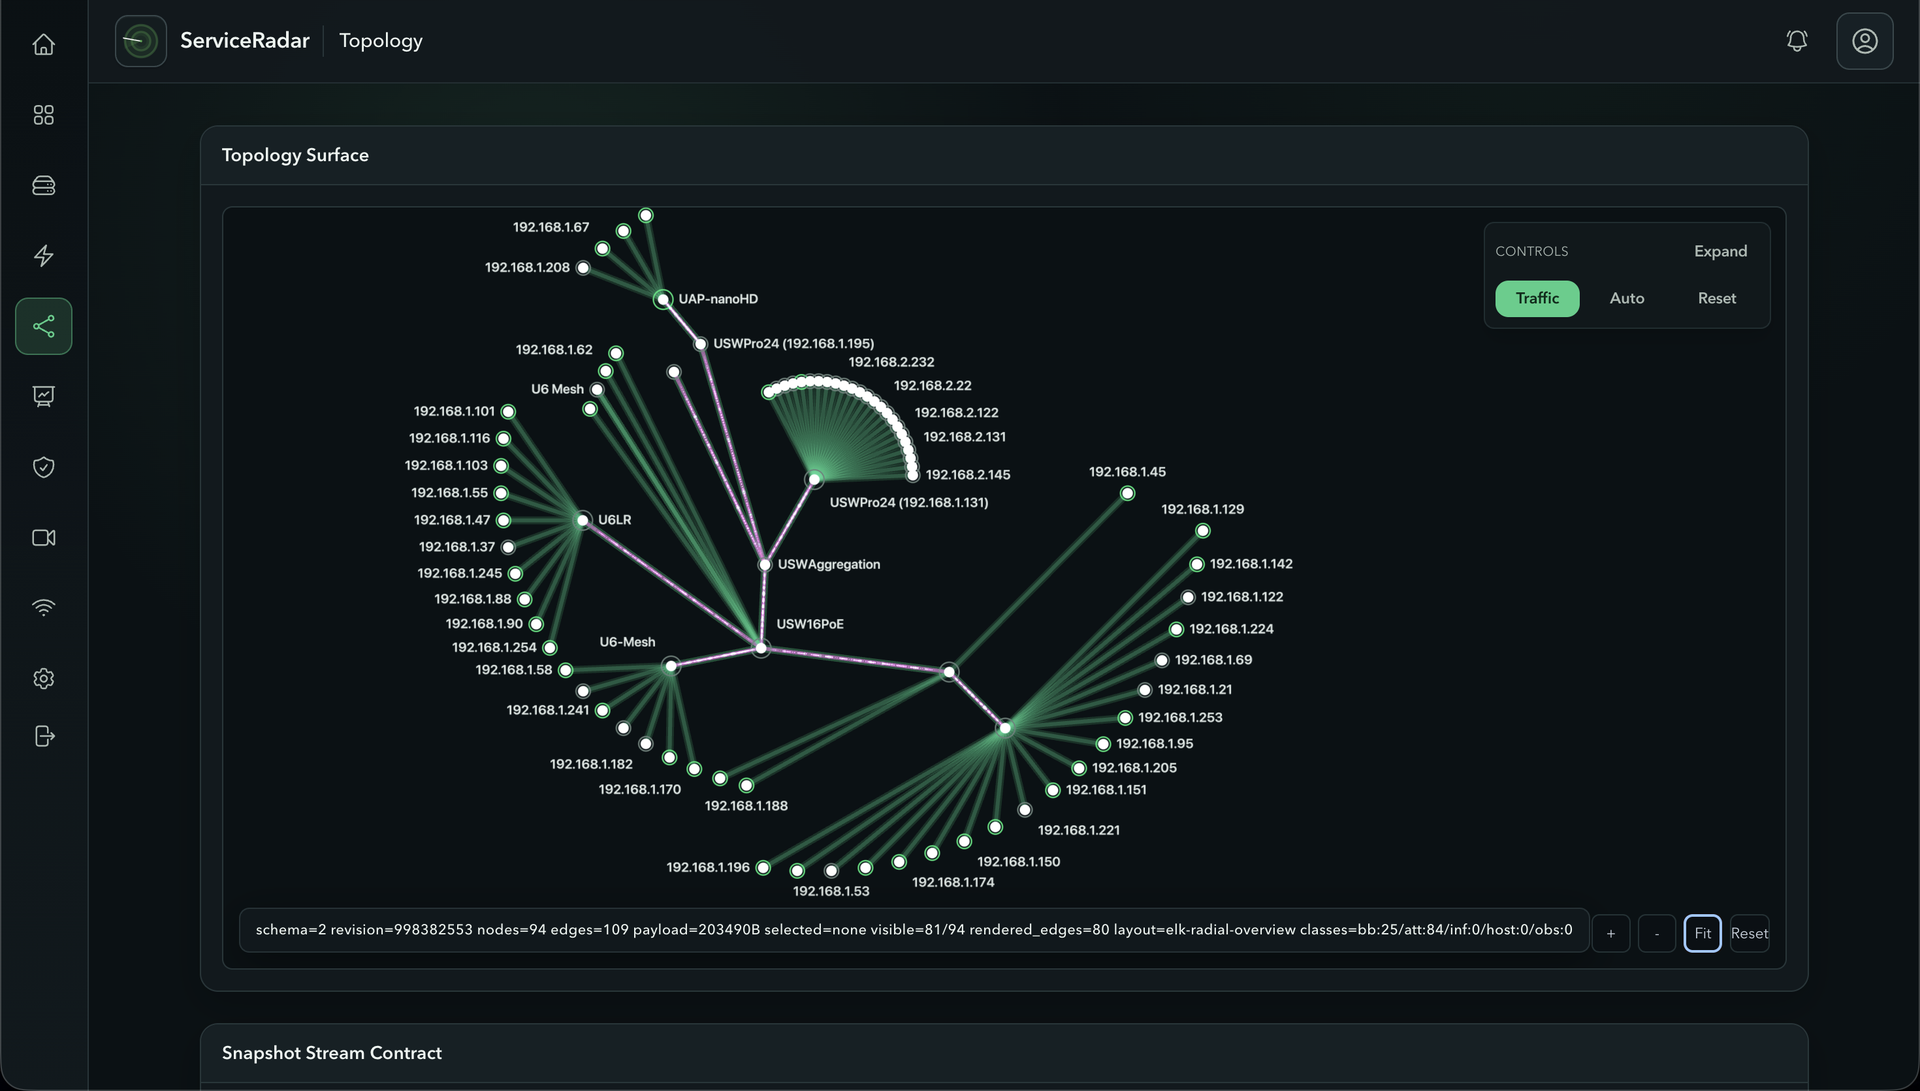
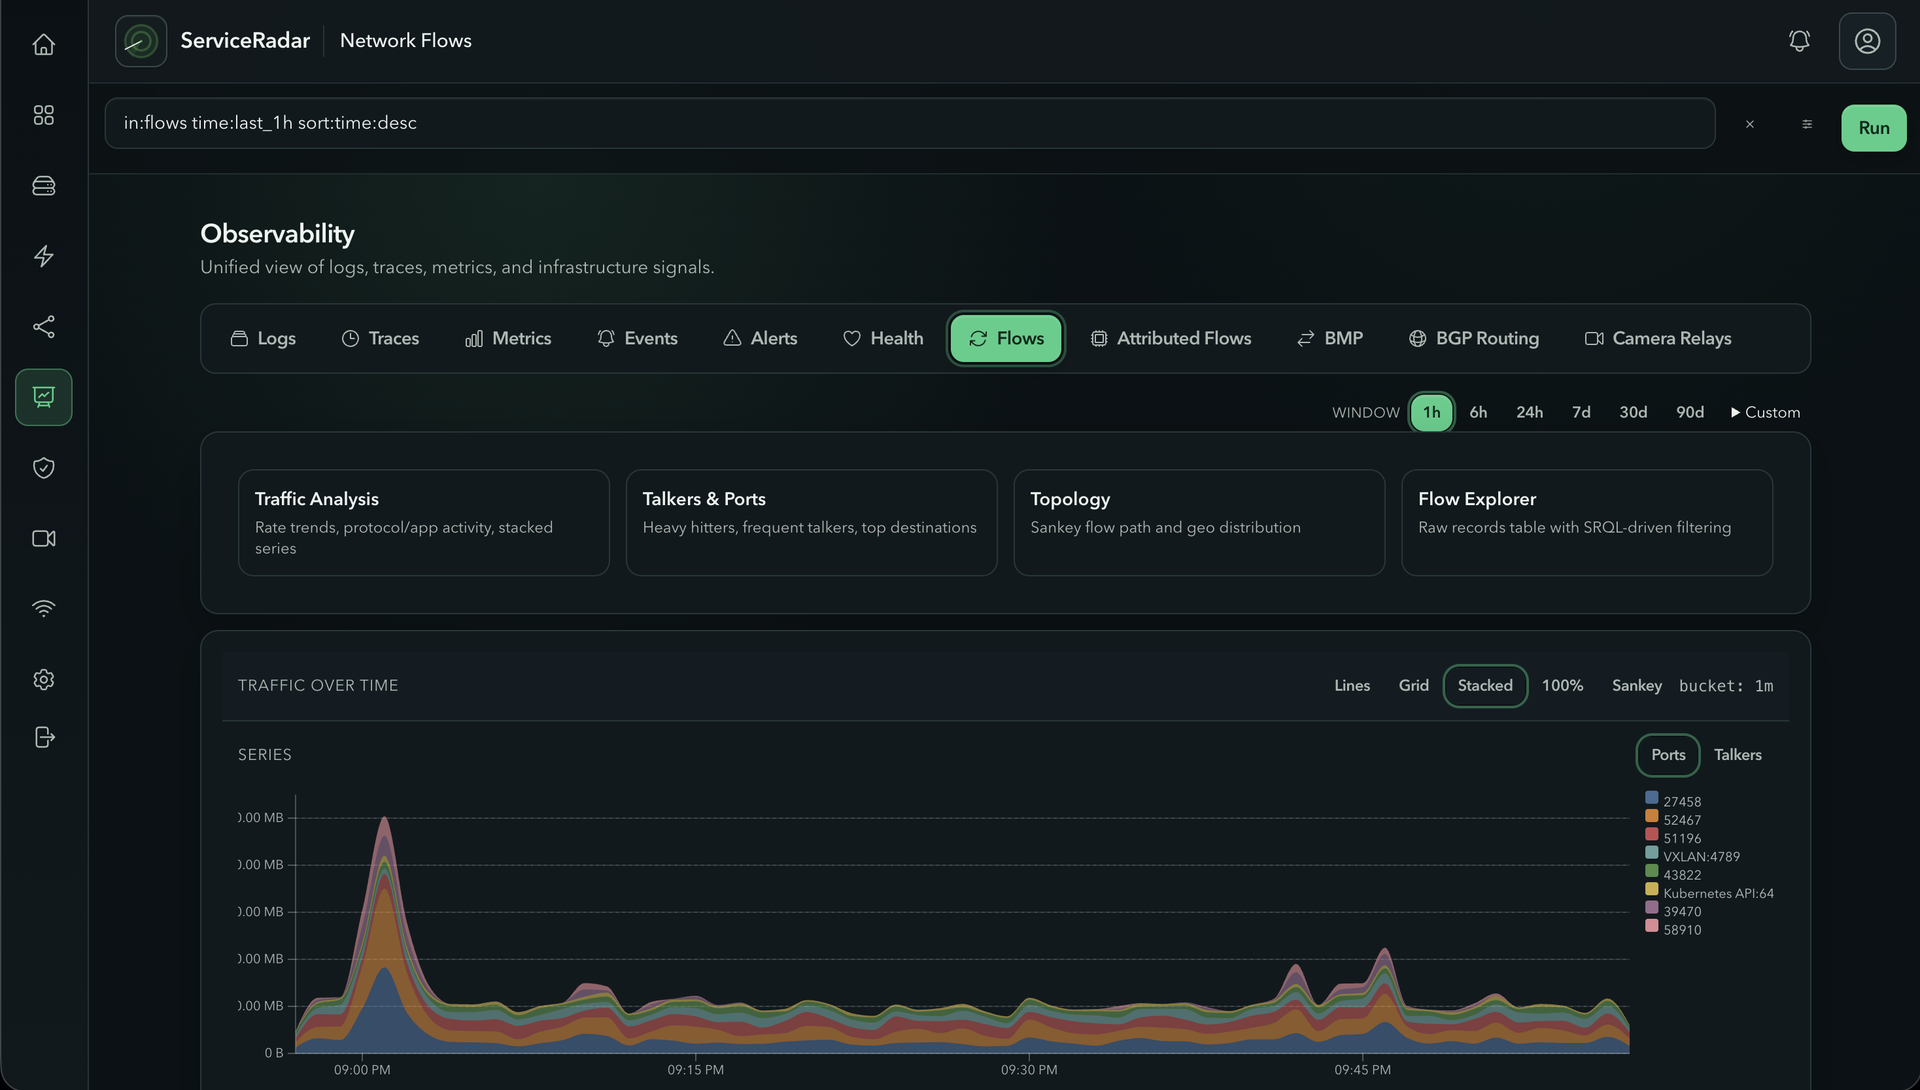
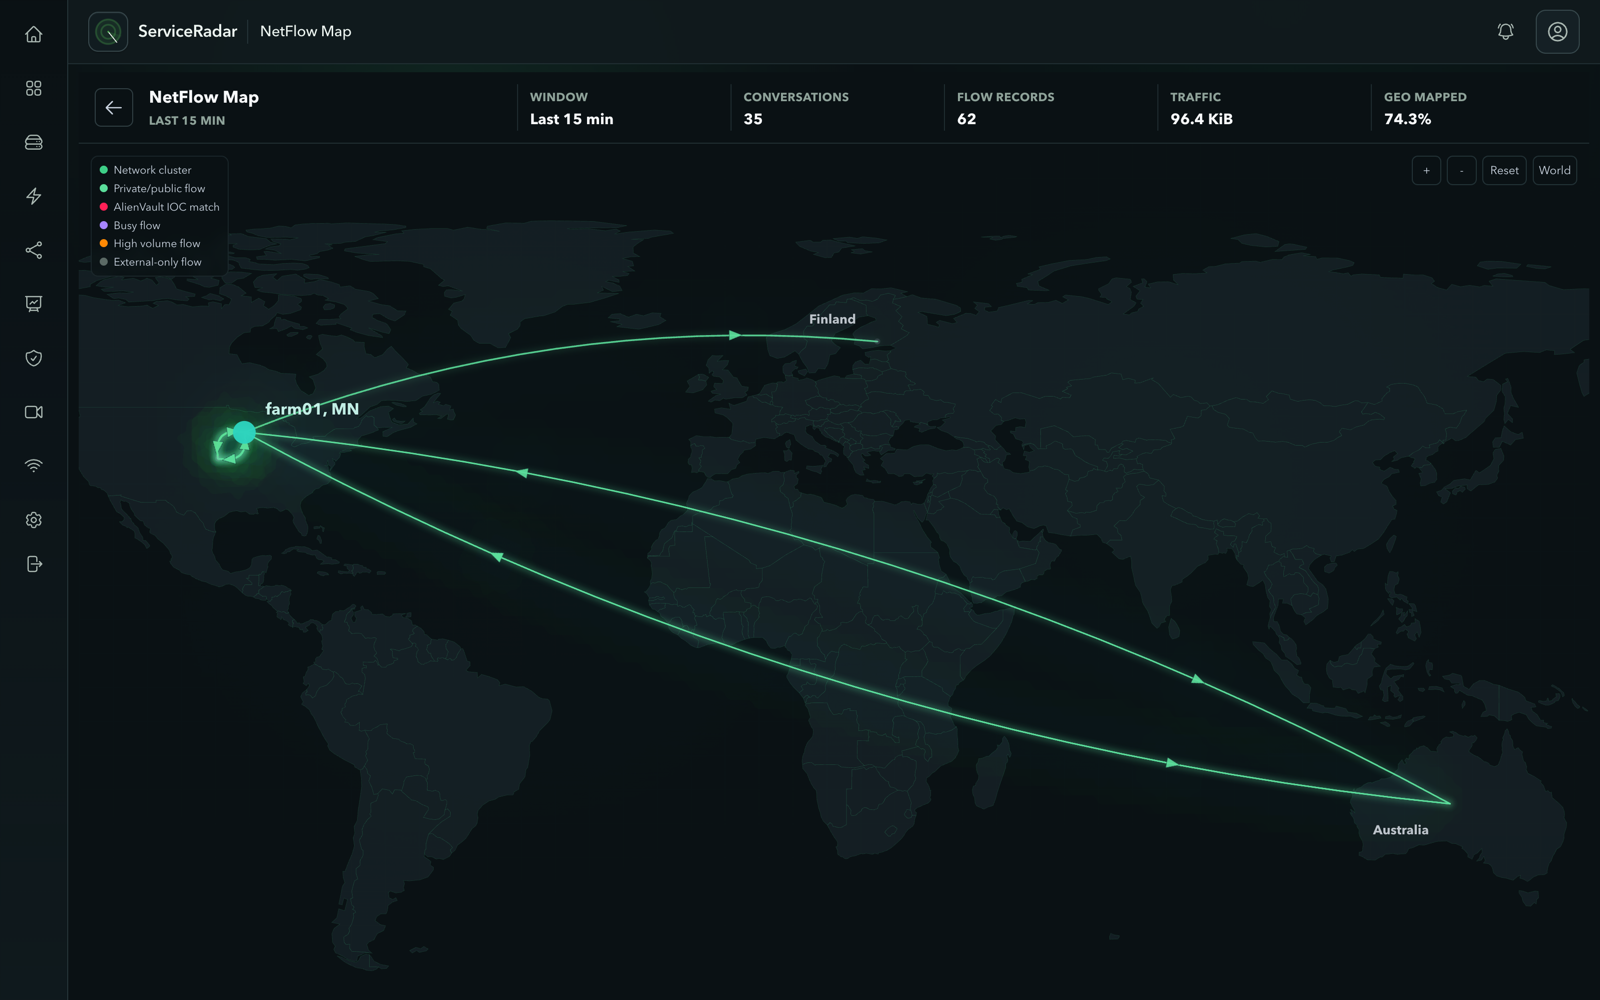
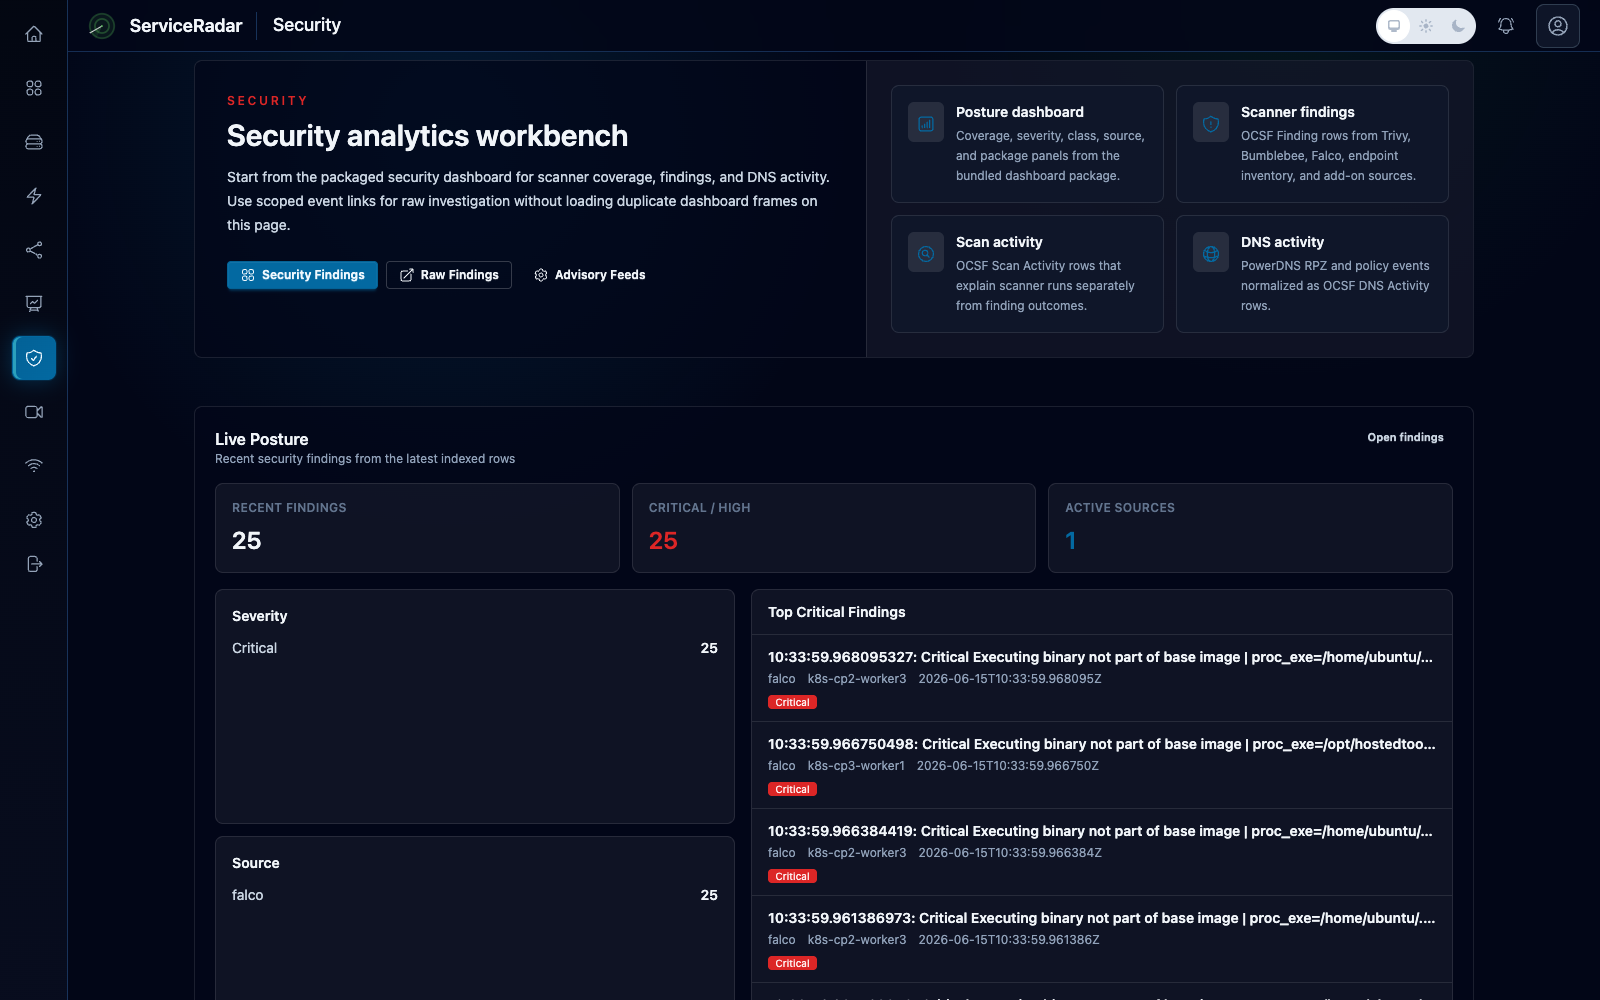
Most teams juggle five consoles to watch one network, and ServiceRadar replaces them with a single operations dashboard for flows, topology, logs, metrics, and alerts. Agents deployed at remote sites keep collecting checks even when the link drops, then deliver their stored records once the connection returns. Discovery over SNMP, LLDP, and CDP builds a topology map that shows traffic between devices, and a NetFlow map traces conversations across the world. Telemetry arrives from OpenTelemetry, syslog, GELF, SNMP polling and traps, BGP, and NetFlow or IPFIX exporters, and a short key:value query language filters any of it. An anomaly engine groups spikes and drift into episodes, so operators get one durable alert instead of a hundred noisy ones. Notification routes with escalation policies page people through Slack, Discord, email, or webhooks, and a delivery log records every attempt. Security views gather scanner findings, threat intelligence matches, and DNS activity, and Ansible playbooks run against inventory devices with live per-host results. Custom checks run as sandboxed plugins, and teams can publish their own dashboards. Managed service providers, multi-site businesses, remote field operations, and homelabs that outgrew a status page are the natural fit. Running on a dedicated VPS on RepoCloud with guaranteed CPU, RAM, and SSD, full root SSH access, and a browser serial console. Apache-2.0 licensed.
Benefits
- One Console For Network Operations
- Flows, topology, logs, metrics, alerts, and security findings share one dashboard, so teams stop switching between separate tools to trace a single network incident.
- Monitoring That Survives Link Outages
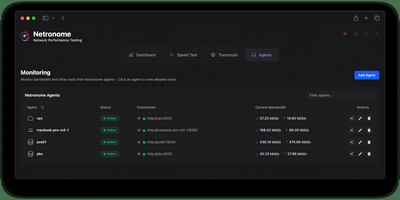
- Edge agents keep running checks at remote sites and deliver their stored records after the connection returns, so gaps in your monitoring history stay small.
- Alerts That Reach The Right People
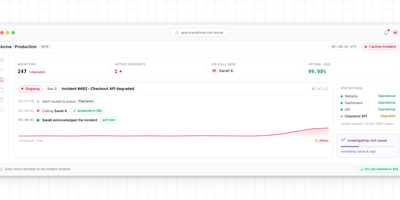
- Routes, escalation policies, and channels turn an alert into a page, and a delivery log records every attempt, including silenced and withheld sends.
- Extend It With Your Own Checks
- Sandboxed plugins add custom checks and a dashboard toolkit builds tailored views, so unusual equipment and workflows fit without forking the platform.
Features
- NetFlow World Map
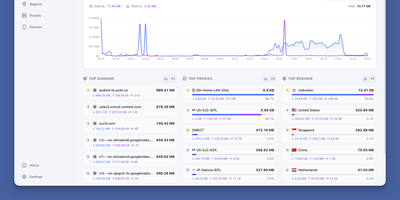
- Trace conversations between your sites and the wider internet on a map, with flow records, traffic volume, and highlights for flows that match threat indicators.
- Network Topology Surface
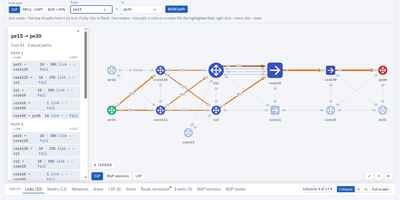
- Discover devices through SNMP, LLDP, and CDP, then explore live links, endpoints, and traffic on an interactive topology graph.
- SRQL Query Language
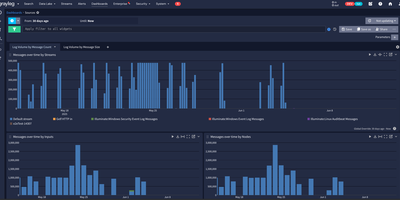
- Filter logs, traces, metrics, events, and flows from one search bar with a short key:value syntax that supports time windows and sorting.
- Anomaly Detection Engine
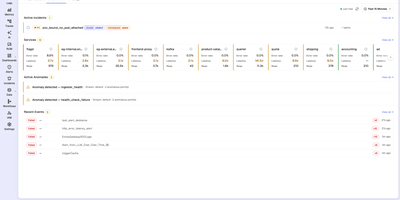
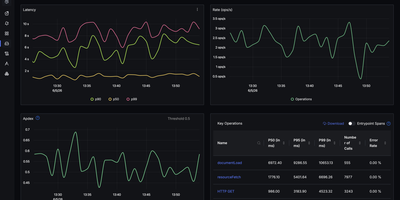
- Score time series for spikes and drift, then group findings into episodes with severity, cooldowns, and capacity runway instead of noisy per-sample alarms.
- Multi-Protocol Telemetry Intake
- Accept OpenTelemetry, syslog, GELF, SNMP polling and traps, BGP, and NetFlow or IPFIX data from the devices already on your network.
- Security Findings Workbench
- Review scanner findings, scan activity, threat intelligence, and DNS events in one place, with severity counts and a list of top critical items.