Categories
Network Monitoring Privacy Tools Self-Hosted Dashboard Network Visualization GeoIP Security AwarenessStars
Forks
Watchers
Developer links
TapMap
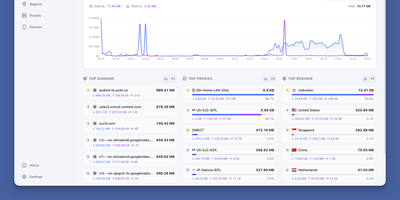
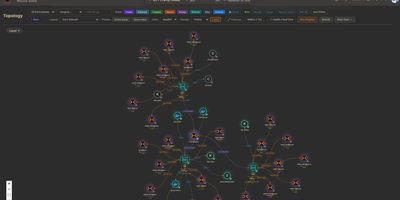
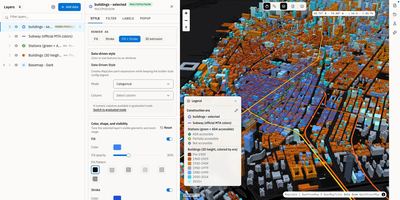
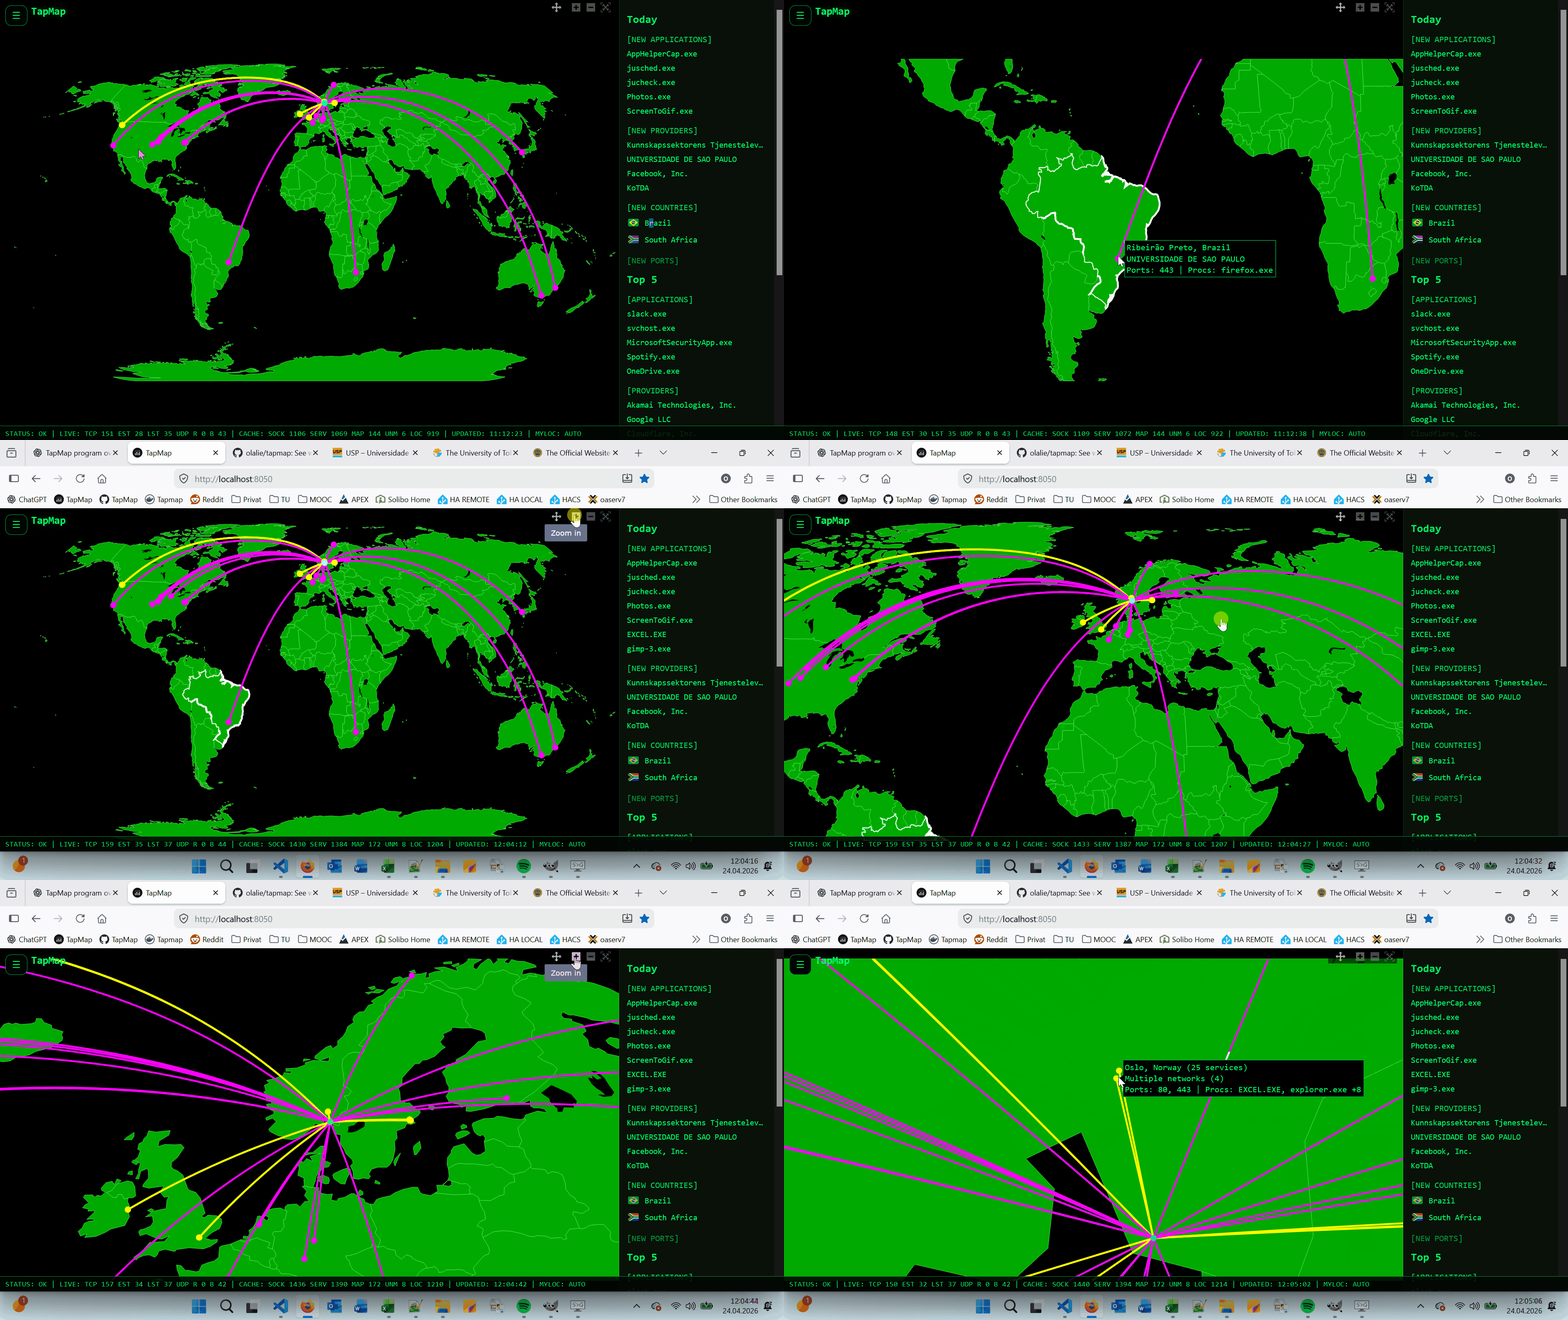
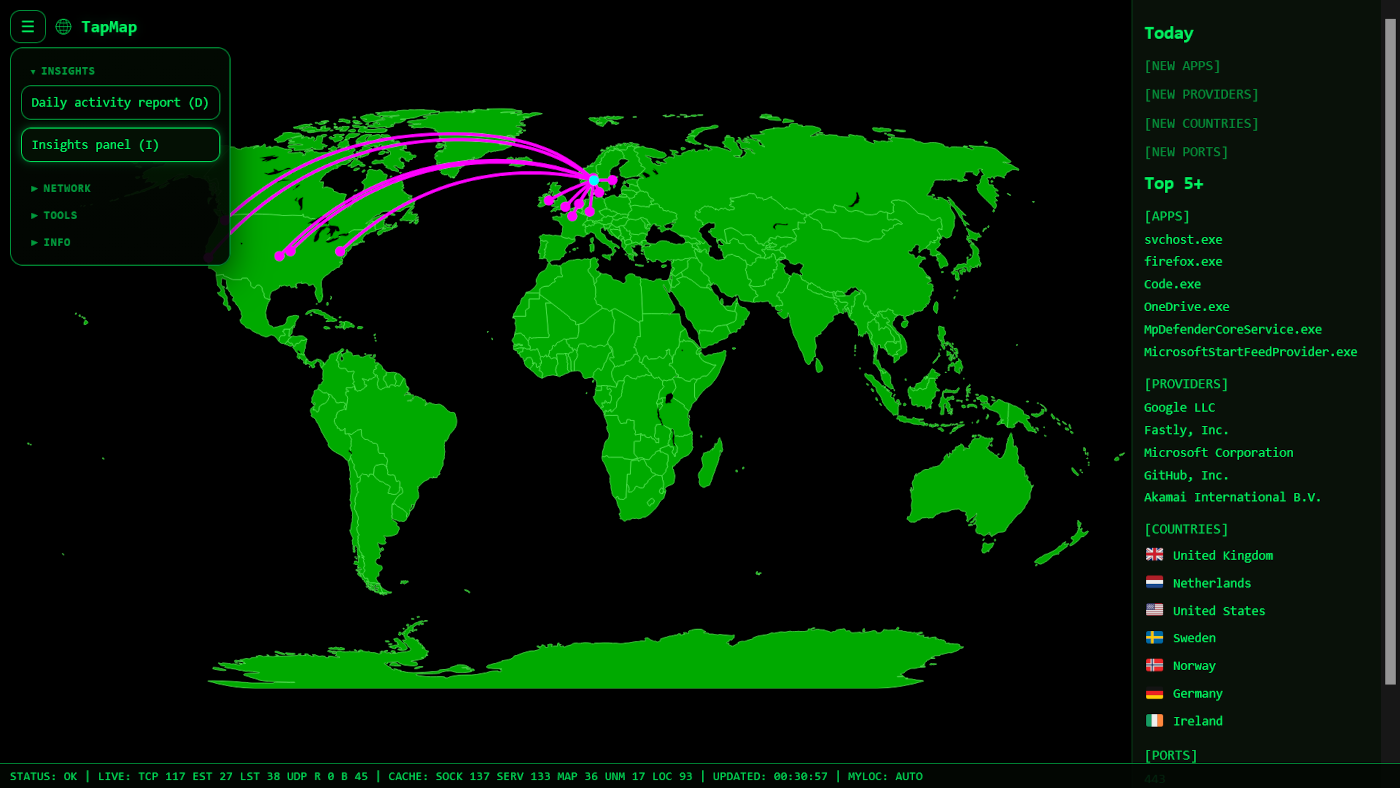
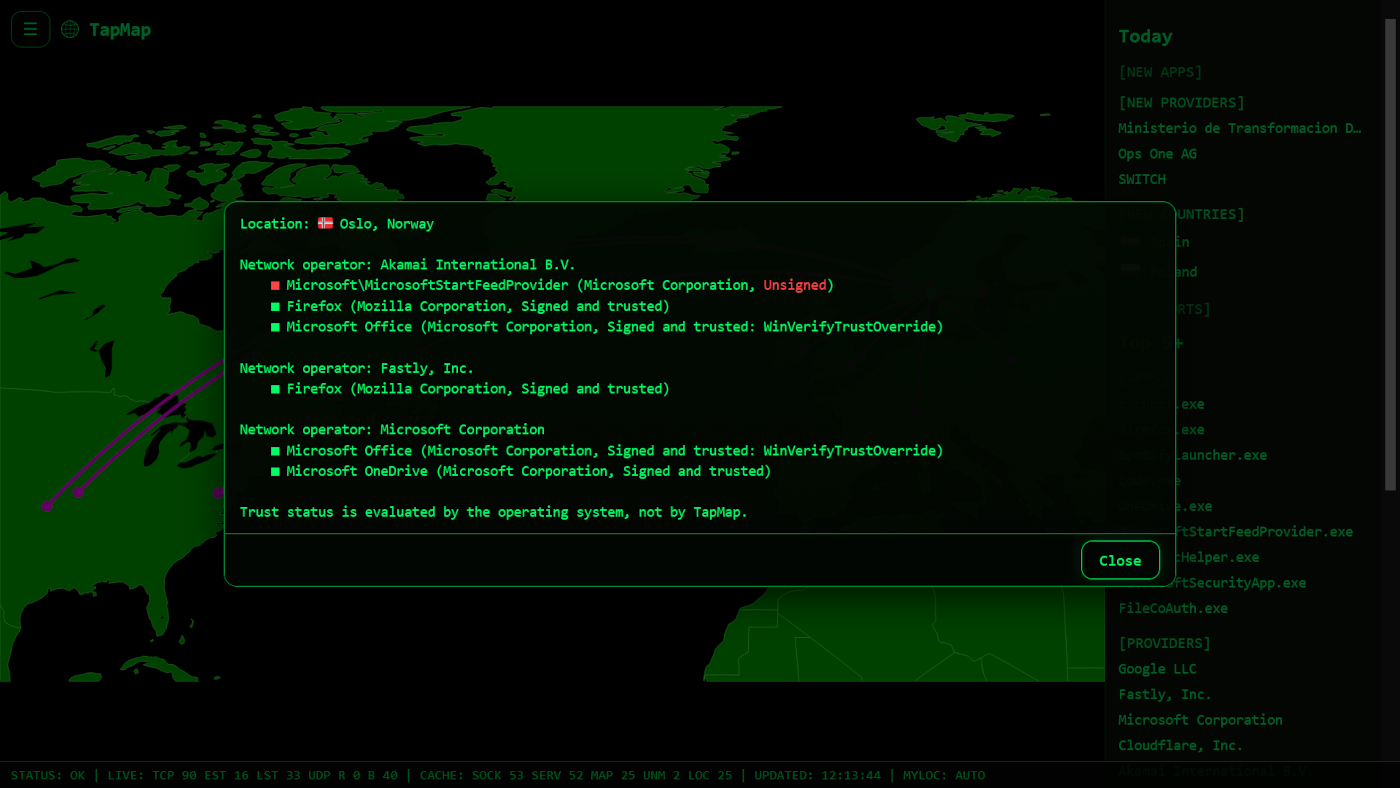
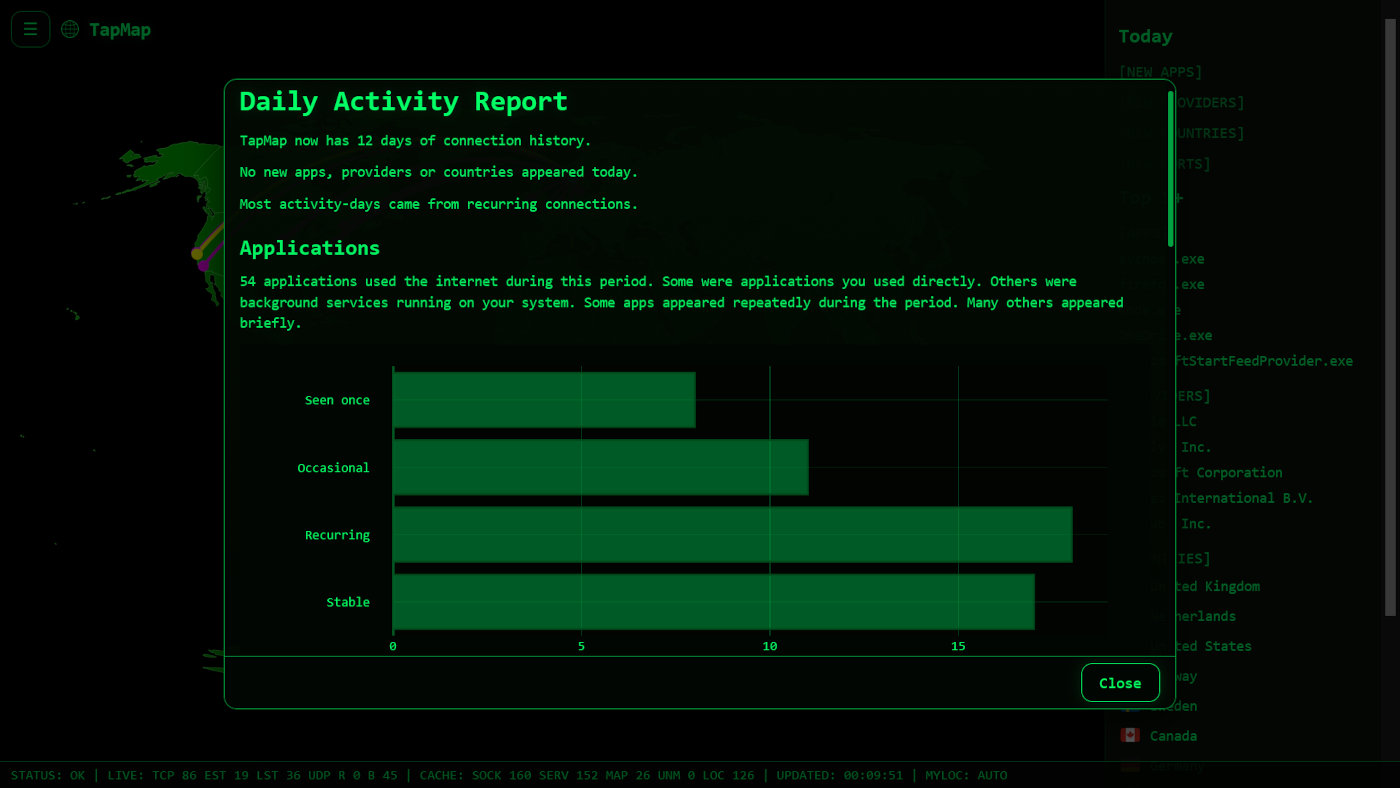
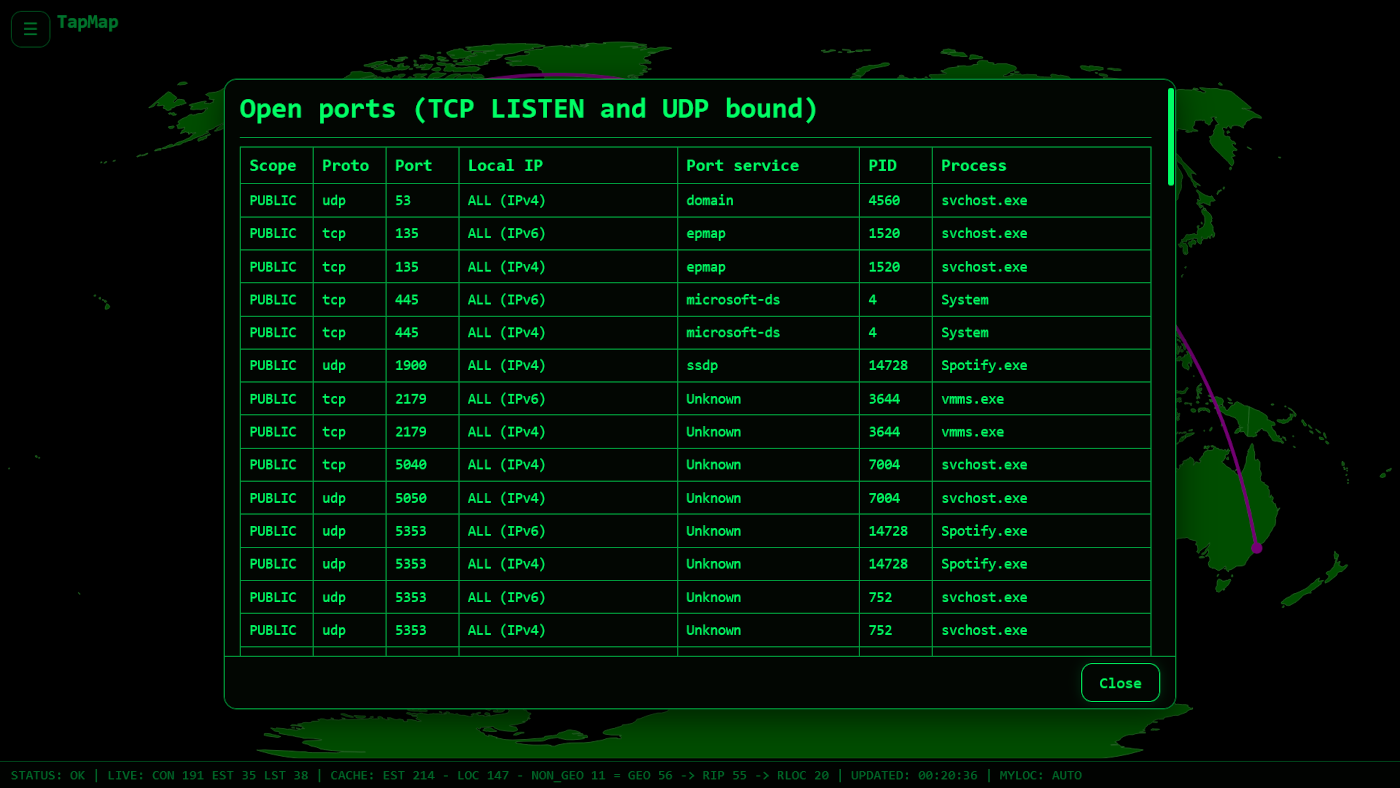
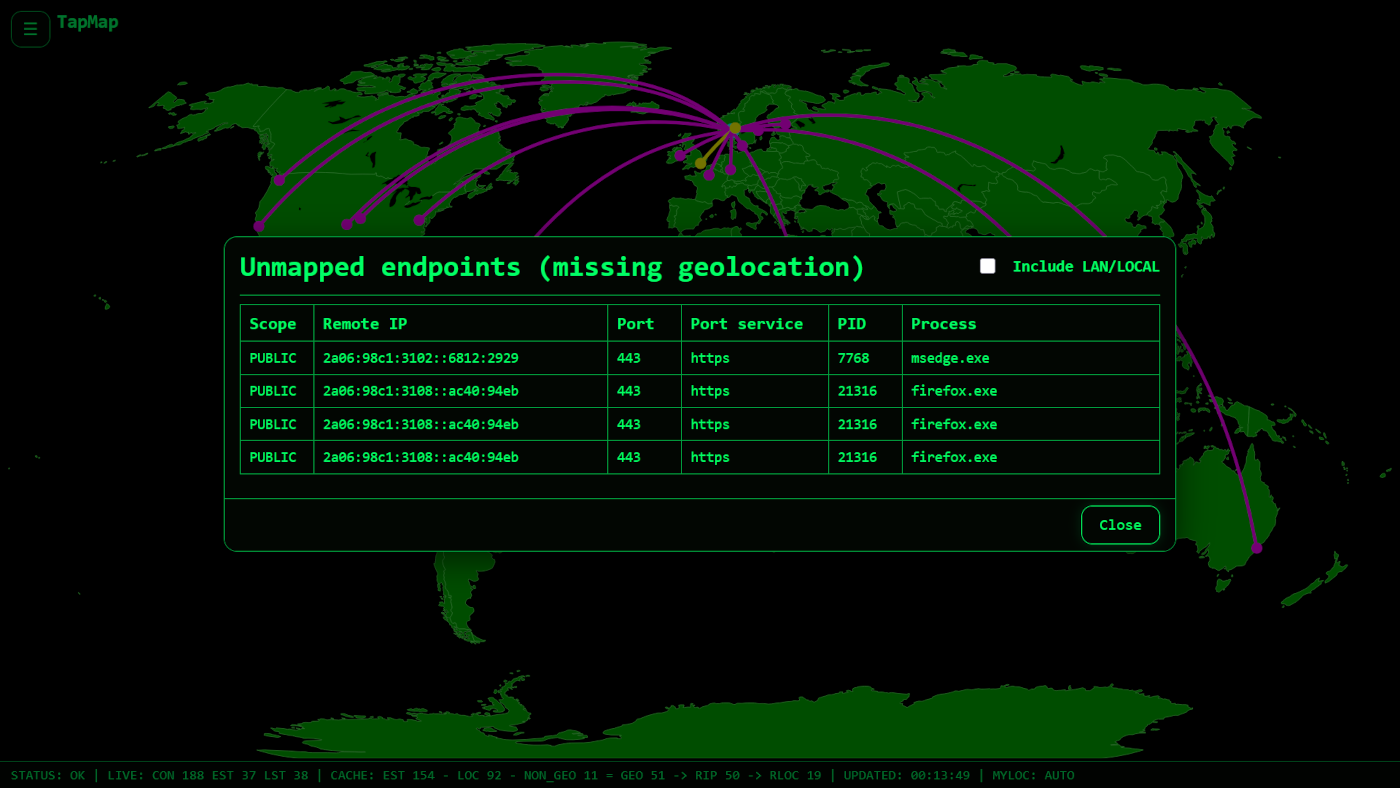
TapMap draws a computer's live network connections on an interactive world map, so you can watch which applications are talking to which services, where those services sit, and what normal looks like for that machine. A local pipeline scans active sockets, extracts the remote addresses, and enriches them with geolocation from databases stored on the machine itself. Every connection carries the owning application or process, its network operator, and the operating system's verification status for that app, and places that share a location are highlighted when connections overlap. The same view lists local open ports, both TCP listeners and bound UDP sockets, established services on your LAN, and public services whose location could not be mapped. A rolling 30-day history turns raw connections into awareness: an Insights panel surfaces new applications, providers, countries, and ports, plus the most frequent activity, while a Significant Connections log records first sightings and failed verifications. A Daily Activity Report goes further, sorting applications into seen-once, occasional, recurring, and stable patterns, analyzing provider concentration, and charting country activity with detailed timelines. New significant connections can raise a desktop notification or publish to an MQTT broker you configure. Nothing is sent anywhere by default: processing happens locally, with no telemetry. Running on a dedicated VPS on RepoCloud with guaranteed CPU, RAM, and SSD, full root SSH access, and a browser serial console. MIT licensed.
Benefits
- See Every Live Connection Mapped
- Watch active sockets become arcs on a world map with the owning application, network operator, and verification status attached to each connection, updated as your machine talks.
- Spot New Network Activity Early
- A rolling 30-day history powers an Insights panel and Significant Connections log that flag first-seen applications, providers, countries, and ports, with desktop or MQTT notifications.
- Local Processing, No Telemetry
- Sockets, GeoIP lookups, history, and reports are all processed on your own machine with local databases, so network behavior data never leaves unless you configure an MQTT broker.
- Understand Normal, Then Notice Change
- The Daily Activity Report sorts applications into seen-once, occasional, recurring, and stable patterns, analyzes provider concentration, and charts country activity so unusual behavior stands out quickly.
Features
- Live Connection Map
- Dash and Plotly render connection arcs and markers on an interactive world map, fed by socket scans from psutil on Linux and Windows or lsof on macOS.
- GeoIP Enrichment
- Remote addresses are located with GeoIP databases stored locally, with built-in database management that installs and updates providers inside the app's own data directory.
- Open Port Inventory
- Lists local TCP LISTEN and bound UDP ports alongside established LAN and local services, plus public services that could not be geolocated.
- Insights And History
- Thirty days of rolling history drive an Insights panel, a Significant Connections log, and a Daily Activity Report covering recurrence patterns and provider concentration.
- MQTT Notifications
- New significant connections can publish to a configured MQTT broker with credentials stored in a permissions-restricted mqtt.json file, or raise desktop notifications outside Docker.
- Docker Host Monitoring
- On Linux, a single container with host networking and host PID visibility monitors the host itself and serves the interface on port 8050.