Percona PMM
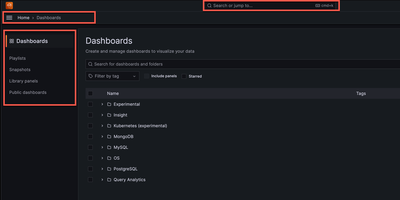
Backed by 1,080+ GitHub stars and maintained by Percona with the latest release v3.8.1 in June 2026, Percona Monitoring and Management delivers the open-source database observability platform that provides a single pane of glass across MySQL, PostgreSQL, MongoDB, Valkey, and Redis databases deployed on-premises, cloud, or hybrid environments. The Go-powered PMM Server collects metrics from lightweight PMM Client agents with minimal performance impact, storing time-series data in ClickHouse for fast querying across configurable retention periods. Query Analytics ranks every query by load across all database engines from one unified dashboard, drilling from fleet-level performance down to individual problematic queries with explain plans, per-query metrics, and anomaly detection. Real-time Query Analytics streams live MongoDB operations updated every 1-5 seconds for immediate troubleshooting of lock contention and long-running queries. Built-in Percona Advisors continuously scan connected databases for security gaps, misconfigurations, and performance problems, distilling decades of DBA expertise into automated actionable recommendations. Percona Alerting integrates with 15+ notification channels including Slack, PagerDuty, email, and webhooks to trigger on custom metric thresholds. Database-specific dashboards visualize InnoDB storage engine details, WiredTiger cache metrics, PostgreSQL tuple activity, replication lag, and cluster health with annotations for root-cause correlation. Deployment options include Docker single-container setup, Podman rootless execution, and Helm charts for Kubernetes with Ingress controller support and ConfigMap management. Running on a dedicated VPS on RepoCloud with guaranteed CPU, RAM, and SSD, full root SSH access, and a browser serial console. AGPL-3.0 licensed.
CHMonitor
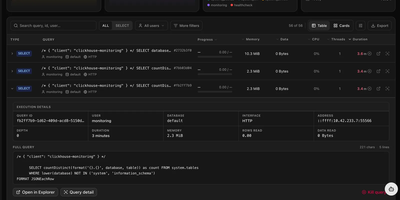
When a ClickHouse cluster slows down, the answers are buried in system tables nobody wants to query by hand; CHMonitor turns those tables into an operations dashboard that explains what the cluster is doing and what to fix next. Live views cover running queries with elapsed time, memory, and a kill action, while history, failed, slowest, and most-expensive pages rank finished work by CPU, duration, and rows read, each with the full statement and one-click EXPLAIN. Thread-level analysis shows how a single query parallelized, and per-user summaries reveal which analyst or service is eating the cluster. Beyond queries, you get a merge and part-lifecycle timeline, replication queue and Keeper health, a live topology map of shards and replicas, storage breakdowns by database, table, and part, and a query activity heatmap spanning a year. An AI advisor reviews the workload and recommends skip indexes, projections, PREWHERE clauses, and TTL changes ranked by impact, with an MCP interface and built-in agent for asking questions in plain English; it recommends only and never applies DDL. Threshold-based health checks alert to Slack, Discord, PagerDuty, or Opsgenie, multiple ClickHouse hosts are watched from one dashboard, and a companion terminal UI covers quick checks from the shell. Running on a dedicated VPS on RepoCloud with guaranteed CPU, RAM, and SSD, full root SSH access, and a browser serial console. GPL-3.0 licensed.