Zabbix
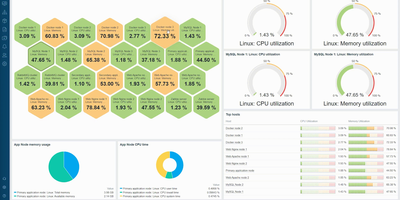
Monitoring everything from network switches to Kubernetes clusters since 2001 with over 6,200 GitHub stars and deployments exceeding 100,000 devices per installation, Zabbix has established itself as one of the most mature and feature-rich open-source monitoring platforms available, trusted by organizations including Dell, Salesforce, ICANN, and T-Mobile. The platform collects metrics from virtually any source using Zabbix Agent written in C, Zabbix Agent 2 written in Go with native plugin support, SNMP v1/v2c/v3 polling and trapping, IPMI for hardware health, JMX for Java applications, SSH and Telnet checks, HTTP/HTTPS polling, and ODBC database queries. Version 7.0 LTS introduced synthetic browser monitoring that executes user-defined JavaScript via WebDriver to simulate multi-step user interactions on websites, proxy load balancing with automatic host redistribution across proxy groups for high availability, in-memory proxy data buffering delivering up to 100x performance improvement, native multi-factor authentication with TOTP and Duo support, and just-in-time user provisioning from SAML and LDAP. Low-level discovery automatically detects file systems, network interfaces, SNMP OIDs, VMware resources, and Kubernetes pods, creating monitoring items and triggers dynamically. The alerting engine correlates events with configurable escalation chains, sending notifications through Slack, Microsoft Teams, PagerDuty, Jira, email, and SMS with customizable message templates. Over 1,000 official templates provide instant monitoring for Linux, Windows, VMware, AWS, Azure, Docker, PostgreSQL, MySQL, Apache, Nginx, and hundreds more. Running on a dedicated VPS on RepoCloud with guaranteed CPU, RAM, and SSD, full root SSH access, and a browser serial console. AGPL-3.0 licensed.
Graylog
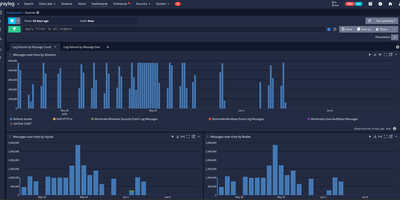
Trusted by over 60,000 organizations worldwide with more than 8,100 GitHub stars since 2010, Graylog has established itself as one of the fastest paths from raw log data to operational visibility, delivering centralized log management, security analytics, and compliance auditing through a purpose-built web interface with sub-second search at scale. The platform ingests logs from virtually any source via syslog, GELF, Beats, raw TCP/UDP, HTTP, CEF, IPFIX, and Netflow protocols, processing each message through configurable pipelines that parse fields, apply transformations, enrich events with GeoIP data from MaxMind or IPinfo lookup tables, and route messages to appropriate streams based on content rules. OpenSearch handles full-text indexing and storage with dynamic shard sizing that automatically calculates appropriate sizes from available node memory, while MongoDB stores configuration metadata including user accounts, roles, dashboards, alert rules, and pipeline definitions. The alerting system integrates with Slack, PagerDuty, and email with customizable notification templates and Replay Search links for immediate investigation context. Version 7.0 introduced MCP server integration for connecting preferred LLMs to perform AI-assisted log analysis and automation, while version 7.1 added Sigma detection rule import from private GitHub, GitLab, and Bitbucket repositories for detection-as-code workflows. The Sidecar agent management system centrally configures and deploys Filebeat, Winlogbeat, and nxlog collectors across infrastructure from the Graylog web interface. Running on a dedicated VPS on RepoCloud with guaranteed CPU, RAM, and SSD, full root SSH access, and a browser serial console. SSPL licensed.
OpenObserve
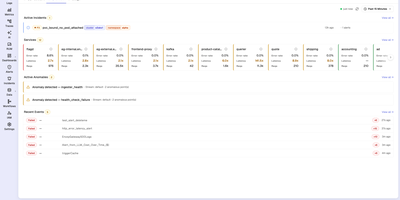
With 20,500+ GitHub stars and over 6,000 organizations running it in production — including a Fortune 100 company ingesting more than 4 PB per day — OpenObserve is the open-source observability platform that replaces your entire Datadog, Splunk, or ELK stack with a single Rust binary deploying in under two minutes. Apache Parquet columnar storage with zstd compression on S3-compatible object storage delivers 140x lower storage costs than Elasticsearch while providing better query performance on a quarter of the hardware. Ingest logs, metrics, and distributed traces via native OpenTelemetry OTLP endpoints with no vendor lock-in. Query logs and traces with standard SQL, metrics with SQL or PromQL — no proprietary query language to learn. The built-in dashboard builder offers 19 chart types including time-series graphs, heatmaps, gauges, tables, and top-K lists with drag-and-drop layout combining data from all signal types. Data pipelines process, enrich, redact, or normalize ingestion streams using Vector Remap Language for real-time transformations including PII redaction and logs-to-metrics conversion. Real User Monitoring captures frontend performance with session replay. The Service Catalog provides topology-based trace analysis with side-panel drill-downs into database queries and error details. Alerting supports real-time and scheduled rules with SQL and PromQL conditions. Native multi-tenancy isolates organizations and streams with complete data separation. Running on a dedicated VPS on RepoCloud with guaranteed CPU, RAM, and SSD, full root SSH access, and a browser serial console. AGPLv3 licensed.
Agenta
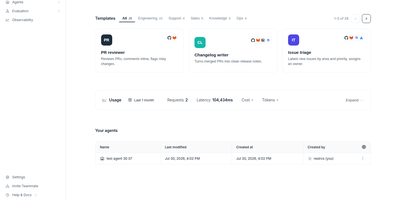
Agenta delivers a comprehensive open-source LLMOps workspace that covers the full lifecycle of AI application development — from prompt engineering through production monitoring. The platform supports 15+ model providers including OpenAI, Anthropic, Google Gemini, Mistral, Groq, Together AI, Azure, AWS Bedrock, and self-hosted models via Ollama, enabling teams to switch between providers without code changes. The prompt playground allows side-by-side comparison of different configurations, while the evaluation system offers LLM-as-a-Judge assessment, 20+ pre-built evaluators covering semantic similarity, regex matching, and factual accuracy, plus custom Python evaluators for domain-specific requirements. Teams run evaluations through both the web UI for subject matter experts and the Evaluation SDK for programmatic CI/CD integration. The observability layer captures full trace visibility across complex agentic workflows, flagging quality issues like hallucinations and off-topic responses in real time. Human annotation workflows let domain experts review and annotate LLM outputs, feeding corrections back into the evaluation loop. The architecture supports Chain of Prompts, RAG pipelines, and multi-step agent workflows, integrating with frameworks like LangChain and LlamaIndex. Self-hosting deploys via Docker Compose with Traefik for routing, requiring only a clone, environment configuration, and a single docker compose command. On RepoCloud, deploy Agenta on a dedicated VPS with root SSH access, persistent storage for evaluation datasets and traces, and complete control over model provider credentials, all under the MIT license with no usage restrictions.
OpenStatus
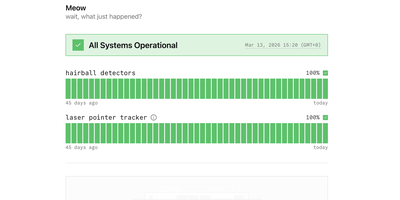
Trusted by Cal.com, WhiteBIT, and Documenso and backed by 8,800+ GitHub stars, OpenStatus delivers the open-source status page and uptime monitoring platform that replaces Atlassian Statuspage, Better Stack, and Instatus with a single self-hosted deployment. The monitoring engine runs Go-based probes across 28 global regions on three cloud providers checking HTTP, TCP, and DNS endpoints in parallel with configurable intervals and multi-region consensus to eliminate false-positive alerts. Status pages ship with custom domain support, password and email-domain access controls, maintenance windows, grouped monitor components, and subscriber notifications via email and RSS. Incident management provides structured status reports with investigating, identified, monitoring, and resolved timeline phases that publish automatically to affected status pages. The monitoring-as-code workflow supports YAML configuration synced through the CLI, a GitHub Actions integration for CI/CD pipelines, and a Terraform provider for infrastructure-as-code deployments. The typed ConnectRPC JSON-over-HTTP API exposes a published OpenAPI specification with a Node SDK for programmatic access, while an MCP server connects AI assistants like Claude, ChatGPT, and Cursor directly to workspace data. The tech stack combines Next.js with shadcn/ui for the dashboard, Hono for the API server, Drizzle ORM over Turso for application data, and Tinybird for analytics. Private monitoring locations deploy as a single 8.5MB Docker image behind firewalls to check internal services. Running on a dedicated VPS on RepoCloud with guaranteed CPU, RAM, and SSD, full root SSH access, and a browser serial console. AGPL-3.0 licensed.
Jaeger
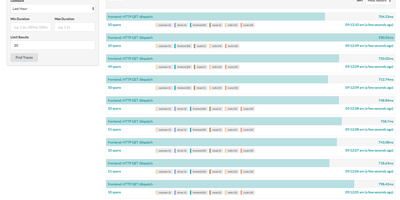
Created by Uber Technologies and graduated as the seventh CNCF top-level project in October 2019 with over 23,000 GitHub stars, Jaeger has become one of the most widely deployed open-source distributed tracing platforms, processing billions of spans per day in production environments at organizations including Uber, Red Hat, and Shopify. Version 2 rebuilt the platform on the OpenTelemetry Collector framework, inheriting its extensible pipeline architecture while implementing Jaeger-specific features as extensions and components, enabling seamless integration with the OpenTelemetry ecosystem through native OTLP protocol support. The platform stores traces in Cassandra 4.0+, Elasticsearch 7.x/8.x, OpenSearch 1.0+, ClickHouse, or the embedded Badger database for development setups. Three sampling strategies control trace volume: head-based sampling with constant, probabilistic, and rate-limiting modes, tail-based sampling using the OpenTelemetry Collector processor that evaluates complete traces before storage decisions, and adaptive sampling that dynamically adjusts probabilities based on observed traffic patterns. Service Performance Monitoring computes RED metrics directly from spans, displaying request rates, error rates, and latency percentiles in the Monitor tab with drill-down from aggregate service views to individual traces. The web UI provides trace search with multi-field filtering, trace detail views with span timeline visualization, trace comparison across services, and dependency graphs mapping service relationships from actual traffic. Deployment options range from a single all-in-one binary for development to distributed collector-ingester-query configurations with Kafka intermediate buffering for production scale. Running on a dedicated VPS on RepoCloud with guaranteed CPU, RAM, and SSD, full root SSH access, and a browser serial console. Apache 2.0 licensed.
OneUptime
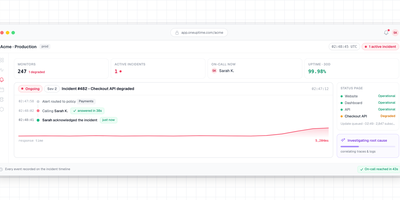
With 7,400+ GitHub stars and a feature set that replaces seven separate SaaS subscriptions — Pingdom for monitoring, StatusPage.io for status pages, PagerDuty for on-call, Incident.io for incident management, Datadog for APM, Loggly for logs, and Sentry for error tracking — OneUptime delivers every tool your reliability team needs in a single open-source platform that is genuinely 100% open source under Apache 2.0 (not open-core). Uptime monitoring runs synthetic checks against websites, APIs, ports, SSL certificates, and DNS records from distributed global probes with configurable intervals and thresholds. Branded status pages publish automatically when monitors detect issues, notifying subscribers via email, SMS, webhook, or RSS without manual intervention during an outage. On-call scheduling routes alerts through escalation policies to the right engineer via phone call, SMS, push notification, Slack, or Microsoft Teams. The incident management workflow handles declaration, triage, communication, resolution, and post-mortem generation in a unified timeline. APM collects traces and metrics via native OpenTelemetry integration — no proprietary agents required — while log management provides full-text search and alerting. An AI agent continuously monitors telemetry data, identifies root causes, and opens GitHub pull requests with proposed fixes for review. Deploy via Docker Compose or Kubernetes Helm charts with a Terraform provider for infrastructure-as-code configuration. Running on a dedicated VPS on RepoCloud with guaranteed CPU, RAM, and SSD, full root SSH access, and a browser serial console. Apache-2.0 licensed.
Netdata
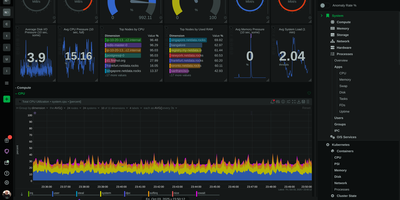
Trusted by millions of engineers and deployed on over 80,000 GitHub stars worth of community confidence, Netdata delivers true real-time monitoring at per-second granularity — 10-60x faster than Prometheus, Datadog, or any conventional monitoring stack that averages away the transient anomalies lasting 2-10 seconds where most production incidents originate. A single installation command deploys the agent with zero configuration, automatically discovering every running process, container, systemd service, network connection, disk, and application on the host within seconds. Unsupervised machine learning trains multiple models per metric directly at the edge, detecting anomalies without thresholds, baselines, or manual tuning. The distributed Parent-Child architecture scales horizontally from a single Raspberry Pi to fleets exceeding 100,000 nodes while maintaining sub-2-second visualization latency and storing metrics at approximately 0.5 bytes per sample through tiered compression. Native network monitoring provides live topology maps, NetFlow and sFlow analytics, SNMP device polling across 200+ profiles, and trap handling — capabilities that typically require a separate NPM product. Hundreds of pre-configured alerts cover systems and applications out of the box, with AI-powered root cause analysis surfacing correlated metrics through natural language via MCP-compatible AI assistants. The agent supports Linux, macOS, FreeBSD, Kubernetes, and Docker with eBPF-based kernel observability requiring no application instrumentation. Running on a dedicated VPS on RepoCloud with guaranteed CPU, RAM, and SSD, full root SSH access, and a browser serial console. GPL v3+ licensed.
VictoriaMetrics
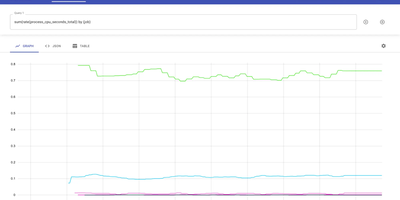
Trusted by thousands of organizations processing billions of time series data points and backed by 17,000+ GitHub stars, VictoriaMetrics delivers a monitoring and time series database that outperforms Prometheus by 16x on query speed while consuming 2.5x less disk space through its optimized compression and storage engine. The architecture supports both single-node deployments handling 10M+ active time series and a horizontally scalable cluster version with vminsert, vmstorage, and vmselect components providing multi-tenancy, replication, and independent namespace isolation. Data ingestion accepts both push protocols including InfluxDB line protocol, Graphite plaintext, OpenTSDB HTTP, CSV, and OpenTelemetry OTLP alongside pull-based Prometheus scraping and remote write, enabling drop-in replacement of existing monitoring stacks without reconfiguring exporters. MetricsQL extends standard PromQL with additional functions, subqueries, and implicit time range alignment while maintaining full backward compatibility with existing Prometheus alerts and Grafana dashboards. The vmalert component processes recording and alerting rules with Alertmanager integration, while vmbackup and vmrestore enable point-in-time snapshots to S3, GCS, and Azure Blob Storage. Stream aggregation operates as a StatsD alternative for pre-aggregating high-cardinality metrics before storage. NFS-compatible storage backends including Amazon EFS and Google Filestore allow shared persistent volumes across cluster nodes. Running on a dedicated VPS on RepoCloud with guaranteed CPU, RAM, and SSD, full root SSH access, and a browser serial console. Apache-2.0 licensed.
HyperDX
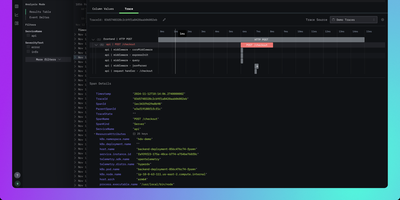
HyperDX correlates logs, metrics, traces, session replays, and errors in a single interface so engineers can resolve production incidents in minutes instead of hours. Nearly 10,000 GitHub stars reflect its role as the integrated UI layer for the ClickStack blueprint endorsed by ClickHouse. The platform connects to any ClickHouse cluster as its storage backend, working with existing table structures without requiring data migration or proprietary ingestion formats. An intuitive Lucene-like search syntax supports full-text queries and property filtering like level:err or service.name:api without needing SQL, while native JSON string querying and event delta analysis surface anomalies in high-cardinality datasets. One-click cross-signal correlation lets you jump from a log line to its distributed trace, from a slow span to associated logs, or from a frontend session replay to the backend errors it triggered. The OpenTelemetry Collector accepts telemetry via OTLP on gRPC port 4317 and HTTP port 4318, supporting automatic instrumentation for Node.js, Python, Java, Go, Ruby, and browser applications. APM tracks HTTP request latency, database query duration, and external service calls with trace waterfall visualizations. Configurable alerts trigger via webhook, Slack, PagerDuty, or email when thresholds are breached. Deploys via Docker Compose with ClickHouse, MongoDB, Redis, and the OpenTelemetry Collector. Running on a dedicated VPS on RepoCloud with guaranteed CPU, RAM, and SSD, full root SSH access, and a browser serial console. MIT licensed.
Kener
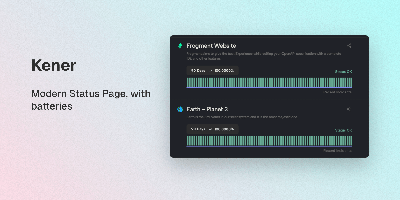
A polished public status page without Statuspage prices or a heavyweight observability suite: Kener is a status and uptime monitoring system built with SvelteKit and Node.js. It runs 11 monitor types - API, Ping, TCP, DNS, SSL certificate, SQL query, Heartbeat, gRPC, and GameDig game-server checks among them - each with configurable intervals and thresholds. Incident management covers the full lifecycle: structured timelines from investigation through resolution, acknowledgements, and subscriber-visible updates, plus maintenance windows with RRULE-based recurring schedules and automatic status transitions. Notifications reach email, Slack, Discord, and custom webhooks through trigger-based workflows with template-driven messaging. One instance can serve multiple branded status pages - per product, team, or region - with custom logos, colors, and CSS, localization into 21 languages, timezone-aware displays, and server-rendered pages that stay fast and SEO-friendly. Operations tooling includes role-based access for teams, API key management, a secrets vault, analytics integrations (Google Analytics, Plausible, Umami, and others), and a REST API with 17+ endpoints for automating incidents and monitors from CI/CD. MIT-licensed; Docker deployment with Redis, SQLite by default, PostgreSQL or MySQL for production.
Grafana Loki
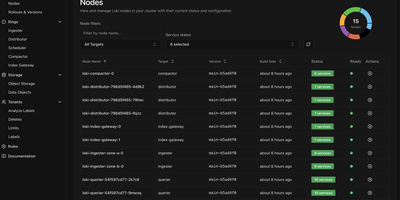
With over 28,600 GitHub stars and 450 contributors, Grafana Loki is the log aggregation system that takes the Prometheus approach to logging — indexing only metadata labels instead of full log content, making it dramatically cheaper and simpler to operate than traditional log management platforms. The label-based indexing strategy groups log streams using the same labels already applied to Prometheus metrics, enabling seamless switching between metrics and logs in Grafana dashboards without maintaining separate indexing infrastructure. Grafana Alloy, the telemetry collector replacing Promtail, scrapes and pushes logs with Prometheus-style service discovery, automatic Kubernetes Pod label extraction, and pipeline stages for parsing, filtering, and relabeling before ingestion. LogQL, the query language, combines label matchers for stream selection with regex line filters and aggregation functions, supporting rate calculations, pattern parsing, and metric generation from log data for alerting and dashboard panels. The storage architecture writes compressed log chunks and TSDB indexes to S3, GCS, Azure Blob Storage, or MinIO-compatible object stores, with configurable retention and compaction policies. Deployment modes scale from a single binary for development through monolithic high-availability mode with multiple replicas to full microservices decomposition with separate ingester, distributor, querier, query-frontend, compactor, and ruler components on Kubernetes via Helm charts. Multi-tenancy isolates data and query paths per tenant through header-based tenant ID assignment. Running on a dedicated VPS on RepoCloud with guaranteed CPU, RAM, and SSD, full root SSH access, and a browser serial console. AGPL-3.0 licensed.
BitRouter
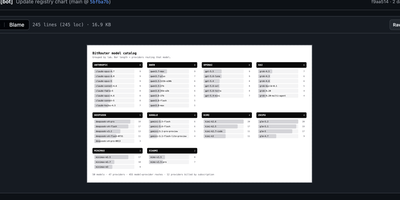
BitRouter is a context-aware LLM router that learns which model delivers the cheapest successful outcome per workflow step, cutting agent costs by up to 80% while maintaining 96% quality versus all-frontier baselines. Point any agent runtime at http://localhost:4356 with a one-line OPENAI_BASE_URL change and BitRouter routes to OpenAI, Anthropic, Google, Groq, DeepSeek, Mistral, Moonshot, MiniMax, Nvidia, and any OpenAI-compatible endpoint simultaneously, normalizing authentication, streaming, and cross-protocol translation between wire formats. The act-observe-evaluate-learn loop traces every hop with cost, tokens, and latency attribution, scores each decision against a versioned policy-lock.yaml, then tightens routes automatically with no LLM judge in the path. Native MCP gateway auto-discovers tools from connected servers and makes them routable and governed alongside model calls. Agent Client Protocol integration enables the TUI to manage Claude Code, Codex, OpenCode, OpenClaw, Gemini, and Copilot sessions in real time with inline tool-call approval and live streaming. Built-in guardrails inspect, redact, or block risky content before requests leave your network. Virtual keys scope API access per agent or user without exposing upstream credentials. Per-agent spend caps and loop guards contain runaway cost automatically. Multi-account failover reroutes mid-run so rate limits never re-pay completed work. Ships as a single Rust binary via npm or Cargo. Running on a dedicated VPS on RepoCloud with guaranteed CPU, RAM, and SSD, full root SSH access, and a browser serial console. Apache 2.0 licensed.
DataHub
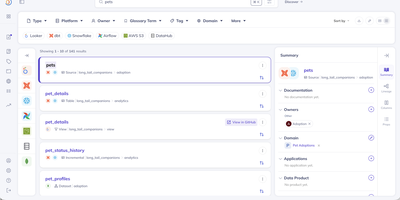
DataHub maps your entire data ecosystem into a searchable, governed catalog where every table, pipeline, dashboard, and metric is discoverable and traceable from source to consumer. Originally built at LinkedIn to manage metadata at hyperscale and proven to handle 10 million+ assets and billions of relationships in production, the platform is now trusted by 3,000+ organizations including Netflix, Visa, Slack, and Pinterest. The Spring Java backend (GMS) exposes both GraphQL and OpenAPI REST endpoints, while the React frontend delivers an intuitive interface for searching, browsing, and governing data assets. The Python-based ingestion framework provides 80+ production-grade connectors extracting deep metadata from Snowflake, BigQuery, Redshift, Databricks, dbt, Airflow, Spark, Kafka, Looker, Tableau, Power BI, Superset, PostgreSQL, MySQL, Hive, Glue, S3, Iceberg, and Unity Catalog through pull-based scheduled crawls and push-based emission via Python and Java SDKs. Automatic table-level and column-level lineage detection uses SQL parsing with 97-99% accuracy, tracing data flows from ingestion pipelines through warehouses to BI dashboards. Real-time metadata streaming via Kafka keeps the catalog continuously synchronized as schemas evolve and pipelines execute. The governance layer provides business glossary management, tag propagation along lineage graphs, domain-based organization, and fine-grained access control policies. DataHub Actions triggers automated responses to metadata changes, enabling notifications, quality checks, and downstream workflows. Elasticsearch powers full-text search with faceted filtering across entities. Running on a dedicated VPS on RepoCloud with guaranteed CPU, RAM, and SSD, full root SSH access, and a browser serial console. Apache 2.0 licensed.

MLflow
Trusted by thousands of organizations with over 30 million monthly downloads and 20,000+ GitHub stars, MLflow is the largest open-source AI engineering platform providing end-to-end lifecycle management for traditional ML models, LLMs, and AI agents. The OpenTelemetry-based tracing system captures complete request flows through any LLM provider or agent framework — including OpenAI, LangChain, DSPy, Vercel AI, PydanticAI, and smolagents — with one-line auto-instrumentation that tracks inputs, outputs, token usage, and costs at every intermediate step. MLflow's evaluation engine offers 50+ built-in metrics and LLM judges for systematic quality assessment, detecting issues across correctness, latency, adherence, relevance, and safety dimensions before code reaches production. The Prompt Registry versions, tests, and deploys prompts with full lineage tracking while automated optimization algorithms improve prompt performance using evaluation feedback. The AI Gateway provides a unified API endpoint for all LLM providers, enforcing rate limits, cost controls, and access policies across the organization. MLflow 3.0 introduces the LoggedModel abstraction linking traces, metrics, and prompts to specific model versions across Python, TypeScript, Java, and R SDKs. The model registry manages deployment workflows with automated quality gates, while experiment tracking records parameters, metrics, and artifacts across training runs. Running on a dedicated VPS on RepoCloud with guaranteed CPU, RAM, and SSD, full root SSH access, and a browser serial console. Apache License 2.0 licensed.
CPA Manager Plus
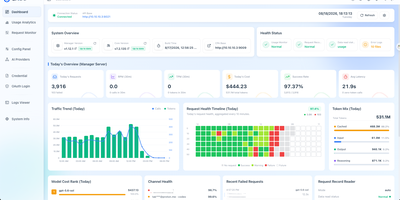
CPA Manager Plus is a self-hosted observability dashboard and management panel that tracks every AI request flowing through your CLI Proxy API gateway, breaking down failures, costs, and account health across providers like OpenAI, Anthropic, xAI, and Codex in one interface. When a request fails, drill into the persistent history to see status codes, affected models, latency, and redacted failure evidence without exposing raw response bodies. The cost analytics engine breaks down token consumption and estimated spend by model, provider, account, API key, project, channel, and time range while tracking input, output, reasoning, cache, and service-tier pricing semantics separately. Model prices sync automatically from models.dev with LiteLLM and OpenRouter fallbacks, and you can add local overrides for aliases or internal models. For teams running Codex or xAI accounts, the health inspector reads quota windows, reset evidence, credential state, and workspace status on a configurable schedule, routing credential failures into an action queue for review rather than letting them silently degrade throughput. Deploy the Lightweight Panel to replace your existing CPA management UI without adding another service, or run Full Mode as a single Docker container that adds the Manager Server with persistent SQLite storage for request history, historical analytics, and automated account inspections. Export or import request history as JSONL for external analysis, and back up the SQLite files alongside your encrypted management keys. Running on a dedicated VPS on RepoCloud with guaranteed CPU, RAM, and SSD, full root SSH access, and a browser serial console. MIT licensed.
Bugsink
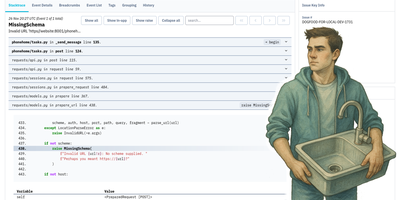
Bugsink has earned over 1,800 GitHub stars as the lightweight self-hosted error tracking platform that replaces Sentry without per-event billing by accepting error reports from any Sentry-compatible SDK across Python, JavaScript, Node.js, Ruby, Java, PHP, Go, and every other language Sentry supports. Simply update the DSN in your existing Sentry configuration and Bugsink captures the same stack traces, local variables, request context, and breadcrumbs that Sentry processes, displayed through a focused interface designed for debugging rather than dashboarding. Automatic issue grouping collapses duplicate error events into single actionable issues based on exception type, message, and stack frame context, turning thousands of raw events into a manageable list. Issue status tracking supports resolved, resolved-in-next-release, and muted states with automatic regression detection when resolved issues recur. Release tracking associates events with deploy versions to correlate error spikes with specific rollouts. Tag-based search filters issues by environment, release, user, browser, operating system, or any custom key-value pair sent by the SDK. Alerting notifies your team through Slack, Discord, Mattermost, and email when new issues appear or resolved issues regress, with per-project webhook configuration and user-level notification preferences. Per-project retention policies with automatic event eviction manage storage growth. A REST API with OpenAPI documentation enables custom integrations and dashboards. Source map support links minified JavaScript to original source. Deploy via Docker with the bugsink/bugsink image. Running on a dedicated VPS on RepoCloud with guaranteed CPU, RAM, and SSD, full root SSH access, and a browser serial console. PolyForm Shield licensed.
Langfuse
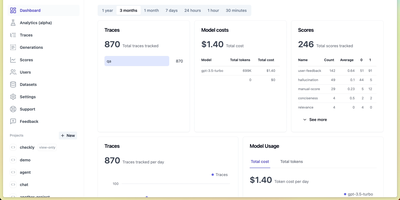
Backed by Y Combinator and trusted by over 2,300 companies processing billions of observations monthly, Langfuse is the most widely adopted open-source platform for building, monitoring, evaluating, and debugging LLM applications. The hierarchical tracing engine captures every LLM call, tool invocation, retrieval step, and agent action as nested spans based on OpenTelemetry, with automatic cost calculation, latency tracking, and token usage attribution across sessions and users. Prompt Management separates prompts from code with versioned artifacts, label-based deployments, one-click rollbacks, and runtime SDK fetching with server-side caching, while linking every generation back to its exact prompt version for attribution analytics. The evaluation system supports LLM-as-a-judge scoring, heuristic code evaluators, user feedback collection, and manual annotation workflows that run automatically on production traces or against curated datasets. The Playground enables interactive prompt testing on real production inputs with side-by-side model comparison across providers. Datasets and Experiments define test cases for systematic benchmarking with comparative result visualization. Native SDKs for Python and TypeScript provide decorator-based instrumentation, while 100+ integrations cover LangChain, LlamaIndex, OpenAI SDK, LiteLLM, Vercel AI SDK, and any OpenTelemetry-instrumented framework. The analytics dashboard surfaces cost breakdowns, quality scores, latency percentiles, and usage trends across models and prompt versions. Running on a dedicated VPS on RepoCloud with guaranteed CPU, RAM, and SSD, full root SSH access, and a browser serial console. MIT licensed.