Zabbix
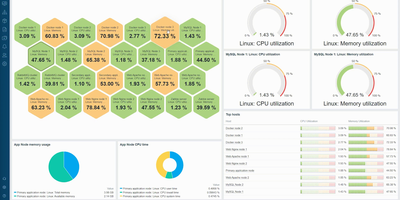
Monitoring everything from network switches to Kubernetes clusters since 2001 with over 6,200 GitHub stars and deployments exceeding 100,000 devices per installation, Zabbix has established itself as one of the most mature and feature-rich open-source monitoring platforms available, trusted by organizations including Dell, Salesforce, ICANN, and T-Mobile. The platform collects metrics from virtually any source using Zabbix Agent written in C, Zabbix Agent 2 written in Go with native plugin support, SNMP v1/v2c/v3 polling and trapping, IPMI for hardware health, JMX for Java applications, SSH and Telnet checks, HTTP/HTTPS polling, and ODBC database queries. Version 7.0 LTS introduced synthetic browser monitoring that executes user-defined JavaScript via WebDriver to simulate multi-step user interactions on websites, proxy load balancing with automatic host redistribution across proxy groups for high availability, in-memory proxy data buffering delivering up to 100x performance improvement, native multi-factor authentication with TOTP and Duo support, and just-in-time user provisioning from SAML and LDAP. Low-level discovery automatically detects file systems, network interfaces, SNMP OIDs, VMware resources, and Kubernetes pods, creating monitoring items and triggers dynamically. The alerting engine correlates events with configurable escalation chains, sending notifications through Slack, Microsoft Teams, PagerDuty, Jira, email, and SMS with customizable message templates. Over 1,000 official templates provide instant monitoring for Linux, Windows, VMware, AWS, Azure, Docker, PostgreSQL, MySQL, Apache, Nginx, and hundreds more. Running on a dedicated VPS on RepoCloud with guaranteed CPU, RAM, and SSD, full root SSH access, and a browser serial console. AGPL-3.0 licensed.
Checkmate
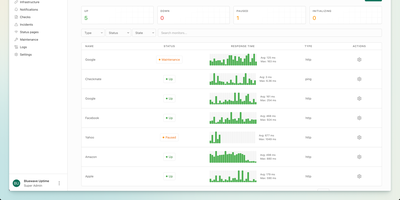
With 10,400 GitHub stars, 153 contributors, and no per-monitor pricing to worry about, Checkmate delivers comprehensive infrastructure monitoring from a single self-hosted dashboard — tracking uptime, page speed, server hardware, Docker containers, and even game servers without sending a byte of telemetry off your network. Ten monitor types cover HTTP, ping, TCP, gRPC, WebSocket, DNS, SSL certificate expiry, Docker container health, Lighthouse page speed with Core Web Vitals tracking, and game server status for over 100 server types including Minecraft and CS2. The Globalping integration enables geo-distributed monitoring from six continents, running ping and HTTP checks from Africa, Asia, Europe, North America, South America, and Oceania with results plotted on an interactive map. The optional Capture agent written in Go collects CPU, RAM, disk usage, temperature, and network metrics from any Linux, Windows, Mac, or Raspberry Pi host. Public status pages ship with four built-in themes and custom branding support, showing per-service uptime bars and incident history on a single shareable URL. Alert notifications reach teams through email, Discord, Slack, PagerDuty, Microsoft Teams, Telegram, Matrix, ntfy, Twilio SMS, and webhooks. Deploy via a single Docker Compose file requiring roughly 1 GB RAM — up and running in under five minutes on any Docker host. Running on a dedicated VPS on RepoCloud with guaranteed CPU, RAM, and SSD, full root SSH access, and a browser serial console. AGPLv3 licensed.
Graylog
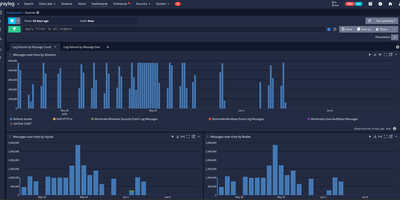
Trusted by over 60,000 organizations worldwide with more than 8,100 GitHub stars since 2010, Graylog has established itself as one of the fastest paths from raw log data to operational visibility, delivering centralized log management, security analytics, and compliance auditing through a purpose-built web interface with sub-second search at scale. The platform ingests logs from virtually any source via syslog, GELF, Beats, raw TCP/UDP, HTTP, CEF, IPFIX, and Netflow protocols, processing each message through configurable pipelines that parse fields, apply transformations, enrich events with GeoIP data from MaxMind or IPinfo lookup tables, and route messages to appropriate streams based on content rules. OpenSearch handles full-text indexing and storage with dynamic shard sizing that automatically calculates appropriate sizes from available node memory, while MongoDB stores configuration metadata including user accounts, roles, dashboards, alert rules, and pipeline definitions. The alerting system integrates with Slack, PagerDuty, and email with customizable notification templates and Replay Search links for immediate investigation context. Version 7.0 introduced MCP server integration for connecting preferred LLMs to perform AI-assisted log analysis and automation, while version 7.1 added Sigma detection rule import from private GitHub, GitLab, and Bitbucket repositories for detection-as-code workflows. The Sidecar agent management system centrally configures and deploys Filebeat, Winlogbeat, and nxlog collectors across infrastructure from the Graylog web interface. Running on a dedicated VPS on RepoCloud with guaranteed CPU, RAM, and SSD, full root SSH access, and a browser serial console. SSPL licensed.
Komodo
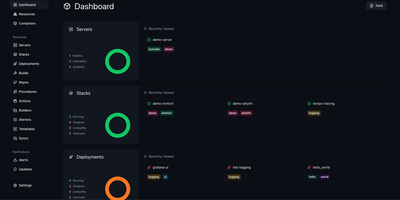
Komodo puts every server, container, and deployment pipeline behind a single dashboard where you build, ship, and monitor Docker workloads across unlimited hosts. Lightweight stateless agents install on each connected server and report CPU, memory, and disk metrics back to the Rust-powered core, giving you real-time visibility without heavyweight monitoring stacks. Docker Compose stacks deploy directly from the UI or link to Git repositories with webhook-triggered automatic redeploys on push. A built-in CI pipeline compiles versioned Docker images from source, with optional AWS spot instances for burst build capacity. For orchestration at scale, Docker Swarm management handles node configuration, service deployment, and multi-node stack orchestration from the same control plane. Browser terminal sessions open persistent named shells on servers and inside containers, complete with shared team access and scriptable Actions that chain executions into multi-stage procedures. Infrastructure-as-code support defines all resources declaratively in TOML files within a Git repository, keeping production state version-controlled and auditable. Granular role-based access control with user groups, per-resource permissions, and OAuth through GitHub and Google keeps teams operating within defined boundaries. A full OpenAPI specification, dedicated CLI, and typesafe client libraries for Rust and TypeScript make programmatic integration straightforward. With 12,000+ stars and active development, the community continues expanding multi-architecture builds and Swarm tooling.
Pythia
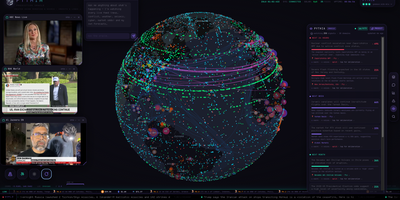
With over 400 GitHub stars and growing, Pythia transforms a local LLM into a self-calibrating geopolitical oracle that watches the entire planet and predicts what happens next — no API keys, no cloud, no cost. The Osiris-based Three.js globe frontend streams 30+ concurrent live feeds including GDELT geopolitics, armed conflict events, USGS earthquakes, NWS storm polygons, EONET disasters, FIRMS wildfires, Polymarket crowd odds, cryptocurrency and commodity prices, UNHCR displacement data, WHO disease outbreaks, and WFP food insecurity indicators. The FastAPI backend fuses these heterogeneous sources into a unified world brief, pipes it through Ollama, and generates located predictions across 24-hour, weekly, monthly, and yearly horizons — each carrying a probability, reasoning, and geocoordinates that fly the globe to the event. A council of four specialist swarm agents — Strategist, Economist, Naturalist, and Skeptic — re-scores every forecast, surfacing consensus, dissent, and splits through Brier-weighted voting where historically accurate personas earn louder votes. The engine maintains a persistent ledger graded by an LLM judge against archived world state, producing running Brier scores and calibration charts. Signal rules fire browser notifications and webhooks when conditions match, a morning brief digest summarizes overnight changes, and the agent API at port 8088 delivers the complete world view in a single JSON call compressed to approximately 50 tokens for AI agent consumption. Running on a dedicated VPS on RepoCloud with guaranteed CPU, RAM, and SSD, full root SSH access, and a browser serial console. MIT licensed.
Huginn
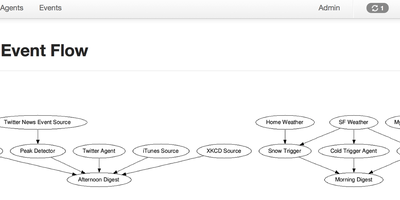
Huginn has established itself as the definitive open-source automation engine for developers who refuse to hand their workflow data to third-party cloud services. The platform lets you build agents that scrape websites, monitor RSS feeds, track weather via APIs, watch Twitter streams, aggregate news, detect price changes, and trigger notifications through email, SMS via Twilio, Slack webhooks, or social media posts to Twitter and Tumblr. Each agent creates and consumes JSON events, propagating them along a directed graph where complex multi-step workflows emerge from simple single-purpose components. The web interface provides visual agent management with drag-and-drop scenario building, real-time event logs, scheduling controls, and a built-in agent library covering dozens of use cases out of the box. Huginn supports Liquid templating for dynamic event transformation, regex-based content extraction, JavaScript-based data manipulation, and HumanTaskAgent for crowd-sourced workflow steps. Custom agents can be packaged as Ruby gems and loaded via the ADDITIONAL_GEMS environment variable without modifying core code. Deployment options include Docker with the official huginn/huginn all-in-one image or huginn/huginn-single-process for production multi-container setups with PostgreSQL or MySQL backends, plus native support for Heroku and OpenShift PaaS platforms. Running on a dedicated VPS on RepoCloud with guaranteed CPU, RAM, and SSD, full root SSH access, and a browser serial console. MIT licensed.
OpenObserve
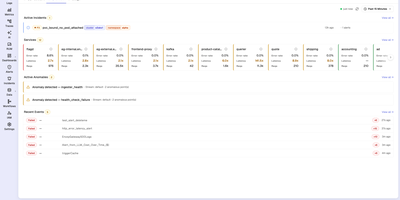
With 20,500+ GitHub stars and over 6,000 organizations running it in production — including a Fortune 100 company ingesting more than 4 PB per day — OpenObserve is the open-source observability platform that replaces your entire Datadog, Splunk, or ELK stack with a single Rust binary deploying in under two minutes. Apache Parquet columnar storage with zstd compression on S3-compatible object storage delivers 140x lower storage costs than Elasticsearch while providing better query performance on a quarter of the hardware. Ingest logs, metrics, and distributed traces via native OpenTelemetry OTLP endpoints with no vendor lock-in. Query logs and traces with standard SQL, metrics with SQL or PromQL — no proprietary query language to learn. The built-in dashboard builder offers 19 chart types including time-series graphs, heatmaps, gauges, tables, and top-K lists with drag-and-drop layout combining data from all signal types. Data pipelines process, enrich, redact, or normalize ingestion streams using Vector Remap Language for real-time transformations including PII redaction and logs-to-metrics conversion. Real User Monitoring captures frontend performance with session replay. The Service Catalog provides topology-based trace analysis with side-panel drill-downs into database queries and error details. Alerting supports real-time and scheduled rules with SQL and PromQL conditions. Native multi-tenancy isolates organizations and streams with complete data separation. Running on a dedicated VPS on RepoCloud with guaranteed CPU, RAM, and SSD, full root SSH access, and a browser serial console. AGPLv3 licensed.
SerpBear
Unlimited domains, unlimited keywords, daily Google position checks with stored history and trend charts: SerpBear is an open-source search engine rank tracker. Retrieval works through your choice of third-party SERP APIs - ScrapingAnt, ScrapingRobot, SerpApi, SearchApi, HasData - or your own proxy IP pool, and a flexible scrape-strategy system (Basic, Custom, or Smart, set globally or per domain) works around Google's removal of the 100-results-per-page parameter by choosing how many pages to check per keyword. Google Search Console integration adds real visit counts, impressions, and click-through rates per tracked keyword and surfaces top-performing pages and countries; Google Ads integration supplies monthly search volumes and auto-generates keyword ideas from your site's content. Email notifications report position changes daily, weekly, or monthly, a built-in REST API feeds dashboards and reporting tools, and data exports to CSV. Built with Next.js on SQLite, deployed via Docker, installable as a PWA on mobile - with no per-keyword or monthly SaaS fees.
Checkcle
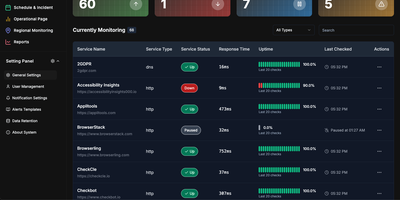
CheckCle provides a complete uptime monitoring and infrastructure observability platform that deploys with a single Docker container and stores all data in embedded SQLite via PocketBase. The Go backend runs three microservices — a service operation engine handling HTTP, HTTPS, DNS, Ping, and TCP checks at configurable intervals, a distributed regional check agent for multi-location network testing, and a server monitoring agent collecting CPU, RAM, disk usage, and network metrics via gRPC. The React frontend built with Vite, TypeScript, Tailwind CSS, and shadcn-ui subscribes to PocketBase WebSocket endpoints for real-time dashboard updates without polling. SSL and domain monitoring tracks certificate issuers, expiration dates, days remaining, and validation status. The incident management system records UP, DOWN, WARNING, and PAUSE states with full history, while scheduled maintenance windows prevent false alerts during planned downtime. Public status pages provide external stakeholders with live service health information. Health heatmaps visualize uptime performance and outage patterns over time. Notification channels include email, Telegram, Discord, and Slack, with multiple alert targets per monitored service. The one-click agent installation script supports Debian, Ubuntu, CentOS, Red Hat, Alpine, and Windows in beta. Docker deployment runs on port 8090 with a single persistent volume at /mnt/pb_data, requiring minimum 1 vCPU and 500MB RAM. On RepoCloud, deploy CheckCle on a dedicated VPS with root SSH access, persistent storage for your monitoring database, and complete control over agent endpoints and notification configurations, all under the MIT license.
Web-Check
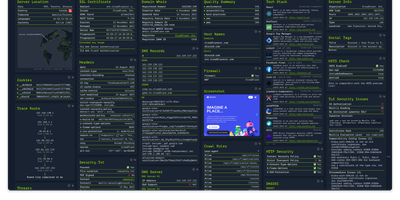
Enter a URL and get a dashboard of everything publicly discoverable about its security posture, server architecture, and technology stack: Web-Check is an all-in-one OSINT tool for analyzing any website. One scan surfaces IP info and server location, the full SSL certificate chain with issuing authority and validity, DNS records (A, MX, NS, CNAME, TXT) with DNSSEC status, HTTP response headers interpreted for security directives like HSTS, CSP, and X-Frame-Options, cookies and their flags, WHOIS domain info, robots.txt crawl rules, a sitemap-derived page map, the redirect ledger, open ports, traceroute, detected technologies, third-party trackers, associated hostnames, site performance, and even carbon footprint. Each card explains what the data means and why it matters, which makes the tool double as a security education resource - junior engineers learn headers and attack surfaces by scanning real sites. Practical uses span pre-deployment security audits (catch missing headers and misconfigurations before they ship), privacy compliance checks (identify trackers and cookie behavior for GDPR work), competitive tech-stack research, and network debugging via DNS and redirect inspection. Built by Lissy93 in TypeScript, it deploys as a single Docker container, and self-hosting keeps your reconnaissance targets and audit activity off third-party services.
UptimeKuma
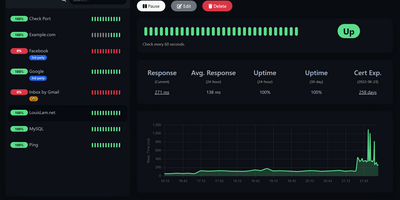
Sixty-thousand-plus GitHub stars make Uptime Kuma the most popular self-hosted monitoring tool - MIT-licensed, Node.js, and the standard replacement for UptimeRobot, Pingdom, and Freshping. It watches a dozen monitor types: HTTP(S) endpoints with keyword and JSON-query content validation, TCP ports, ICMP ping, DNS records, WebSockets, Docker containers via the socket, Steam game servers, MQTT brokers, gRPC services, and push-based heartbeats for cron jobs and internal workers. Checks run at intervals as tight as 20 seconds - versus UptimeRobot's 5-minute free tier - with unlimited monitors and unlimited data retention. When something fails, alerts fan out through 90+ notification channels: Slack, Discord, Telegram, email with LiquidJS templating, PagerDuty, OpsGenie, ntfy, Gotify, Matrix, and dozens more via native providers plus the Apprise library. Unlimited public or password-protected status pages - mappable to specific domains and organized into monitor groups - communicate health to customers, with maintenance windows that suppress alerts during planned work. The reactive dashboard graphs response times, tracks SSL certificate expiry with advance warnings, supports proxies and 2FA, and ships in dozens of languages. One Docker container with a SQLite volume covers an entire infrastructure.
IRONSIGHT
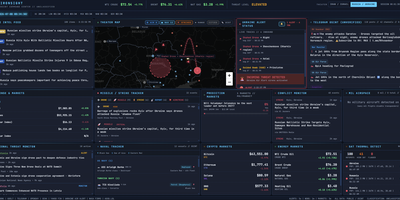
IRONSIGHT fuses over 50 publicly available intelligence sources into a single real-time dashboard that requires zero API keys and zero configuration. The Live Intel Feed aggregates 20+ RSS news sources with keyword relevance filtering from outlets including Reuters, Al Jazeera, and Kyiv Post. The Telegram OSINT module scrapes 27 channels every 60 seconds with automatic translation from Hebrew, Arabic, and Farsi. The interactive Leaflet Theater Map plots military aircraft positions via ADS-B transponder data, naval vessel locations in the Persian Gulf and Eastern Mediterranean, strike markers extracted from news and Telegram, missile trajectory arcs with range rings, and country-border overlays with a distance measurement tool. A header toggle switches the entire dashboard between Iran/Israel and Russia/Ukraine theaters, re-pointing every panel, map layer, and data feed to the selected conflict. The Israel Alert module streams live Pikud HaOref missile alerts with audio notifications, while the Conflict Monitor categorizes events into strikes, defense, diplomatic, and nuclear. Financial panels track defense contractor stocks, S&P 500, VIX, gold, Bitcoin, Ethereum, energy commodities via Yahoo Finance, and Polymarket prediction odds on conflict outcomes. NASA FIRMS satellite thermal detection flags fire and explosion signatures. The Next.js 16 App Router handles server-side data fetching for RSS and API endpoints while client-side React state management drives real-time polling updates. On RepoCloud, deploy IRONSIGHT on a dedicated VPS with persistent storage, root SSH access, and full control over your intelligence monitoring environment, all under the MIT license.
Gotify
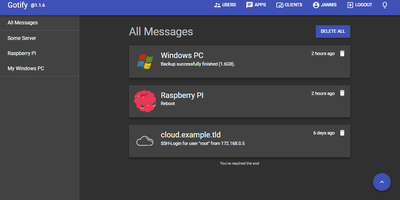
Real-time alerts from your own infrastructure to your phone, with no Firebase, Pushover, or third-party push service in the path: Gotify is a simple, self-hosted notification server written in Go. The model is deliberately minimal: senders push messages with a single HTTP POST to the REST API, receivers subscribe over a WebSocket stream, and a clean React web UI manages the pieces. Senders are namespaced as "applications," each with its own token, so your backup script, Uptime Kuma, CI pipeline, and cron jobs each get an identity, an icon, and independently revocable credentials - centralized alerting from many services with per-source management. Messages carry a title, body, and priority level that maps to notification importance on the client. The official Android app (on both F-Droid and Google Play, notable for working entirely without Google Play Services) shows push notifications for new messages; the web UI itself supports Web Push in the browser; and gotify/cli pushes messages from shell scripts with one command. A server-side plugin system adds custom behavior, and the whole thing runs as a single small binary with SQLite by default - near-zero resource footprint. Because dozens of tools (and Apprise) speak Gotify natively, it slots in as the notification hub for an entire homelab or ops stack.
Healthchecks
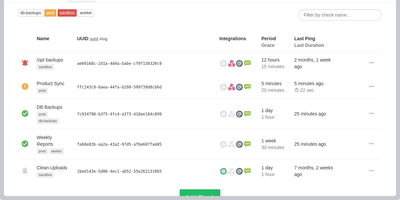
With 10,100+ GitHub stars and 75 releases over a decade of continuous development, Healthchecks is the open-source cron job monitoring service that catches failures your other monitoring tools miss — the jobs that silently stop running, the backups that never completed, the nightly reports that disappeared without error. The dead man's switch architecture requires zero agent installation: your cron jobs, scripts, and services ping a unique URL via HTTP request or email, and Healthchecks alerts you only when a ping does not arrive within the configured Period and Grace Time window. Each check supports cron expression scheduling, optional start, success, and failure signals for measuring execution time, and HTTP body keyword filtering for intelligent alert routing. Twenty-five notification integrations cover every channel teams actually use: Slack, Discord, Microsoft Teams, PagerDuty, Opsgenie, Splunk On-Call, Telegram, Signal, WhatsApp, SMS, email, webhooks, GitHub Issues, Pushover, ntfy, Gotify, Matrix, Mattermost, Zulip, Pushbullet, PagerTree, Spike.sh, and Trello. The web dashboard provides a visual grid showing real-time status with color-coded badges and per-check integration toggles. Monthly, weekly, and daily email reports summarize uptime trends with checks sorted by downtime duration. Team management supports projects with member roles and read-only access. Prometheus metrics expose check health and grace state for Grafana dashboards. WebAuthn and TOTP two-factor authentication secure accounts. Deploy via Docker images available for amd64, arm/v7, and arm64 architectures. Running on a dedicated VPS on RepoCloud with guaranteed CPU, RAM, and SSD, full root SSH access, and a browser serial console. BSD 3-Clause licensed.
Change Detection
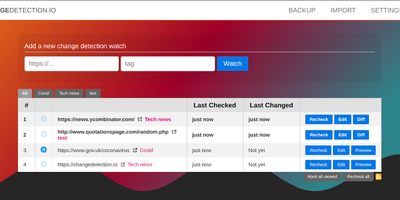
Price drops, restocks, job postings, government announcements, competitor edits - changedetection.io watches web pages and alerts you the moment anything changes, down to PDF text and checksums. Point it at a URL, set a check interval, and precise filters decide what counts as a change: a Visual Selector targets page elements by pointing and clicking, CSS selectors and XPath narrow scope, trigger-text and ignore-text rules (with regex support) cut noise, and JSONPath or jq handles API responses. A dedicated re-stock and price detection mode extracts product metadata and fires on thresholds - alert only when the price drops below your target or the percentage change exceeds a limit. JavaScript-heavy sites render through a real Chrome browser via Playwright, with the ability to execute JS steps first (log in, click, scroll) before extracting text. Notifications reach 85+ services through Apprise - Discord, Slack, Telegram, email, webhooks - optionally with a screenshot of the changed page, and AI-powered summaries (any OpenAI-compatible endpoint, including local Ollama) describe what changed. Per-watch proxies, custom headers, and POST/GET control cover hostile targets. Apache-2.0 licensed with local file-based storage: the URLs you monitor and why stay entirely your business.
xyOps
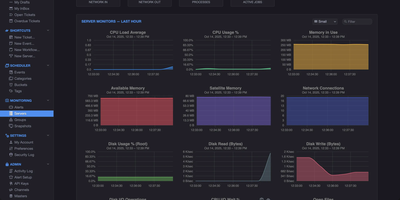
With 4,500+ GitHub stars and version 1.0.92 released August 2026, xyOps delivers a complete operations platform that unifies workflow automation, job scheduling, server monitoring, alerting, and incident response in one self-hosted system. The platform uses a distributed architecture where a central conductor coordinates lightweight xySat satellite agents running on Linux, macOS, or Windows worker nodes via persistent WebSocket connections. The visual workflow builder lets you chain events, triggers, actions, and monitors into multi-step pipelines with conditional logic, fan-out/fan-in parallelism, multiplex controllers for fleet-wide execution, and configurable resource limits. QuickMon provides per-second CPU, memory, disk, and network visibility streamed live to the web UI, while user-defined monitor plugins sample metrics every minute with time-series storage at hourly, daily, monthly, and yearly resolutions. Alert triggers evaluate expressions against live data and fire notifications via email, webhook, or custom actions, with full server snapshots attached showing every running process, network connection, and resource utilization at the moment of detection. Failed jobs and alerts automatically create tickets with linked logs, metrics history, and context for end-to-end incident tracking. The plugin marketplace supports extensions written in any language, and the Docker plugin enables container-based job execution. Deploy via Docker with persistent volumes on port 5522 for the web UI and 5523 for API access, running on a dedicated VPS on RepoCloud with guaranteed CPU, RAM, and SSD, full root SSH access, and a browser serial console. BSD-3-Clause licensed.
OpenStatus
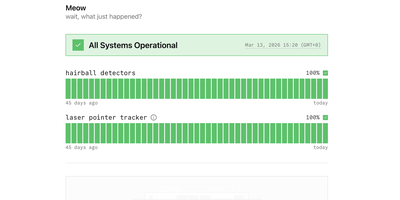
Trusted by Cal.com, WhiteBIT, and Documenso and backed by 8,800+ GitHub stars, OpenStatus delivers the open-source status page and uptime monitoring platform that replaces Atlassian Statuspage, Better Stack, and Instatus with a single self-hosted deployment. The monitoring engine runs Go-based probes across 28 global regions on three cloud providers checking HTTP, TCP, and DNS endpoints in parallel with configurable intervals and multi-region consensus to eliminate false-positive alerts. Status pages ship with custom domain support, password and email-domain access controls, maintenance windows, grouped monitor components, and subscriber notifications via email and RSS. Incident management provides structured status reports with investigating, identified, monitoring, and resolved timeline phases that publish automatically to affected status pages. The monitoring-as-code workflow supports YAML configuration synced through the CLI, a GitHub Actions integration for CI/CD pipelines, and a Terraform provider for infrastructure-as-code deployments. The typed ConnectRPC JSON-over-HTTP API exposes a published OpenAPI specification with a Node SDK for programmatic access, while an MCP server connects AI assistants like Claude, ChatGPT, and Cursor directly to workspace data. The tech stack combines Next.js with shadcn/ui for the dashboard, Hono for the API server, Drizzle ORM over Turso for application data, and Tinybird for analytics. Private monitoring locations deploy as a single 8.5MB Docker image behind firewalls to check internal services. Running on a dedicated VPS on RepoCloud with guaranteed CPU, RAM, and SSD, full root SSH access, and a browser serial console. AGPL-3.0 licensed.
Swetrix
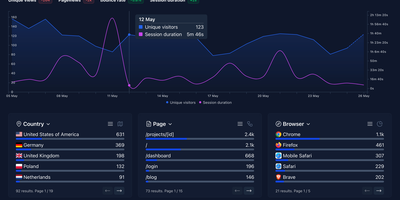
Traffic analytics, real-user performance monitoring, and client-side error tracking - normally three tools - in one cookieless, privacy-first dashboard: Swetrix. The Community Edition ships the same core engine as the cloud product - a NestJS API with ClickHouse for high-volume event storage, MySQL for relational data, and Redis for caching, fronted by a React dashboard and a ~5 KB tracking script with official packages for 20+ frameworks including Next.js, WordPress, and Shopify. Traffic analytics cover pageviews, referrers, UTM campaigns, geolocation, sessions with page flows, funnels, and custom events - all anonymized server-side with no cookies, no cross-device tracking, and no consent banner required for GDPR compliance. Performance monitoring records real-user metrics per pageview: TTFB, DNS and TLS timing, and render times, so regressions surface in the same place as traffic. Error tracking captures unhandled JavaScript exceptions automatically with formatted stack traces, filename/line metadata, affected browsers and pages, first/last-seen timestamps, and a resolve workflow - replacing a separate error monitoring subscription for many teams. Alerts fire to email, Slack, Telegram, Discord, or webhooks on traffic spikes, new errors, and custom events. If Plausible covers your traffic questions but you also want to know why the site broke, Swetrix answers both.