Emoncms
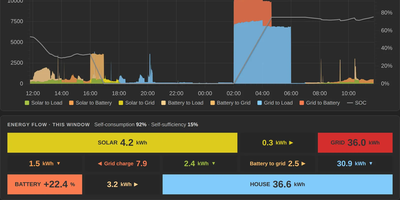
Energy meters, solar systems, heat pumps, and temperature sensors report to Emoncms, which logs every reading as a time series and turns it into graphs, dashboards, and ready-made apps. Readings arrive over an HTTP input API, MQTT topics beneath emon/, or AES-encrypted posts for devices without HTTPS, from scripts, Node-RED, Home Assistant, or emonHub. Input processing calibrates values, combines inputs, converts watts to cumulative kilowatt-hours, and logs the result to a feed. Device templates configure known hardware in one step, and schedules limit processes to set time windows. The graph viewer plots feeds on two axes, groups them into daily, weekly, monthly, or annual bars, and offers feed statistics and CSV export. Virtual feeds calculate values like heat pump COP on request and store nothing; post processing rebuilds feeds from recorded data. My Electric Flow charts live solar, battery, and grid power with an energy-flow breakdown and a Tariff explorer for Octopus Agile and other time-of-use tariffs. My Heatpump reports COP and SCOP. Other apps cover boilers, solar diversion, CO2 air change rates, and the UK grid fuel mix. The dashboard editor places dials, gauges, thermometers, charts, text, and images, and a dashboard can be made public. Sync uploads feeds to another server on a schedule and downloads them for recovery; the Backup module backs up and restores data. Running on a dedicated VPS on RepoCloud with guaranteed CPU, RAM, and SSD, full root SSH access, and a browser serial console. AGPL-3.0 licensed.
Deploy