LangWatch
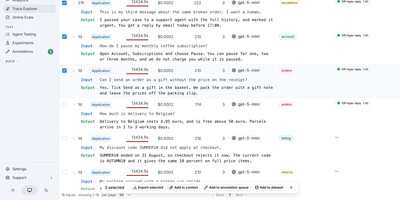
Every call your AI agents make becomes a searchable trace in LangWatch, and the same platform tests and scores those agents before a new prompt or model reaches users. The Trace Explorer filters by origin, user, model, cost, and evaluator, reads each run as a waterfall, flame graph, topology, or sequence diagram, and takes traces from the Python, TypeScript, and Go SDKs or any OpenTelemetry source. Agent Testing sends simulated users, in text or beta voice calls, through your agent while a judge passes or fails every criterion with its reasoning, adds multi-turn red teaming, and compares two agents side by side. The Experiments workbench scores prompts and agents on datasets with LLM judges, exact match, and RAG checks, then compares runs on cost, latency, and pass rate, while online evaluations monitor live traffic and guardrails block unsafe replies. Prompts keep version history and staging or production tags, Workflows wire prompts, Python code, and HTTP calls on a visual canvas, and annotation queues route traces to human reviewers. Alerts fire when a graph crosses a threshold, automations post to Slack, email, or webhooks, and scheduled reports go out by email or Slack. Claude Code, Codex, Copilot, Gemini CLI, and opencode report session cost, pull request cost, and terminal replays, and an MCP server exposes trace search and prompt management to coding assistants. Running on a dedicated VPS on RepoCloud with guaranteed CPU, RAM, and SSD, full root SSH access, and a browser serial console. Apache-2.0 licensed.
Opik
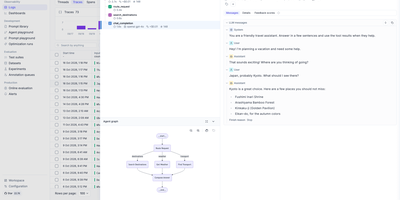
When an AI agent goes wrong at step seven of twelve, Opik, an open-source LLM observability platform, shows the exact trace, tool call, and prompt behind it, then scores your fix against test datasets. Full trace trees capture every LLM call, retrieval step, and tool execution, and you can annotate traces and spans with feedback scores in the UI or through the SDK. Native integrations for OpenAI, Anthropic, LangChain, LlamaIndex, CrewAI, Google ADK, and DSPy, plus OpenTelemetry for any language with an OpenTelemetry SDK, feed traces in, or add the @track decorator to your own functions. Datasets and experiments compare prompt and model versions, scored by LLM-as-a-judge metrics for hallucination, moderation, and RAG relevance, with a PyTest integration to run evaluations in CI. A Prompt Playground tests prompts across models, and the Agent Optimizer SDK helps improve prompts and agents. Production dashboards track feedback scores, trace counts, and token usage, online evaluation rules score live traces, and optional guardrails add safety checks. An MCP server lets Claude Code, Cursor, VS Code Copilot, Codex, or opencode read traces and run evaluations from chat. Run it yourself with the ./opik.sh script on Docker Compose, or a Helm chart on Kubernetes, so trace data stays in your infrastructure. Running on a dedicated VPS on RepoCloud with guaranteed CPU, RAM, and SSD, full root SSH access, and a browser serial console. Apache-2.0 licensed.

MLflow
Trusted by thousands of organizations with over 30 million monthly downloads and 20,000+ GitHub stars, MLflow is the largest open-source AI engineering platform providing end-to-end lifecycle management for traditional ML models, LLMs, and AI agents. The OpenTelemetry-based tracing system captures complete request flows through any LLM provider or agent framework — including OpenAI, LangChain, DSPy, Vercel AI, PydanticAI, and smolagents — with one-line auto-instrumentation that tracks inputs, outputs, token usage, and costs at every intermediate step. MLflow's evaluation engine offers 50+ built-in metrics and LLM judges for systematic quality assessment, detecting issues across correctness, latency, adherence, relevance, and safety dimensions before code reaches production. The Prompt Registry versions, tests, and deploys prompts with full lineage tracking while automated optimization algorithms improve prompt performance using evaluation feedback. The AI Gateway provides a unified API endpoint for all LLM providers, enforcing rate limits, cost controls, and access policies across the organization. MLflow 3.0 introduces the LoggedModel abstraction linking traces, metrics, and prompts to specific model versions across Python, TypeScript, Java, and R SDKs. The model registry manages deployment workflows with automated quality gates, while experiment tracking records parameters, metrics, and artifacts across training runs. Running on a dedicated VPS on RepoCloud with guaranteed CPU, RAM, and SSD, full root SSH access, and a browser serial console. Apache License 2.0 licensed.
CPA Usage Keeper
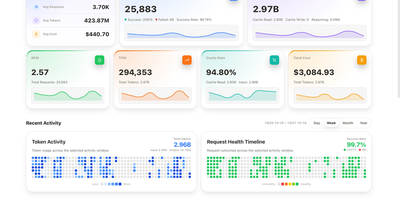
Somewhere between the third coding agent and the fifth model subscription, nobody can say where the tokens went. CPA Usage Keeper keeps the receipts for a CLIProxyAPI gateway, saving every request locally with scheduled backups so history survives restarts. The Overview page shows requests, success rate, tokens, cache hit rate, and estimated cost with sparklines and a calendar heatmap, and Realtime plots time to first token against total latency and shows rolling cache levels and model speed. Analysis breaks usage down by API key, model, credential, or provider with donut charts and ranked lists. The Request Events log filters by model, source, and status, adjusts its columns, and exports records. Credentials cards show success rates, remaining five-hour and weekly quotas, priorities, and enable switches, and quota history charts how many tokens and dollars each percentage point costs over a cycle. Individual API keys can be given a read-only usage view. Deployment uses a Docker Compose file that bundles CPA with Keeper or runs Keeper beside an existing gateway, and the interface switches between English and Chinese and between light and dark themes. Check the dashboard before the invoice arrives and see exactly who spent what. Running on a dedicated VPS on RepoCloud with guaranteed CPU, RAM, and SSD, full root SSH access, and a browser serial console. MIT licensed.
AxonHub
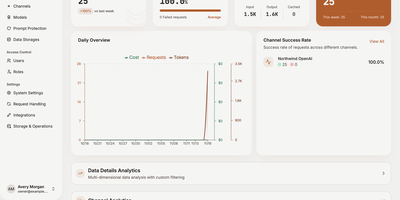
AxonHub is an open-source AI gateway that lets any OpenAI, Anthropic, or Gemini SDK reach more than 100 models through a single address. Point Claude Code, Codex, OpenCode, or your own scripts at one base URL, and the gateway translates each request for whichever provider sits behind the model name, so changing vendors means editing a string instead of rewriting code. Channels hold provider keys, model lists, weights, and health history, and load balancing with automatic failover sends traffic to the healthiest route. Chat, image generation, embeddings, and reranking all travel through the same endpoint. Every call lands in request logs with token counts, first-token latency, and cost, and traces group related calls into threads with a timeline of spans. A built-in playground tests one channel or the full gateway, prompt protection rules filter sensitive text before it leaves your network, and API keys can be limited by project, owner, or IP range. Roles and per-user usage tables keep teams apart. Running on a dedicated VPS on RepoCloud with guaranteed CPU, RAM, and SSD, full root SSH access, and a browser serial console. Apache-2.0 licensed.
Oh My CPA
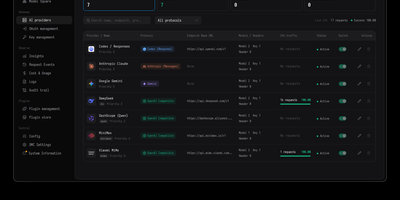
Oh My CPA gives a CLIProxyAPI gateway a proper control room, where providers, OAuth credentials, client keys, model routing, and the cost of every request are managed and watched from one self-hosted console. You add providers such as Codex, Claude, Gemini, xAI, DeepSeek, Vertex AI, and OpenAI-compatible services, each with credentials, retry and error policies, priority, weight, and an enable switch the gateway actually enforces. OAuth accounts are signed in from the console, with quota window readings, refresh schedules, and per-credential model aliases kept next to the keys they belong to. Client keys can be created, named, and revoked, and those names follow the traffic into request records and filters so you always know which key spent what. The dashboard follows request volume, token throughput, cache hit rate, and cost from the last fifteen minutes out to ninety days, with a year-long token heatmap for the long view. Insights compare keys, models, providers, and credentials against the previous period, while the live routing view shows which credential each request travelled to and whether it was rerouted. Every request stays searchable, with duration, time to first token, token breakdown, and the raw log in a detail drawer. A playground tests any routed model with text and images before your users do. Running on a dedicated VPS on RepoCloud with guaranteed CPU, RAM, and SSD, full root SSH access, and a browser serial console. MIT licensed.
Langfuse
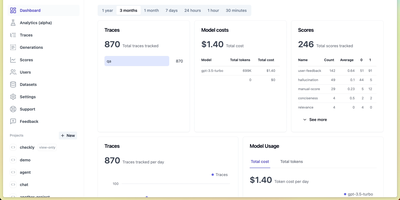
Backed by Y Combinator and trusted by over 2,300 companies processing billions of observations monthly, Langfuse is the most widely adopted open-source platform for building, monitoring, evaluating, and debugging LLM applications. The hierarchical tracing engine captures every LLM call, tool invocation, retrieval step, and agent action as nested spans based on OpenTelemetry, with automatic cost calculation, latency tracking, and token usage attribution across sessions and users. Prompt Management separates prompts from code with versioned artifacts, label-based deployments, one-click rollbacks, and runtime SDK fetching with server-side caching, while linking every generation back to its exact prompt version for attribution analytics. The evaluation system supports LLM-as-a-judge scoring, heuristic code evaluators, user feedback collection, and manual annotation workflows that run automatically on production traces or against curated datasets. The Playground enables interactive prompt testing on real production inputs with side-by-side model comparison across providers. Datasets and Experiments define test cases for systematic benchmarking with comparative result visualization. Native SDKs for Python and TypeScript provide decorator-based instrumentation, while 100+ integrations cover LangChain, LlamaIndex, OpenAI SDK, LiteLLM, Vercel AI SDK, and any OpenTelemetry-instrumented framework. The analytics dashboard surfaces cost breakdowns, quality scores, latency percentiles, and usage trends across models and prompt versions. Running on a dedicated VPS on RepoCloud with guaranteed CPU, RAM, and SSD, full root SSH access, and a browser serial console. MIT licensed.
Observal
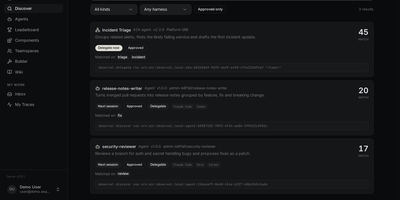
To pull a team's skills, MCP servers, hooks, prompts, and agent files out of scattered Git repositories, Observal keeps them in one reviewed registry and traces real sessions to show which ones help. Build an agent visually, with a live config preview for every harness. Submissions wait in an admin review queue, where reviewers inspect side-by-side version diffs before approving a release. Teamspaces give each team its own namespace, and approved releases can be forked into independent drafts. One pull command then writes the right config for Claude Code, Cursor, Kiro, Codex, Copilot, Pi, OpenCode, Antigravity, or Goose. Every approved resource is discoverable through the open Agentic Resource Discovery standard, and a running agent can hand part of its task to another approved agent or a remote Agent2Agent service. Hooks record each session as a trace of prompts, tool calls, MCP round trips, tokens, and errors, with turn-by-turn replay for debugging and audits. Insight reports, generated through providers such as Anthropic, OpenAI, or Ollama, list what is working, what is hindering, and quick wins. A dashboard follows adoption, cost, and department usage, a leaderboard ranks agents by downloads, and audit logs, SAML single sign-on, and SCIM provisioning are included. Running on a dedicated VPS on RepoCloud with guaranteed CPU, RAM, and SSD, full root SSH access, and a browser serial console. Apache-2.0 licensed.
AIUsage
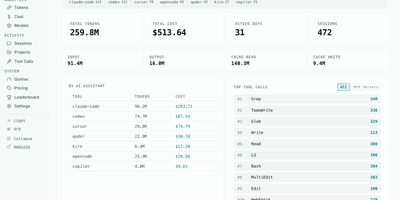
AIUsage shows where your AI coding spend actually went: it reads the session logs that Claude Code, Codex, Cursor, OpenCode, Copilot, Gemini CLI, and many other assistants leave behind, then turns them into one dashboard with tokens, estimated dollars, and activity. The Overview page totals tokens, cost, active days, and sessions for today, this week, this month, or all time, and filters by tool or device. Cost and Tokens pages chart daily spending and input, output, cache, and thinking usage, and Models ranks every model by share. The Sessions table lists duration, tool count, and cost per session, and a detail view walks through each API call and the tools it triggered. Tool Calls shows which built-in, MCP, and skill actions agents use most, Projects ranks directories by spend, and Quotas tracks subscription limits. Optional sync through GitHub, S3, R2, or MinIO merges several machines, and a public leaderboard accepts aggregate totals only. Running on a dedicated VPS on RepoCloud with guaranteed CPU, RAM, and SSD, full root SSH access, and a browser serial console. MIT licensed.