GPT Load
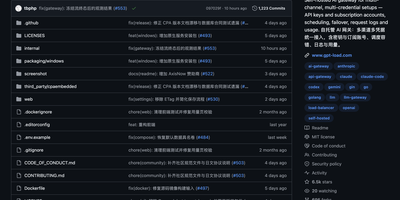
GPT Load has become the go-to self-hosted AI gateway for teams managing multiple LLM provider credentials behind a single URL. The Go-built proxy transparently preserves native API formats for OpenAI Chat Completions, OpenAI Responses, Anthropic Messages, and Google Gemini — applications swap one base URL and keep their existing SDK integration untouched. Twenty built-in channels cover official APIs (OpenAI, Anthropic, Gemini, xAI), cloud platforms (Azure OpenAI, AWS Bedrock, Google Vertex AI), model services (DeepSeek, Moonshot AI, SiliconFlow, Zhipu AI, Alibaba Cloud, Volcengine, OpenRouter, Groq), and subscription accounts (Codex, Claude, Antigravity, Grok) using the same credential management, scheduling, and health system. The intelligent key pool rotates among valid credentials using atomic counters for fair high-concurrency distribution, automatically blacklists failing keys after configurable thresholds, and recovers them via scheduled health checks — all transparent to clients. Weighted load balancing distributes traffic across multiple upstream endpoints while per-credential proxies route individual keys through different egress paths. The Vue 3 management dashboard provides real-time statistics, group configuration, key testing, request logs with full debugging context, per-model cost estimates, and route inspection. Docker deployment exposes the management interface and proxy on port 3001 with SQLite by default, MySQL or PostgreSQL optional, and Redis for distributed leader-follower cluster scaling. Running on a dedicated VPS on RepoCloud with guaranteed CPU, RAM, and SSD, full root SSH access, and a browser serial console. MIT licensed.
Traefik Manager
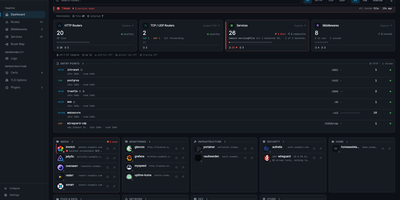
Where Traefik's built-in dashboard only shows what is running, Traefik Manager lets you change it: add routes, middlewares, and services from forms and wizards instead of editing YAML by hand. A first-run wizard connects to the Traefik API, creates a route for the manager itself, and sets the admin password. After that, the dashboard turns every route into a launchable app card with live health, and the Route Map draws each request from entry point through middlewares to backend. New routes use a slide-in form for HTTP, TCP, or UDP with several domains and backends, sticky sessions, and health checks. 30 middleware wizards handle authentication, rate limiting, headers, CORS, and redirects, and weighted, mirroring, or failover services can be built on their own. For day-to-day monitoring, the Certificates tab tracks expiry from acme.json, the Logs tab turns the access log into clickable analytics, the CrowdSec tab lists attacks and bans, and alerts reach Discord, Slack, ntfy, Telegram, and more. Changes to traefik.yml apply with a one-click restart, every edit is backed up locally and can be pushed to a git repository, and a lightweight agent brings remote Traefik servers into the same interface. Sign in with TOTP two-factor or OIDC single sign-on, in any of 14 languages. Running on a dedicated VPS on RepoCloud with guaranteed CPU, RAM, and SSD, full root SSH access, and a browser serial console. GPL-3.0 licensed.
KrakenD
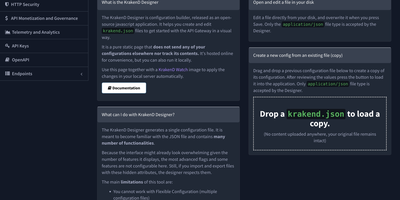
KrakenD processes over 18,000 requests per second on a single instance while consuming under 50MB of RAM at 1,000 concurrent connections, operating as a stateless API gateway that requires no database whatsoever. The Community Edition has earned over 2,600 GitHub stars by outperforming database-dependent alternatives like Kong and Tyk in independent benchmarks. Written entirely in Go, it uses declarative JSON or YAML configuration files that integrate directly into GitOps workflows for version-controlled infrastructure management. The gateway aggregates responses from multiple backend services into a single API call, transforms request and response payloads with field filtering, grouping, and mapping, and applies zero-trust security policies including JWT validation, OAuth 2.0, CORS, HSTS, clickjacking protection, and XSS prevention. Traffic management features include multi-layer rate limiting at both the router and proxy levels, circuit breakers for backend fault isolation, spike arrest policies, and concurrent call support that requests the same data from multiple backends in parallel for improved response times. Telemetry integrates with OpenTelemetry, Prometheus, Grafana dashboards, Datadog, Zipkin, and Jaeger for distributed tracing and metrics collection. The gateway extends through Go plugins, Lua scripting, Martian modifiers, and Google CEL expressions for custom request processing logic. AI workload routing supports OpenAI, Anthropic, Gemini, and other model endpoints with built-in fallback, retries, and load balancing. Deploy via Docker with the devopsfaith/krakend image as a single binary. Running on a dedicated VPS on RepoCloud with guaranteed CPU, RAM, and SSD, full root SSH access, and a browser serial console. Apache 2.0 licensed.
Kong
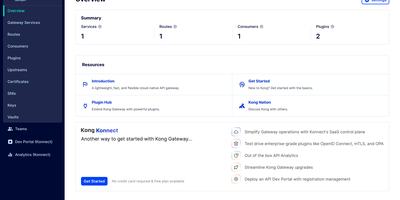
With over 43,000 GitHub stars and adoption by companies including Nasdaq, Samsung, and Expedia, Kong Gateway is the world's most deployed open-source API gateway, processing billions of API requests daily across hybrid-cloud and multi-cloud architectures. Built on the battle-tested NGINX engine with OpenResty's LuaJIT runtime, Kong delivers sub-millisecond proxy latency while supporting REST, gRPC, GraphQL, WebSocket, SOAP, and Kafka protocols. The plugin architecture includes authentication via JWT, Basic Auth, HMAC, key authentication, OAuth 2.0, and LDAP, alongside rate limiting with configurable windows per consumer, IP address, or API key. The AI Proxy plugin provides a universal LLM API that routes across OpenAI, Anthropic, Google Gemini, AWS Bedrock, Azure AI, Databricks, Mistral, and Hugging Face through a single standardized interface, while MCP proxy capabilities convert REST APIs into MCP tools and provide traffic governance for AI agents. Kong supports declarative configuration via YAML for GitOps workflows, a RESTful Admin API for dynamic configuration, and decK CLI for version-controlled infrastructure-as-code management. Upstream health checking with active and passive probes enables automatic failover, and the ring balancer distributes traffic across upstream targets with consistent hashing, round-robin, or least-connections algorithms. The Kong Plugin Hub hosts over 100 community and official plugins covering logging, monitoring, transformation, security, and traffic control. Running on a dedicated VPS on RepoCloud with guaranteed CPU, RAM, and SSD, full root SSH access, and a browser serial console. Apache 2.0 licensed.
Ferron
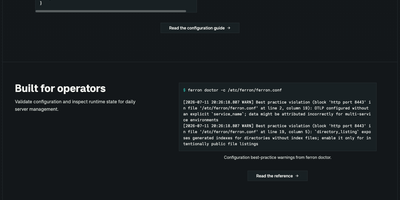
Ferron is a web server and reverse proxy that serves your sites and applications with automatic HTTPS, a configuration file you can read at a glance, and logs that explain exactly why a request failed. Declare a hostname with a root directive and it serves files from disk; swap in a proxy directive and the same block forwards traffic to your application on localhost, with PHP handled through one fcgi_php line to PHP-FPM. Every public hostname receives a TLS certificate automatically, issued and renewed without certificate paths or renewal scripts in your config. The differentiator is debugging: each request carries a trace ID printed in the access log, repeated in the error log lines it generates, and returned to the client inside JSON error responses, so one grep reconstructs the whole failure. The ferron doctor command validates a configuration before you reload it, pointing at the file, line, and column of each mistake and flagging violations like an overexposed directory listing. Its admin API answers /config and /status queries with live running state, and metrics and traces flow to Grafana or any OpenTelemetry collector through OTLP. Reverse proxying spreads requests across backend upstreams with health awareness and circuit breaker events you can watch live. HTTP/2 and HTTP/3 are on by default, and there are no worker counts or pool sizes waiting to be tuned. Running on a dedicated VPS on RepoCloud with guaranteed CPU, RAM, and SSD, full root SSH access, and a browser serial console. MIT licensed.
Apache APISIX
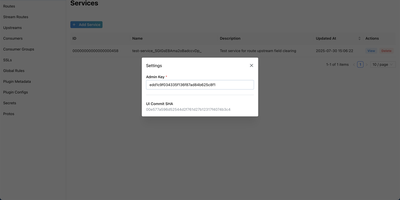
With 17,000 GitHub stars, 460+ contributors, and deployments across telecommunications, automotive, and financial services running on over 10,000 CPU cores at the largest known installations, Apache APISIX delivers a fully dynamic API gateway achieving 140,000 QPS on eight cores with sub-millisecond latency through NGINX's event-driven architecture and LuaJIT-compiled plugin execution. The 100+ open-source plugins cover authentication (JWT, OAuth 2.0, OIDC, Keycloak, LDAP), observability (Prometheus, Datadog, SkyWalking, OpenTelemetry), traffic management (rate limiting, circuit breaking, canary releases, traffic splitting), and security (CORS, IP restriction, CSRF protection) — all hot-reloadable without process restarts via etcd-based real-time configuration synchronization. Multi-protocol support handles HTTP, gRPC, MQTT, TCP, UDP, and WebSocket traffic for both north-south API access and east-west service mesh communication. AI gateway capabilities proxy requests to 20+ LLM providers with semantic caching, token-aware rate limiting, provider failover routing, and content moderation. Custom plugins extend the gateway in Lua, Go, Java, Python, or WebAssembly. Radixtree route matching handles 100,000+ routes without performance degradation. Functions as a Kubernetes ingress controller with native service discovery for Consul, Nacos, and Eureka. Deploy via Docker or Helm charts with horizontal scaling through etcd cluster coordination. Running on a dedicated VPS on RepoCloud with guaranteed CPU, RAM, and SSD, full root SSH access, and a browser serial console. Apache 2.0 licensed.
codex-lb
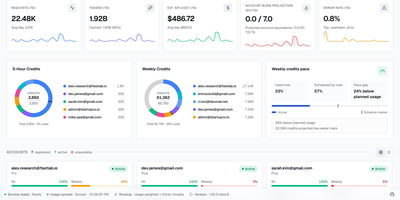
codex-lb turns a handful of ChatGPT accounts into one dependable endpoint for Codex CLI, OpenCode, OpenClaw, Hermes Agent, and any OpenAI-compatible client. Accounts join through an OAuth flow, and the dashboard shows each one's 5-hour and weekly quota as percent remaining, with reset times, plan, and a seven-day trend. Eight routing strategies, including capacity weighted, round robin, and sequential drain, pick an account per request, and sticky threads keep a session on the same account to preserve warm prompt caches. API keys carry expiry dates, model allowlists, reasoning-effort policies, per-account scoping, and token or cost limits per day, week, or month. Overview cards chart requests, tokens, cached share, estimated cost, error rate, and a weekly credit pace, and a searchable request log lists the model, transport, status, tokens, and cost of every call. A cost report breaks spend down by day, model, user agent, and account, with time to first token and tokens per second charts. Dashboard access is protected by a password with optional TOTP, a read-only guest mode, roles, and invites. Settings cover reset-credit handling, upstream proxy pools, model sources, a firewall, and a quota planner, and light and dark themes are built in. Running on a dedicated VPS on RepoCloud with guaranteed CPU, RAM, and SSD, full root SSH access, and a browser serial console. MIT licensed.
LLMIO
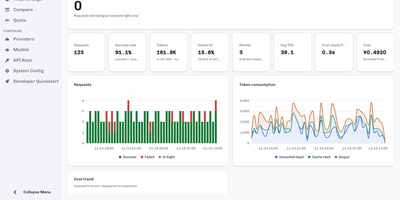
Every provider has its own API, quota, and price list, and LLMIO puts them all behind one door. Clients speak OpenAI Chat Completions, OpenAI Responses, Anthropic Messages, or Gemini, and a protocol bridge translates between OpenAI and Anthropic formats, including streaming events, when the upstream differs. Each model name maps to several providers with weights, a lottery or rotor load strategy, retry limits, and timeouts, and routing can follow tool calling, structured output, and image support. A per-model circuit breaker and rate-limit fallback keep one failing upstream from taking the rest down. The dashboard shows live requests, success rate, tokens, cache hits, retries, tokens per second, and cost, and analytics add trend, breakdown, latency, error, and model performance views with provider, key, and status filters. The request log records trace and session IDs with full request and response inspection, and a compare page lines up to six requests to show how a prompt cache builds. Access keys carry expiry dates, model allow-lists, and optional body logging. Quota sources, time-of-day pricing, and scheduled log cleanup round out the console. Running on a dedicated VPS on RepoCloud with guaranteed CPU, RAM, and SSD, full root SSH access, and a browser serial console. MIT licensed.
Paddler
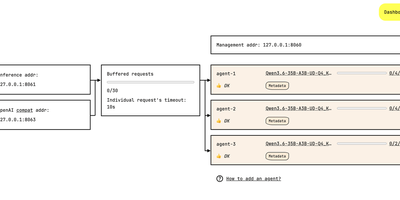
One binary. A fleet of machines. One calm endpoint for inference. Paddler balances large language model traffic across whatever hardware you already own, instead of renting tokens by the million. The balancer exposes an inference service, a management service, and a web admin panel from a single self-contained program. Agents on separate machines generate tokens and embeddings through slots, each carrying its own context and KV cache. Inference runs on the built-in llama.cpp engine, CPU or GPU. Need a different model? Swap it dynamically, no rebuild, no redeploy. Capacity follows demand: agents join the fleet when traffic grows and leave when it fades, and request buffering holds early work in a queue so scaling up from zero hosts drops nothing. Operators watch fleet health through observability metrics, configure models, chat templates, and inference parameters in the admin panel, and test prompts graphically before users ever see a change. A desktop edition drafts office workstations into service beside the rack servers. For medical, financial, or otherwise sensitive prompts, everything stays inside your own network, and predictable hardware replaces per-token pricing exposure. Running on a dedicated VPS on RepoCloud with guaranteed CPU, RAM, and SSD, full root SSH access, and a browser serial console. Apache License 2.0 licensed.
HAProxy Manager
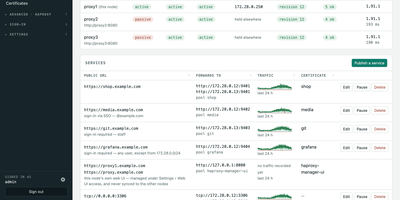
HAProxy Cluster Manager puts a web console on top of HAProxy, so you publish services, issue certificates, and cluster nodes from forms instead of hand-editing haproxy.cfg. Publishing a service takes two inputs, the public URL and the backend address, and the wizard builds the frontend, backend pool, host condition, routing rule, HTTPS listener, certificate, and HTTP redirect, with a preview of the exact configuration before anything applies. Every change is rendered and checked with haproxy -c before it is written, and a failed reload rolls back to the previous file automatically. Certificates come from Let's Encrypt through acme.sh, using HTTP-01 or DNS-01 with about 190 DNS providers, and renewals reload HAProxy and push the new certificate to every node on their own. Any number of nodes share one virtual IP through Keepalived: configuration and certificates sync between them, only the node holding the address is editable, and the dashboard flags split brain, an unclaimed virtual IP, or a node running stale configuration. You can gate services behind basic sign-in or OIDC single sign-on enforced by HAProxy itself, watch traffic statistics and logs, take transition alerts by email, Pushover, or webhook, and expose Prometheus metrics and Home Assistant entities. Running on a dedicated VPS on RepoCloud with guaranteed CPU, RAM, and SSD, full root SSH access, and a browser serial console. GPL-3.0 licensed.
Codex LB Enhanced
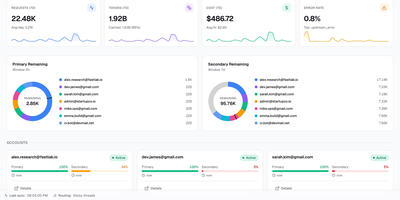
Codex LB Enhanced is a session-aware gateway that pools your ChatGPT accounts so a long Codex session survives quota limits, dropped connections, and paused accounts without losing the conversation. It serves Codex desktop, CLI, and IDE clients through the native Responses protocol and WebSocket transport, and answers any OpenAI-compatible client through the familiar /v1 endpoints. When an account runs out of quota, gets suspended, times out, or drops mid-stream, the gateway classifies the failure, removes that account from the current request, and selects the next one through your load-balancing policy. Verified request history, including interrupted tool-call context, is replayed across the account switch when it is safe, so the client sees a slower answer instead of a dead stream. Every API key carries its own policy: time windows from five hours to monthly, limits by credits, tokens, or cost, and model-specific rules. Usage appears in native Codex quota headers and in a /v1/usage view backed by the same data, so editors and automation agree on what is left. Diagnostics correlate each request with its upstream account, transport, failover stage, and retry count, and a web dashboard manages accounts, keys, usage windows, request logs, and recovery reports. Running on a dedicated VPS on RepoCloud with guaranteed CPU, RAM, and SSD, full root SSH access, and a browser serial console. MIT licensed.