OneUptime
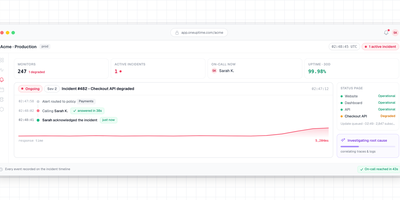
With 7,400+ GitHub stars and a feature set that replaces seven separate SaaS subscriptions — Pingdom for monitoring, StatusPage.io for status pages, PagerDuty for on-call, Incident.io for incident management, Datadog for APM, Loggly for logs, and Sentry for error tracking — OneUptime delivers every tool your reliability team needs in a single open-source platform that is genuinely 100% open source under Apache 2.0 (not open-core). Uptime monitoring runs synthetic checks against websites, APIs, ports, SSL certificates, and DNS records from distributed global probes with configurable intervals and thresholds. Branded status pages publish automatically when monitors detect issues, notifying subscribers via email, SMS, webhook, or RSS without manual intervention during an outage. On-call scheduling routes alerts through escalation policies to the right engineer via phone call, SMS, push notification, Slack, or Microsoft Teams. The incident management workflow handles declaration, triage, communication, resolution, and post-mortem generation in a unified timeline. APM collects traces and metrics via native OpenTelemetry integration — no proprietary agents required — while log management provides full-text search and alerting. An AI agent continuously monitors telemetry data, identifies root causes, and opens GitHub pull requests with proposed fixes for review. Deploy via Docker Compose or Kubernetes Helm charts with a Terraform provider for infrastructure-as-code configuration. Running on a dedicated VPS on RepoCloud with guaranteed CPU, RAM, and SSD, full root SSH access, and a browser serial console. Apache-2.0 licensed.
Grafana OnCall
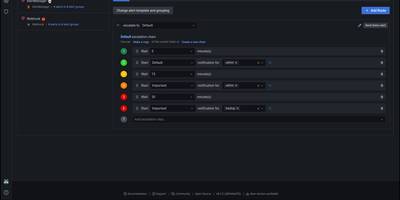
With 3,900 GitHub stars, 140 contributors, and 380 releases since its 2022 launch, Grafana OnCall delivers developer-friendly incident response that routes alerts from any monitoring system to the right engineer at the right time through the right channel. The platform accepts alerts via unique API URLs from Alertmanager, Grafana Alerting, Zabbix, Datadog, Pagerduty-compatible sources, Jira, inbound email, and generic HTTP webhooks, then applies routing templates to direct each alert to the appropriate escalation chain. Escalation chains define notification sequences — notify the primary on-call via Slack, wait 5 minutes, escalate to SMS and phone, wait 10 minutes, page the secondary on-call and notify the engineering manager — continuing until acknowledgment or resolution. On-call schedules support multi-layer rotations with overrides, shift swaps, and timezone-aware handoffs rendered directly inside Grafana dashboards. ChatOps integration publishes alert groups to Slack channels and Telegram groups with interactive buttons for acknowledge, resolve, and silence actions. Template engines based on Jinja2 control alert grouping, appearance rendering, and behavioral automation. The REST API enables programmatic management of integrations, schedules, and escalation policies. Deploy via Docker Compose with PostgreSQL, Redis, and Celery workers alongside your existing Grafana instance. Running on a dedicated VPS on RepoCloud with guaranteed CPU, RAM, and SSD, full root SSH access, and a browser serial console. GNU AGPL v3 licensed.