Munin
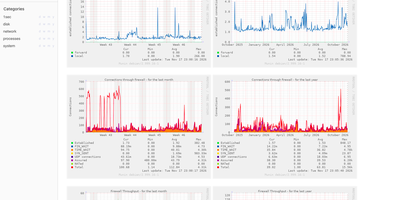
Point Munin at your computers, and this plug-and-play monitoring tool graphs what they are doing, keeps the history, and serves it all in a web interface. A central master polls a small agent on every host every five minutes. That works for a home Raspberry Pi and for a cluster of more than 100 nodes. A default install switches on a large set of plugins on its own. Load, disk, network, and process graphs start filling in with no setup per metric. Plugins are standalone executables that answer a config call with metadata and a plain call with values. Plain shell scripts count. Computers, networks, SANs, applications, even weather measurements: all graphable. The project gallery lists more than a thousand community-supported plugins. No agent on a device? SNMP plugins fetch its values remotely. With supersampling, selected plugins record readings every ten seconds. Every data field can carry warning and critical ranges. Cross one, and Munin can send email, write to syslog, run any script, or notify Nagios or Icinga. Graphs are drawn on demand through CGI or FastCGI. They are grouped by host and category, with hour, day, week, month, and year views side by side. Several masters can watch the same nodes, each keeping its own data. A rewritten node agent covers machines that cannot run the standard one. Running on a dedicated VPS on RepoCloud with guaranteed CPU, RAM, and SSD, full root SSH access, and a browser serial console. GPL-2.0 licensed.
Deploy