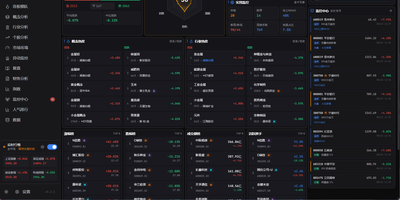
Tick Stock Panel
Screen equities against dozens of technical indicators, backtest algorithmic trading strategies, and spot intraday market anomalies using Tick Stock Panel, a self-hosted quantitative analysis workbench. Traders can filter entire exchanges across technical indicators including moving averages, relative strength index, and Bollinger bands with near-instantaneous execution. The platform provides a full backtesting environment where users test customized entry and exit rules, account for simulated slippage and commission fees, and review streamed performance metrics. Dedicated monitoring modules track intraday volume spikes, price breakouts, and multi-day limit streaks with automated alert dispatching to messaging channels and voice announcements. Users can explore individual stock profiles featuring multi-dimensional technical breakdowns, financial balance sheets, and automated event post-mortems generated via integrated language models. Visual factor mining tools allow analysts to discover uncorrelated signals and assemble composite portfolio screens without external database overhead. An interactive dashboard aggregates sector rotations, hot concept heatmaps, and customizable watchlists into modular operational views. Running on a dedicated VPS on RepoCloud with guaranteed CPU, RAM, and SSD, full root SSH access, and a browser serial console. MIT licensed.
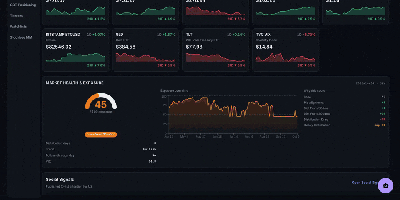
Stock Screener
Stock Screener scans twelve global markets every day so growth investors can find CANSLIM and Minervini style candidates without stitching together spreadsheets and charting sites. You run bulk scans with more than eighty technical and fundamental filters, then rank results by composite scores, relative strength sparklines, and multi-screener ratings that show which names pass several methodologies at once. Market health and exposure views translate breadth into position-sizing guidance, while StockBee style breadth pages track daily movers, advance and decline lines, new highs and lows, and benchmark overlays from one shared calculation layer. Industry group rankings order sectors and groups by relative strength with one-week to six-month movers, and the Relative Rotation Graph plots groups moving through leading, weakening, lagging, and improving quadrants. The stock matrix lays out constituents in grid or cluster layouts colored by change or relative strength, watchlists organize into drag-and-drop folders with sparklines, and theme discovery watches news and social feeds for emerging narratives. An AI research chatbot answers questions against the same daily data, an options command center adds gamma and volatility context for top candidates, and backtesting validates published picks against price history. Running on a dedicated VPS on RepoCloud with guaranteed CPU, RAM, and SSD, full root SSH access, and a browser serial console. Apache-2.0 licensed.