Rath
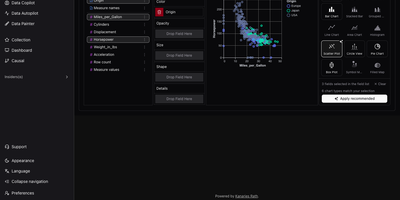
RATH, an automated data exploration workbench, turns any table into a gallery of charts worth reading, without building each chart by hand. Start with a CSV, JSON, or Excel file, or pull tables from MySQL, PostgreSQL, Oracle, SQL Server, SQLite, or Airtable. Eight built-in demo datasets are ready to try. Next comes a profile: every field gets a distribution chart and summary statistics. A metadata view retags fields as dimensions or measures. Data Autopilot then searches the dataset and pages through generated insight charts. Charts can be starred, exported, or opened in the editor. Starting from a single field, Data Copilot lists associated patterns to follow, with controls to add variables, filters, and computations. For hands-on work, the drag-and-drop chart builder offers fifteen chart types, including heat maps, box plots, and maps, plus a button that applies the recommended chart. With Data Painter, you brush points into up to ten labeled color groups or erase anomalies, then search for a chart that explains the painting. Causal analysis runs one of ten discovery algorithms, including PC, FCI, GES, and GRaSP. It then draws a directed graph with influence percentages, plus charts and statistics for any field you select. Dashboards combine titles, text, and charts in movable, resizable cards with four themes and global filters. Running on a dedicated VPS on RepoCloud with guaranteed CPU, RAM, and SSD, full root SSH access, and a browser serial console. AGPL-3.0 licensed.
Emoncms
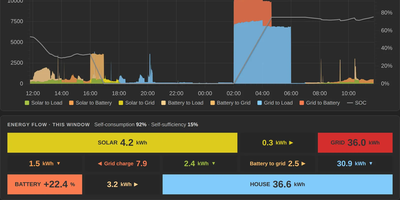
Energy meters, solar systems, heat pumps, and temperature sensors report to Emoncms, which logs every reading as a time series and turns it into graphs, dashboards, and ready-made apps. Readings arrive over an HTTP input API, MQTT topics beneath emon/, or AES-encrypted posts for devices without HTTPS, from scripts, Node-RED, Home Assistant, or emonHub. Input processing calibrates values, combines inputs, converts watts to cumulative kilowatt-hours, and logs the result to a feed. Device templates configure known hardware in one step, and schedules limit processes to set time windows. The graph viewer plots feeds on two axes, groups them into daily, weekly, monthly, or annual bars, and offers feed statistics and CSV export. Virtual feeds calculate values like heat pump COP on request and store nothing; post processing rebuilds feeds from recorded data. My Electric Flow charts live solar, battery, and grid power with an energy-flow breakdown and a Tariff explorer for Octopus Agile and other time-of-use tariffs. My Heatpump reports COP and SCOP. Other apps cover boilers, solar diversion, CO2 air change rates, and the UK grid fuel mix. The dashboard editor places dials, gauges, thermometers, charts, text, and images, and a dashboard can be made public. Sync uploads feeds to another server on a schedule and downloads them for recovery; the Backup module backs up and restores data. Running on a dedicated VPS on RepoCloud with guaranteed CPU, RAM, and SSD, full root SSH access, and a browser serial console. AGPL-3.0 licensed.
Helical Insight
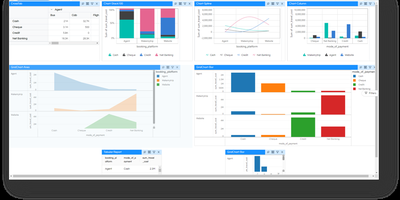
Finance closes the month with invoices that must print perfectly, analysts answer questions from a dashboard, and executives ask the data things in plain language: one platform handles all three jobs. Interactive dashboards support drill-down, drill-through, filters, KPI widgets, maps, and pivot tables, and scheduled delivery or report bursting pushes personalized copies to the people who need them. Pixel-perfect paginated reports cover statements, regulatory documents, and anything where layout is not negotiable. A chat interface generates SQL against connected sources, summarizes reports, and surfaces insights, running against a language model the organization itself chooses. Embedding puts dashboards, reports, and the chatbot inside customer portals and SaaS products, with white labeling swapping logos, themes, colors, and URLs for OEM delivery. Multi-tenancy isolates customers or departments on a single deployment. Row, column, and table level security follows the logged-in user, arriving through JWT, Okta, Keycloak, OAuth, or custom token single sign-on. Exports land in PDF, Excel, CSV, Word, HTML, JSON, and XML. Caching, pagination, virtualization, and clustering keep large deployments responsive, localization adapts the interface for regional teams, custom JavaScript visualizations extend the built-in charts, and REST APIs automate administration across the whole system. Running on a dedicated VPS on RepoCloud with guaranteed CPU, RAM, and SSD, full root SSH access, and a browser serial console. AGPL 3.0 licensed.
LangAlpha
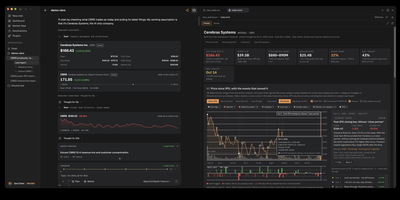
Ask a market question and LangAlpha puts a team of analysts on it: a lead agent splits the work across parallel subagents that read filings, pull prices, and run the numbers in code, then returns a cited answer instead of a guess. Every thesis lives in its own workspace, so files, chats, and the agent's notes are still there tomorrow and each session builds on the last. The deliverables are real ones: Excel models with live formulas, PDF and HTML initiation reports, and interactive dashboards you can click around. Market View draws event badges, support lines, and reference levels straight onto live charts. Automations wake an agent on a weekly schedule or when a stock crosses a price or moves a set percentage, and post results to a feed or a webhook. A Sources panel lists every filing, web page, and data call behind a turn, so you can check the work. Brokerage plugins give each connection read-only, paper, or live permissions, with orders held for your approval. Bring your own model key, a coding plan, or a local model. Running on a dedicated VPS on RepoCloud with guaranteed CPU, RAM, and SSD, full root SSH access, and a browser serial console. Apache-2.0 licensed.