Quickwit
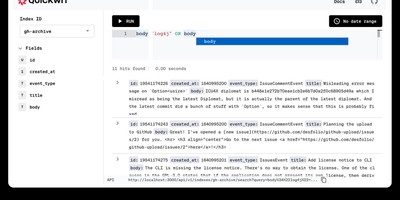
With over 11,000 GitHub stars and now backed by Datadog while remaining fully Apache 2.0 licensed, Quickwit delivers the search performance Elasticsearch users expect at a fraction of the infrastructure cost by moving the index to object storage instead of expensive local SSDs. The Rust-based engine, built on the Tantivy search library with SIMD-accelerated vectorized processing and zero garbage collection overhead, achieves sub-second search latency directly against Amazon S3, Azure Blob Storage, Google Cloud Storage, or any S3-compatible backend like MinIO and Ceph. The Elasticsearch-compatible REST API covers ingest, search, query DSL, and aggregations, enabling existing log shippers including Vector, Fluent Bit, and Syslog to migrate without rewriting configurations. Native OpenTelemetry Protocol endpoints accept logs and traces via gRPC, while Jaeger integration provides a drop-in distributed tracing backend. Ingestion from Apache Kafka, Amazon Kinesis, and Apache Pulsar supports streaming pipelines with multi-index partitioning, and the schemaless JSON indexing mode eliminates the need for upfront schema definitions. Stateless searchers and indexers scale horizontally on Kubernetes or bare metal, with a control plane that distributes indexing tasks and a janitor that manages retention policies and GDPR-compliant deletions. The built-in web UI displays search results and cluster state, while the official Grafana data source enables log exploration dashboards. Running on a dedicated VPS on RepoCloud with guaranteed CPU, RAM, and SSD, full root SSH access, and a browser serial console. Apache 2.0 licensed.
Jaeger
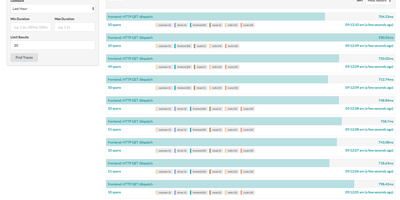
Created by Uber Technologies and graduated as the seventh CNCF top-level project in October 2019 with over 23,000 GitHub stars, Jaeger has become one of the most widely deployed open-source distributed tracing platforms, processing billions of spans per day in production environments at organizations including Uber, Red Hat, and Shopify. Version 2 rebuilt the platform on the OpenTelemetry Collector framework, inheriting its extensible pipeline architecture while implementing Jaeger-specific features as extensions and components, enabling seamless integration with the OpenTelemetry ecosystem through native OTLP protocol support. The platform stores traces in Cassandra 4.0+, Elasticsearch 7.x/8.x, OpenSearch 1.0+, ClickHouse, or the embedded Badger database for development setups. Three sampling strategies control trace volume: head-based sampling with constant, probabilistic, and rate-limiting modes, tail-based sampling using the OpenTelemetry Collector processor that evaluates complete traces before storage decisions, and adaptive sampling that dynamically adjusts probabilities based on observed traffic patterns. Service Performance Monitoring computes RED metrics directly from spans, displaying request rates, error rates, and latency percentiles in the Monitor tab with drill-down from aggregate service views to individual traces. The web UI provides trace search with multi-field filtering, trace detail views with span timeline visualization, trace comparison across services, and dependency graphs mapping service relationships from actual traffic. Deployment options range from a single all-in-one binary for development to distributed collector-ingester-query configurations with Kafka intermediate buffering for production scale. Running on a dedicated VPS on RepoCloud with guaranteed CPU, RAM, and SSD, full root SSH access, and a browser serial console. Apache 2.0 licensed.
CubeSandbox
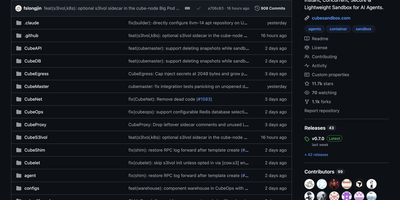
CubeSandbox gives every AI agent its own hardware-isolated MicroVM with a dedicated Linux kernel — not a shared-kernel container but a true KVM virtual machine — booting in under 60ms with less than 5MB of memory overhead per instance, enabling thousands of concurrent sandboxes on a single server via kernel sharing and Copy-on-Write memory. The Rust-built CubeProxy exposes an E2B SDK-compatible REST API on Axum, so existing E2B Cloud applications switch by changing one environment variable with zero client code changes. CubeMaster orchestrates cluster-level scheduling in Go while Cubelet manages node-local sandbox lifecycles including create, run, pause, resume, snapshot, and destroy operations. CubeVS, the eBPF-powered network layer, enforces per-sandbox isolation with LPM trie-based egress policies entirely in kernel space — no userspace context switches — while CubeEgress provides an L7 security proxy with per-domain, per-path, and per-method allowlists plus automatic credential injection that keeps secrets invisible to sandbox code. Hundred-millisecond-granularity snapshots enable checkpoint, rollback, and parallel fork from any saved state. The volume framework supports E2B-compatible pluggable storage with independent lifecycle and cross-sandbox sharing. Production deployment uses Terraform on Tencent Cloud or Helm charts on Kubernetes, K3s, or TKE, with full ARM64 support alongside x86_64 and AutoPause/AutoResume for cost optimization. Running on a dedicated VPS on RepoCloud with guaranteed CPU, RAM, and SSD, full root SSH access, and a browser serial console. Apache 2.0 licensed.
CockroachDB
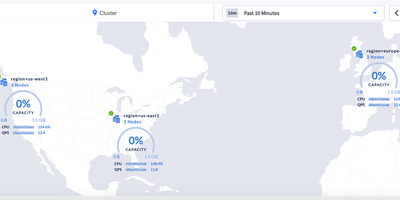
With over 32,000 GitHub stars and adoption by DoorDash, Netflix, and Bose, CockroachDB is the distributed SQL database designed to survive disk failures, machine outages, rack losses, and entire datacenter failures while maintaining strongly-consistent ACID transactions with serializable isolation by default. The architecture layers SQL on a transactional key-value store using the Raft consensus protocol for synchronous replication, automatically splitting data into ranges that distribute and rebalance without manual sharding. PostgreSQL wire protocol compatibility means existing drivers, ORMs, and tools including psycopg2, pgx, ActiveRecord, Django ORM, GORM, Hibernate, and Prisma work without modification. Multi-region capabilities include configurable survival goals at region or zone level, table-level locality settings for pinning data to specific geographies for GDPR compliance, and follower reads for low-latency global queries. The built-in DB Console provides cluster overview dashboards, node maps showing geographical distribution, SQL activity pages tracking statement fingerprints, transaction latency percentiles, session details, and real-time metrics for queries per second, storage capacity, and replication status. Change data capture streams row-level changes to Apache Kafka, Google Cloud Pub/Sub, or webhook endpoints for event-driven architectures. Online schema changes execute ALTER TABLE without locking or downtime, and distributed backup supports full and incremental snapshots to S3, GCS, Azure Blob, and NFS. Running on a dedicated VPS on RepoCloud with guaranteed CPU, RAM, and SSD, full root SSH access, and a browser serial console. CockroachDB Software License (source-available).
Netdata
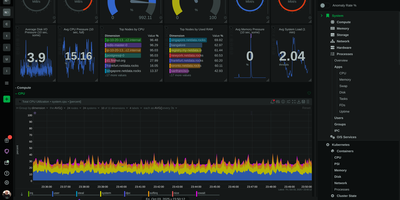
Trusted by millions of engineers and deployed on over 80,000 GitHub stars worth of community confidence, Netdata delivers true real-time monitoring at per-second granularity — 10-60x faster than Prometheus, Datadog, or any conventional monitoring stack that averages away the transient anomalies lasting 2-10 seconds where most production incidents originate. A single installation command deploys the agent with zero configuration, automatically discovering every running process, container, systemd service, network connection, disk, and application on the host within seconds. Unsupervised machine learning trains multiple models per metric directly at the edge, detecting anomalies without thresholds, baselines, or manual tuning. The distributed Parent-Child architecture scales horizontally from a single Raspberry Pi to fleets exceeding 100,000 nodes while maintaining sub-2-second visualization latency and storing metrics at approximately 0.5 bytes per sample through tiered compression. Native network monitoring provides live topology maps, NetFlow and sFlow analytics, SNMP device polling across 200+ profiles, and trap handling — capabilities that typically require a separate NPM product. Hundreds of pre-configured alerts cover systems and applications out of the box, with AI-powered root cause analysis surfacing correlated metrics through natural language via MCP-compatible AI assistants. The agent supports Linux, macOS, FreeBSD, Kubernetes, and Docker with eBPF-based kernel observability requiring no application instrumentation. Running on a dedicated VPS on RepoCloud with guaranteed CPU, RAM, and SSD, full root SSH access, and a browser serial console. GPL v3+ licensed.
Neon
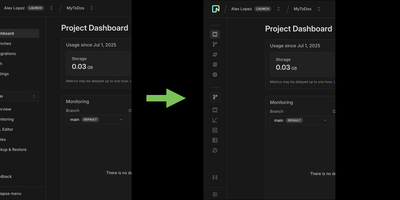
Neon reimagines PostgreSQL with a serverless architecture that decouples storage from compute, enabling instant copy-on-write database branching, autoscaling under load, and scale-to-zero when idle with sub-second cold starts. The lakebase architecture distributes durability across three layers: stateless compute nodes running unmodified PostgreSQL, safekeepers providing Paxos-based WAL quorum replication, and a pageserver that materializes pages on demand while offloading immutable history to S3-compatible object storage via MinIO or AWS S3. Copy-on-write branching creates full database clones as metadata operations without duplicating data, enabling developers to spin up isolated test environments, run parallel CI/CD pipelines, or recover from data loss through point-in-time restore across the configurable history window. Autoscaling dynamically adjusts CPU and memory based on live traffic without manual capacity planning, while scale-to-zero ensures costs drop to storage-only during idle periods. Neon maintains 100% PostgreSQL compatibility with broad extension support including PostGIS, pg_cron, pgvector, pg_stat_statements, and hundreds more, so existing applications connect with standard PostgreSQL drivers and ORMs unchanged. The API-first control plane enables programmatic provisioning, branch management, and multi-tenant fleet operations for platform builders and AI agent integrations. Acquired by Databricks in May 2025 and backed by over 22,800 GitHub stars. Deploys via Docker Compose with pageserver, safekeepers, storage broker, and compute nodes backed by MinIO object storage. Running on a dedicated VPS on RepoCloud with guaranteed CPU, RAM, and SSD, full root SSH access, and a browser serial console. Apache 2.0 licensed.
Kite
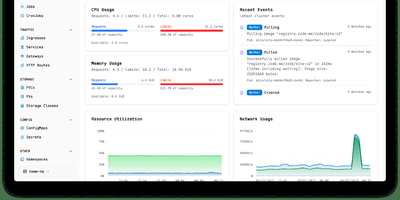
With nearly 3,000 GitHub stars and 14 releases since its June 2025 launch, Kite delivers a lightweight Kubernetes dashboard that replaces the fragmented workflow of switching between kubectl, Lens, and separate monitoring tools with a unified multi-cluster management platform. The dashboard automatically discovers clusters from kubeconfig files and supports independent Prometheus configurations per cluster, providing real-time CPU, memory, and network charts alongside live pod log streaming with filtering and search. A built-in web terminal opens shells directly into pods and nodes without kubectl port-forward, while the Monaco-based YAML editor offers syntax highlighting and validation for in-place resource editing. The integrated AI agent, powered by OpenAI or Anthropic models via native Go SDK integrations, translates natural language into precise client-go API calls — querying cluster health, analyzing pod logs, scaling deployments, patching resources, and cleaning up failed jobs — all operating strictly within the logged-in user's RBAC permissions. Enterprise governance includes OAuth 2.0 single sign-on, multi-factor authentication, FIDO2 passkeys, granular role-based access control with per-namespace permissions, and comprehensive audit logging. Helm chart management enables browsing, installing, and upgrading releases directly from the UI, while the Docker registry integration provides quick image tag selection. Deploy via a single Docker container with SQLite or use the official OCI Helm chart with PostgreSQL or MySQL for production. Running on a dedicated VPS on RepoCloud with guaranteed CPU, RAM, and SSD, full root SSH access, and a browser serial console. Apache 2.0 licensed.
Rancher
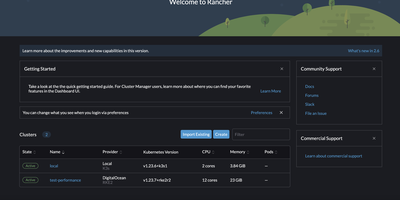
Used by over 30,000 teams and 650+ enterprise customers managing more than 5.2 million containers, Rancher has earned recognition as a Leader in the Gartner Magic Quadrant for Container Management and the Forrester Wave for Multicloud Container Platforms. The platform provides a single pane of glass for provisioning, upgrading, and securing Kubernetes clusters across Amazon EKS, Google GKE, Microsoft AKS, RKE2, K3s, and any CNCF-conformant distribution. Multi-Cluster Management enables centralized authentication via Active Directory, LDAP, SAML, GitHub, and OpenID Connect with granular role-based access control at the cluster, project, and namespace levels. Fleet, the built-in GitOps engine, delivers continuous deployment across hundreds of clusters simultaneously using Helm charts, Kustomize, or raw YAML manifests from any Git repository. The integrated app catalog provides one-click deployment of Prometheus monitoring, Grafana dashboards, Longhorn persistent storage, Istio service mesh, and hundreds of community Helm charts. Rancher supports air-gapped installations for disconnected environments, CIS benchmark scanning for security compliance, and automated backup and restoration of cluster configurations. The dashboard offers real-time workload monitoring, log aggregation, pod shell access, and namespace-scoped resource quotas. Cluster templates enforce organizational standards through Helm-based provisioning policies that ensure consistent configurations across environments. Running on a dedicated VPS on RepoCloud with guaranteed CPU, RAM, and SSD, full root SSH access, and a browser serial console. Apache 2.0 licensed.
Harbor
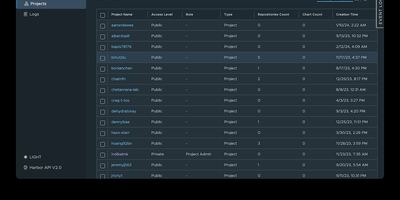
The first container registry to reach CNCF graduated status with over 29,000 GitHub stars since VMware open-sourced it in 2016, Harbor transforms the basic Docker Distribution into a hardened enterprise registry with vulnerability scanning, supply chain signing, multi-datacenter replication, and project-level access control out of the box. Trivy scans every pushed image against the NVD, GitHub Advisory Database, and distribution-specific vulnerability feeds, with scan-on-push policies that block deployment of images exceeding configurable severity thresholds. Artifact signing through Cosign keyless signatures and Notation enforces content trust policies ensuring only cryptographically verified images reach production clusters. Policy-based replication synchronizes images and Helm charts between Harbor instances across multiple datacenters using repository, tag, and label filters with automatic retry and bandwidth throttling — enabling hybrid-cloud and disaster-recovery topologies. The RBAC model isolates projects with per-project quotas, robot accounts for CI/CD automation, webhook notifications, and audit logging that tracks every pull, push, delete, and configuration change. LDAP, Active Directory, and OIDC authentication integrate with existing identity providers, while the proxy cache transparently caches images from Docker Hub, Quay, and other upstream registries to reduce pull latency and rate-limit exposure. The RESTful API with embedded Swagger UI, tag retention policies, garbage collection scheduling, and immutable artifact rules complete the lifecycle management. Deploy via Docker Compose or Helm Chart on Kubernetes. Running on a dedicated VPS on RepoCloud with guaranteed CPU, RAM, and SSD, full root SSH access, and a browser serial console. Apache 2.0 licensed.
Apache APISIX
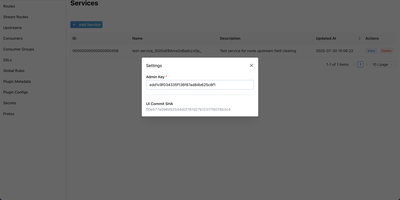
With 17,000 GitHub stars, 460+ contributors, and deployments across telecommunications, automotive, and financial services running on over 10,000 CPU cores at the largest known installations, Apache APISIX delivers a fully dynamic API gateway achieving 140,000 QPS on eight cores with sub-millisecond latency through NGINX's event-driven architecture and LuaJIT-compiled plugin execution. The 100+ open-source plugins cover authentication (JWT, OAuth 2.0, OIDC, Keycloak, LDAP), observability (Prometheus, Datadog, SkyWalking, OpenTelemetry), traffic management (rate limiting, circuit breaking, canary releases, traffic splitting), and security (CORS, IP restriction, CSRF protection) — all hot-reloadable without process restarts via etcd-based real-time configuration synchronization. Multi-protocol support handles HTTP, gRPC, MQTT, TCP, UDP, and WebSocket traffic for both north-south API access and east-west service mesh communication. AI gateway capabilities proxy requests to 20+ LLM providers with semantic caching, token-aware rate limiting, provider failover routing, and content moderation. Custom plugins extend the gateway in Lua, Go, Java, Python, or WebAssembly. Radixtree route matching handles 100,000+ routes without performance degradation. Functions as a Kubernetes ingress controller with native service discovery for Consul, Nacos, and Eureka. Deploy via Docker or Helm charts with horizontal scaling through etcd cluster coordination. Running on a dedicated VPS on RepoCloud with guaranteed CPU, RAM, and SSD, full root SSH access, and a browser serial console. Apache 2.0 licensed.
Grafana Loki
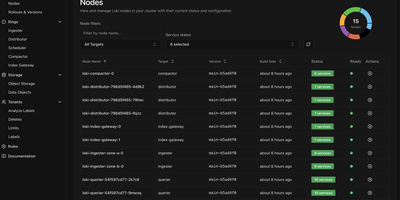
With over 28,600 GitHub stars and 450 contributors, Grafana Loki is the log aggregation system that takes the Prometheus approach to logging — indexing only metadata labels instead of full log content, making it dramatically cheaper and simpler to operate than traditional log management platforms. The label-based indexing strategy groups log streams using the same labels already applied to Prometheus metrics, enabling seamless switching between metrics and logs in Grafana dashboards without maintaining separate indexing infrastructure. Grafana Alloy, the telemetry collector replacing Promtail, scrapes and pushes logs with Prometheus-style service discovery, automatic Kubernetes Pod label extraction, and pipeline stages for parsing, filtering, and relabeling before ingestion. LogQL, the query language, combines label matchers for stream selection with regex line filters and aggregation functions, supporting rate calculations, pattern parsing, and metric generation from log data for alerting and dashboard panels. The storage architecture writes compressed log chunks and TSDB indexes to S3, GCS, Azure Blob Storage, or MinIO-compatible object stores, with configurable retention and compaction policies. Deployment modes scale from a single binary for development through monolithic high-availability mode with multiple replicas to full microservices decomposition with separate ingester, distributor, querier, query-frontend, compactor, and ruler components on Kubernetes via Helm charts. Multi-tenancy isolates data and query paths per tenant through header-based tenant ID assignment. Running on a dedicated VPS on RepoCloud with guaranteed CPU, RAM, and SSD, full root SSH access, and a browser serial console. AGPL-3.0 licensed.
Headlamp
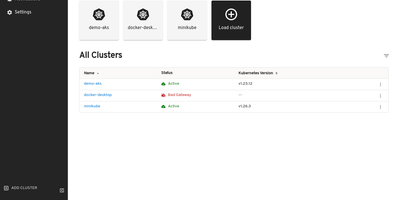
The Kubernetes project's own answer to cluster management UIs: maintained under SIG UI governance, Headlamp's roadmap tracks Kubernetes releases and its design philosophy reflects community needs rather than a vendor's product strategy. The React interface provides full read-write capabilities adapted to each user's RBAC permissions — delete, scale, edit, and restart buttons appear only when the authenticated user holds the corresponding cluster role, preventing accidental unauthorized actions. Multi-cluster support surfaces workloads across development, staging, and production from a single view without context switching. The plugin architecture drives extensibility through a curated catalog: an AI Assistant plugin answers natural-language cluster queries and performs operations via configurable LLM keys, Flux handles GitOps, Karpenter manages nodes. Integrated terminals provide browser-based exec access to running pods, live log streaming follows container output with filtering, and the YAML editor displays inline Kubernetes API documentation alongside resource definitions. Deployment creation forms let you configure containers, environment variables, volumes, and replicas without writing manifests. Side-by-side cluster comparison views surface differences in workload distribution. Works with any distribution: EKS, GKE, AKS, Minikube, Docker Desktop. Helm chart installation via the Headlamp repository with images on GitHub Container Registry. Running on a dedicated VPS on RepoCloud with guaranteed CPU, RAM, and SSD, full root SSH access, and a browser serial console. Apache-2.0 licensed.
Milvus
With over 45,000 GitHub stars and 100 million Docker pulls, Milvus is the most widely adopted open-source vector database, powering production AI systems at NVIDIA, Salesforce, eBay, Airbnb, and DoorDash. The distributed architecture separates compute and storage with stateless microservices on Kubernetes, horizontally scaling query nodes for read-heavy workloads and data nodes for write-heavy ingestion independently. Milvus 3.0 introduces lake-native retrieval that builds and serves indexes directly over vector data in object storage and open formats including Parquet, Lance, Iceberg, and Vortex without maintaining separate copies. Native hybrid search unifies lexical BM25 full-text retrieval and semantic vector search in a single engine with metadata filtering, eliminating the need for separate search infrastructure. Hardware-accelerated ANN indexing supports IVF, HNSW, DiskANN, and GPU-based indexes with BitQ 1-bit quantization cutting memory usage by 72 percent. SDKs for Python, Go, Node.js, and Java provide programmatic access, while Milvus Lite offers lightweight embedding for local development via pip install. Server-side aggregation, sorting, faceted search, StructArray for nested document structures, and ColBERT multi-vector scoring move ranking and result processing into the engine. The Path Index enables 100x faster JSON filtering with support for 100,000+ collections per cluster for multi-tenant deployments. Self-hosting deploys via Docker Standalone or Kubernetes with Helm charts using S3-compatible, GCS, or Azure Blob storage backends. Running on a dedicated VPS on RepoCloud with guaranteed CPU, RAM, and SSD, full root SSH access, and a browser serial console. Apache 2.0 licensed.
Argo CD
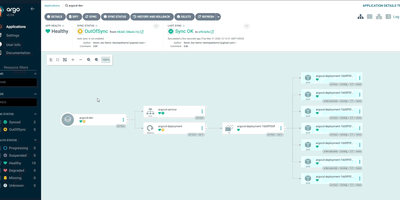
A CNCF Graduated project with over 23,700 GitHub stars and adoption by organizations including Intuit, Adobe, Capital One, and Red Hat, Argo CD has become the industry standard for GitOps-based Kubernetes deployments since its creation at Intuit in 2018, treating Git repositories as the single source of truth for application configurations and automatically reconciling live cluster state with declared desired state. The platform supports Helm charts including Helm 4, Kustomize overlays, Jsonnet, and plain Kubernetes YAML manifests, rendering templates and applying resources through configurable sync policies with automated or manual reconciliation, pruning of orphaned resources, and self-healing that reverts unauthorized cluster changes. ApplicationSets enable templated generation of applications across multiple clusters, environments, and Git repositories using generators for pull requests, Git directories, cluster lists, and merge strategies. The web UI provides a real-time application topology view with resource health status, sync state indicators, log streaming, and a network view supporting Gateway API and Ingress visualization. Version 3.5 introduced mTLS for internal component communication, graduated user impersonation and source hydrator to beta, added native ApplicationSet management with preview applications in the UI, and delivered source integrity validation. Multi-cluster management deploys applications across development, staging, and production environments from a single Argo CD instance with RBAC, SSO via OIDC and SAML, and audit logging. Running on a dedicated VPS on RepoCloud with guaranteed CPU, RAM, and SSD, full root SSH access, and a browser serial console. Apache 2.0 licensed.
Inference Gateway
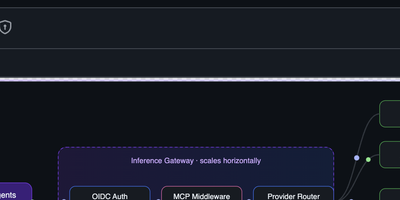
Inference Gateway puts a single OpenAI-compatible API endpoint in front of OpenAI, Anthropic, Groq, Cohere, Ollama, DeepSeek, Google, Mistral, MiniMax, Moonshot, Nvidia, and llama.cpp, so your application code never changes when you switch models or providers. The Go binary starts on port 8080 and normalizes authentication, streaming protocols, and response formats across all backends transparently. Native Model Context Protocol support auto-discovers tools from connected MCP servers and injects them into LLM requests without client-side management, enabling server-side tool execution across any provider that supports function calling. Agent-to-Agent protocol integration allows distributed agent communication through a declarative Agent Definition Language that generates production-ready Go or Rust servers from a single YAML manifest. The dedicated Kubernetes Operator manages Gateway, Agent, MCP, and Orchestrator custom resources with automatic HPA scaling, OIDC authentication, and service discovery that rebuilds MCP configurations when the discovered server set changes. Prometheus metrics and OpenTelemetry tracing provide full request-level observability across the entire inference pipeline. Middleware controls enable per-request provider selection, model routing, and fallback strategies. Official SDKs in Go, Python, TypeScript, and Rust provide typed client interfaces with streaming support. Docker Compose deployment requires only environment variables for API keys. A CNCF Sandbox applicant. Running on a dedicated VPS on RepoCloud with guaranteed CPU, RAM, and SSD, full root SSH access, and a browser serial console. Apache 2.0 licensed.
KubeSphere
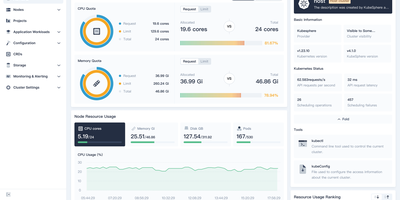
Managing Kubernetes shouldn't require every developer to become a Kubernetes expert — KubeSphere wraps cluster operations, CI/CD, service mesh, and observability into guided web workflows that operations teams configure once and developers consume without kubectl. The LuBan extensible architecture treats each capability as an independently installable extension plugging into a lightweight microkernel: enable DevOps without service mesh, add monitoring without the app store, compose exactly what your organization needs. Multi-cluster management provides a centralized control plane for provisioning and operating clusters across cloud providers, data centers, and edge locations with unified identity and resource quotas. The DevOps extension integrates Jenkins for graphical pipeline creation with S2I and B2I workflows, while Argo CD powers GitOps continuous deployment with real-time sync status. Istio-based service mesh provides traffic management, canary deployments, circuit breaking, and distributed tracing through the console without CLI knowledge. Prometheus monitoring with custom dashboards, Fluentd log collection with multi-tenant search, and alerting via Slack and email complete the observability stack. Multi-tenant workspace hierarchy enforces resource quotas and fine-grained RBAC roles across teams. A built-in Helm-based app store handles lifecycle management across clusters. KubeKey deploys production-grade clusters on bare metal or VMs with air-gapped support. Running on a dedicated VPS on RepoCloud with guaranteed CPU, RAM, and SSD, full root SSH access, and a browser serial console. Apache-2.0 licensed.
etcd
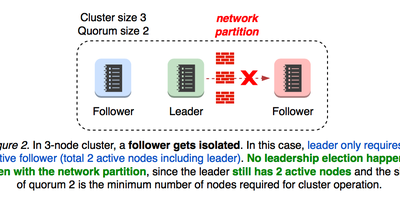
With over 52,000 GitHub stars and its role as the foundation of every Kubernetes cluster worldwide, etcd is the distributed key-value store that handles the most critical data in modern infrastructure — cluster state, configuration, service discovery, and distributed coordination. Built in Go and graduated from the CNCF, etcd uses the Raft consensus algorithm to maintain a strongly-consistent, highly-available replicated log across a cluster of machines, gracefully handling leader elections during network partitions and tolerating machine failure including the leader node. The gRPC API provides atomic key-value operations including put, get, delete, and transactions with multi-key compare-and-swap semantics, enabling distributed locking, leader election, and configuration management without external coordination. Watch operations stream real-time change notifications for specific keys or key ranges, powering reactive architectures that respond immediately to configuration updates. Version 3.7 introduces RangeStream for streaming large result sets in chunks, keys-only range requests for faster metadata queries, and bootstraps entirely from v3store after eliminating the legacy v2 store dependency. Automatic TLS encryption with optional client certificate authentication secures all cluster communication, while role-based access control restricts key access per user. The embedded bbolt B+ tree storage engine provides consistent reads and writes with configurable compaction policies. Benchmarked at 10,000 writes per second per instance with linearizable reads, etcd supports clusters of 3, 5, or 7 members for fault tolerance. Running on a dedicated VPS on RepoCloud with guaranteed CPU, RAM, and SSD, full root SSH access, and a browser serial console. Apache 2.0 licensed.