Elasticvue
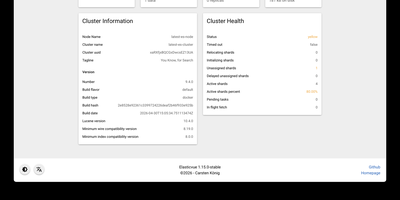
Elasticvue is a graphical interface for Elasticsearch where you can inspect cluster health, browse indices, search and edit documents, and send REST queries. Start on the Home tab, which summarizes status, nodes, shards, indices, document counts, and disk usage. Nodes shows load, CPU, RAM, heap, and disk for each member, and Shards lays out every primary and replica in a grid with a switch for shard allocation. Indices handles creation, aliases, templates, and bulk actions. Search runs query string searches across an index pattern, opens any hit in a JSON editor for updates or deletion, and downloads results as JSON. Rest sends any request from tabbed editors with history, saved queries, and examples, while Snapshots manages repositories and backups. Version 1.16 adds user and role management for Elasticsearch clusters. Secured clusters connect with basic authentication, API keys, or AWS IAM credentials, and the Docker image preloads cluster definitions from an environment variable or a mounted JSON file. Elasticvue supports every Elasticsearch version, even end-of-life releases, and speaks English, Chinese, French, Russian, Japanese, and Italian. Running on a dedicated VPS on RepoCloud with guaranteed CPU, RAM, and SSD, full root SSH access, and a browser serial console. MIT licensed.
Rancher
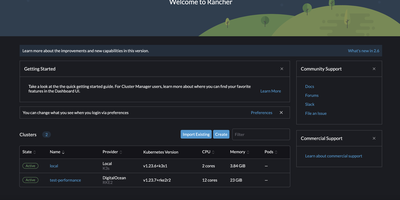
Used by over 30,000 teams and 650+ enterprise customers managing more than 5.2 million containers, Rancher has earned recognition as a Leader in the Gartner Magic Quadrant for Container Management and the Forrester Wave for Multicloud Container Platforms. The platform provides a single pane of glass for provisioning, upgrading, and securing Kubernetes clusters across Amazon EKS, Google GKE, Microsoft AKS, RKE2, K3s, and any CNCF-conformant distribution. Multi-Cluster Management enables centralized authentication via Active Directory, LDAP, SAML, GitHub, and OpenID Connect with granular role-based access control at the cluster, project, and namespace levels. Fleet, the built-in GitOps engine, delivers continuous deployment across hundreds of clusters simultaneously using Helm charts, Kustomize, or raw YAML manifests from any Git repository. The integrated app catalog provides one-click deployment of Prometheus monitoring, Grafana dashboards, Longhorn persistent storage, Istio service mesh, and hundreds of community Helm charts. Rancher supports air-gapped installations for disconnected environments, CIS benchmark scanning for security compliance, and automated backup and restoration of cluster configurations. The dashboard offers real-time workload monitoring, log aggregation, pod shell access, and namespace-scoped resource quotas. Cluster templates enforce organizational standards through Helm-based provisioning policies that ensure consistent configurations across environments. Running on a dedicated VPS on RepoCloud with guaranteed CPU, RAM, and SSD, full root SSH access, and a browser serial console. Apache 2.0 licensed.
Kubewall
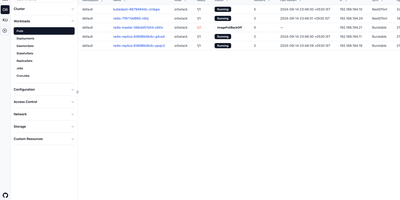
One binary is all that stands between you and every Kubernetes cluster you own: Kubewall opens a realtime web dashboard over all of them, with no agents to install and nothing phoning home. Switch between clusters from the sidebar and browse workloads, networking, storage, configuration, and access control in tables that update live as pods start, fail, and reschedule. Open any resource to inspect its overview, edit its manifest in the built-in YAML editor with validation, watch its events, or stream logs aggregated across pods and containers with search and tail controls. A command palette jumps straight to any resource type, while faceted filters and global search cut through thousands of objects by name, namespace, label, or image. Scale deployments, restart pods, trigger rollout restarts, and apply manifests with a click, or forward a cluster service to your local machine without memorising kubectl incantations. An integrated AI assistant, connected to OpenAI, Claude, Gemini, DeepSeek, OpenRouter, Ollama, or a local model, helps troubleshoot failures and review configurations right beside the resource it concerns. Running on a dedicated VPS on RepoCloud with guaranteed CPU, RAM, and SSD, full root SSH access, and a browser serial console. Apache-2.0 licensed.
AliangBoard
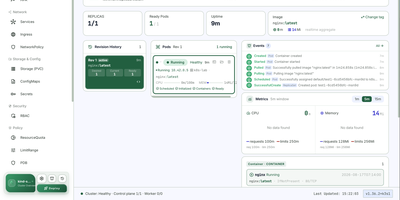
AliangBoard puts every Kubernetes cluster you run behind one web panel, where you manage resources yourself or ask an AI agent to do it with your approval. Connect each cluster with a bearer token or basic auth and the panel persists the connection, so switching clusters, namespaces, and workloads takes one click instead of another kubeconfig. More than thirty resource types stay in sync: create workloads, services, ingress, config, storage, and RBAC through structured forms, edit anything as YAML, apply multi-document manifests at once, and delete optimistically with automatic rollback when the API refuses. Pod work goes deep: a tmux-backed exec terminal survives browser refreshes, port-forwards resolve services to their backend pods, files move up and down with progress, and debug containers inject into running pods without restarting them. Day-two operations are buttons, not flag memorization: scale, rolling restart, rollout undo, manual CronJob triggers, and node cordon or drain. Global search, a layered namespace topology, live event streams, and CPU and memory metrics keep orientation effortless. Then there is the operator: an Agent workbench and MCP server let your LLM read logs, debug containers, and propose changes in natural language, while every write waits for a human click and lands in an audit log that names who did what. Running on a dedicated VPS on RepoCloud with guaranteed CPU, RAM, and SSD, full root SSH access, and a browser serial console. Apache-2.0 licensed.