DHIS2
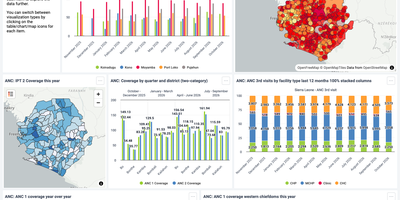
Health programs that tally clinic visits, vaccine doses, and disease cases on paper or in spreadsheets can switch to DHIS2, which turns those routine reports into live dashboards, maps, and charts. Data Entry opens a form for each facility and reporting period, grouped into sections like Immunization and Nutrition, with validation checks and a mark for complete or incomplete reports; Capture follows registered people through program stages like Birth and Baby Postnatal, with scheduled events, notes, and relationships. Dashboards gather charts, maps, tables, and text into one page per topic, with a filter bar, a slideshow mode, sharing, and interpretations, and the Data Visualizer builds column, line, pie, gauge, scatter, and radar charts or pivot tables from indicators, data elements, periods, and organisation units. Maps overlays thematic layers, facility markers, and boundaries on a choice of basemaps, with legends that count the areas in each class, and Metadata Management defines data elements, data sets, indicators, organisation units, programs, option sets, validation rules, and approval workflows from one sidebar. Users, roles, and groups control access; Messaging, Scheduler, Data Quality, and Import/Export apps cover notifications, jobs, checks, and bulk exchange; and Android devices, SMS, and a RESTful API bring in data from remote sites and other systems. Running on a dedicated VPS on RepoCloud with guaranteed CPU, RAM, and SSD, full root SSH access, and a browser serial console. BSD-3-Clause licensed.
Deploy