Pulse
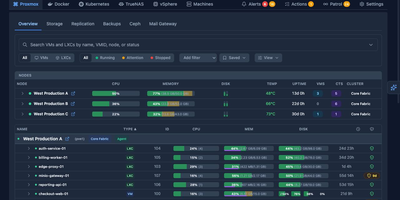
Pulse monitors your entire heterogeneous infrastructure from one screen: Proxmox VE, Proxmox Backup Server, Proxmox Mail Gateway, Docker, Podman, Docker Swarm, Kubernetes, TrueNAS SCALE/CORE, VMware vSphere, and standalone Linux/Windows/macOS machines. The Go binary embeds a SolidJS/TypeScript frontend, delivering WebSocket-driven dashboards with sub-second metric updates on port 7655. A unified agent auto-detects Docker, Podman, Kubernetes, and Proxmox on each host without manual configuration and self-updates silently, while Proxmox nodes need only API credentials with zero agent installation. Smart alerts use adaptive hysteresis-based thresholds to prevent notification floods, pushing to Discord, Slack, Telegram, Teams, email, ntfy.sh, Gotify, and generic webhooks with per-resource overrides. The standout feature is Pulse Patrol: scheduled AI health checks running every ten minutes to seven days using OpenAI, Anthropic, Gemini, or local Ollama models. Patrol catches silent backup failures, capacity creep, restart loops, unhealthy containers, and clock drift that dashboards miss when nobody is watching. Platform-specific views render Proxmox nodes, Ceph clusters, Docker Compose projects, Kubernetes workloads, TrueNAS pools, and vSphere VMs in familiar layouts. OIDC, SSO, and SAML authentication with credential encryption at rest secures access. 6,500+ stars and 441 releases since February 2025. Running on a dedicated VPS on RepoCloud with guaranteed CPU, RAM, and SSD, full root SSH access, and a browser serial console. MIT licensed.
Coroot
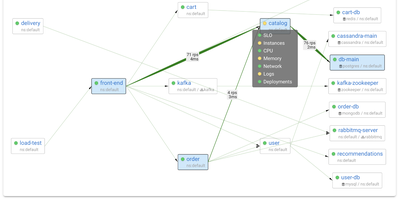
Coroot uses eBPF to capture metrics, distributed traces, logs, and continuous CPU profiles directly from the Linux kernel, delivering full observability without any application code changes, SDKs, or sidecars. From the first minute of deployment, an automatically generated service map covers every microservice, database, message queue, and external dependency with request rate, error rate, and latency measurements. When a service breaches its SLO, AI-powered inspections analyze telemetry across all dimensions to pinpoint the root cause and send a single consolidated alert with findings, replacing the flood of fragmented notifications typical of traditional monitoring. Deployment tracking automatically discovers Kubernetes rollouts and compares each release against the previous one to detect performance regressions, resource spikes, and cost impacts without CI/CD pipeline integration. Continuous profiling captures CPU flame graphs down to the line of code with negligible overhead. Integrated cost monitoring tracks cloud spending across AWS, GCP, and Azure, attributing expenses to individual services and deployments. Coroot supports Prometheus, OpenTelemetry, and ClickHouse as data sources and works identically on Kubernetes clusters, virtual machines, and bare-metal hosts. 7,700+ GitHub stars. Apache-2.0 licensed.
Kite
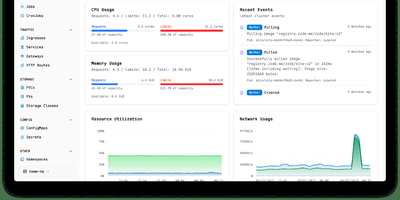
With nearly 3,000 GitHub stars and 14 releases since its June 2025 launch, Kite delivers a lightweight Kubernetes dashboard that replaces the fragmented workflow of switching between kubectl, Lens, and separate monitoring tools with a unified multi-cluster management platform. The dashboard automatically discovers clusters from kubeconfig files and supports independent Prometheus configurations per cluster, providing real-time CPU, memory, and network charts alongside live pod log streaming with filtering and search. A built-in web terminal opens shells directly into pods and nodes without kubectl port-forward, while the Monaco-based YAML editor offers syntax highlighting and validation for in-place resource editing. The integrated AI agent, powered by OpenAI or Anthropic models via native Go SDK integrations, translates natural language into precise client-go API calls — querying cluster health, analyzing pod logs, scaling deployments, patching resources, and cleaning up failed jobs — all operating strictly within the logged-in user's RBAC permissions. Enterprise governance includes OAuth 2.0 single sign-on, multi-factor authentication, FIDO2 passkeys, granular role-based access control with per-namespace permissions, and comprehensive audit logging. Helm chart management enables browsing, installing, and upgrading releases directly from the UI, while the Docker registry integration provides quick image tag selection. Deploy via a single Docker container with SQLite or use the official OCI Helm chart with PostgreSQL or MySQL for production. Running on a dedicated VPS on RepoCloud with guaranteed CPU, RAM, and SSD, full root SSH access, and a browser serial console. Apache 2.0 licensed.
Rancher
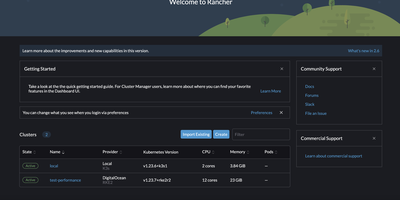
Used by over 30,000 teams and 650+ enterprise customers managing more than 5.2 million containers, Rancher has earned recognition as a Leader in the Gartner Magic Quadrant for Container Management and the Forrester Wave for Multicloud Container Platforms. The platform provides a single pane of glass for provisioning, upgrading, and securing Kubernetes clusters across Amazon EKS, Google GKE, Microsoft AKS, RKE2, K3s, and any CNCF-conformant distribution. Multi-Cluster Management enables centralized authentication via Active Directory, LDAP, SAML, GitHub, and OpenID Connect with granular role-based access control at the cluster, project, and namespace levels. Fleet, the built-in GitOps engine, delivers continuous deployment across hundreds of clusters simultaneously using Helm charts, Kustomize, or raw YAML manifests from any Git repository. The integrated app catalog provides one-click deployment of Prometheus monitoring, Grafana dashboards, Longhorn persistent storage, Istio service mesh, and hundreds of community Helm charts. Rancher supports air-gapped installations for disconnected environments, CIS benchmark scanning for security compliance, and automated backup and restoration of cluster configurations. The dashboard offers real-time workload monitoring, log aggregation, pod shell access, and namespace-scoped resource quotas. Cluster templates enforce organizational standards through Helm-based provisioning policies that ensure consistent configurations across environments. Running on a dedicated VPS on RepoCloud with guaranteed CPU, RAM, and SSD, full root SSH access, and a browser serial console. Apache 2.0 licensed.
Harbor
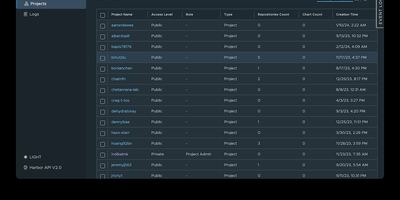
The first container registry to reach CNCF graduated status with over 29,000 GitHub stars since VMware open-sourced it in 2016, Harbor transforms the basic Docker Distribution into a hardened enterprise registry with vulnerability scanning, supply chain signing, multi-datacenter replication, and project-level access control out of the box. Trivy scans every pushed image against the NVD, GitHub Advisory Database, and distribution-specific vulnerability feeds, with scan-on-push policies that block deployment of images exceeding configurable severity thresholds. Artifact signing through Cosign keyless signatures and Notation enforces content trust policies ensuring only cryptographically verified images reach production clusters. Policy-based replication synchronizes images and Helm charts between Harbor instances across multiple datacenters using repository, tag, and label filters with automatic retry and bandwidth throttling — enabling hybrid-cloud and disaster-recovery topologies. The RBAC model isolates projects with per-project quotas, robot accounts for CI/CD automation, webhook notifications, and audit logging that tracks every pull, push, delete, and configuration change. LDAP, Active Directory, and OIDC authentication integrate with existing identity providers, while the proxy cache transparently caches images from Docker Hub, Quay, and other upstream registries to reduce pull latency and rate-limit exposure. The RESTful API with embedded Swagger UI, tag retention policies, garbage collection scheduling, and immutable artifact rules complete the lifecycle management. Deploy via Docker Compose or Helm Chart on Kubernetes. Running on a dedicated VPS on RepoCloud with guaranteed CPU, RAM, and SSD, full root SSH access, and a browser serial console. Apache 2.0 licensed.
ToolHive
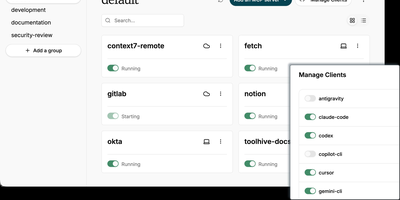
ToolHive is an open-source MCP server management platform that lets you run, secure, and orchestrate Model Context Protocol servers in isolated containers, giving AI agents structured access to tools like GitHub, databases, and cloud services without exposing host credentials or network. Every server launches inside its own sandboxed container with a minimal permission file, network access filtering, and encrypted secrets management, preventing misbehaving connectors from reaching beyond their defined scope. The built-in registry provides a catalog of vetted servers you can install with one command, while custom images and package-manager references let you onboard proprietary connectors without writing Dockerfiles. Platform teams deploy the Kubernetes operator to declare MCP servers as cluster resources using Custom Resource Definitions, with automated lifecycle management and multi-namespace isolation. The Virtual MCP Server gateway aggregates multiple backends behind a single endpoint, centralizing OIDC authentication, tool filtering, and composite cross-server workflows so clients connect once instead of juggling separate URLs. An MCP Optimizer analyzes tool schemas via semantic search and surfaces only relevant tools per request, cutting token consumption by up to 85%. OpenTelemetry traces and Prometheus metrics deliver full visibility into tool execution, latency, and request audit trails across every managed server. Running on a dedicated VPS on RepoCloud with guaranteed CPU, RAM, and SSD, full root SSH access, and a browser serial console. Apache 2.0 licensed.
Grafana Loki
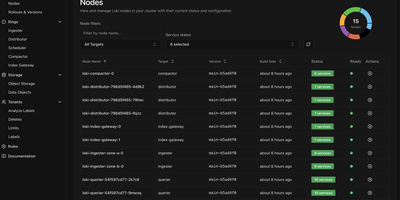
With over 28,600 GitHub stars and 450 contributors, Grafana Loki is the log aggregation system that takes the Prometheus approach to logging — indexing only metadata labels instead of full log content, making it dramatically cheaper and simpler to operate than traditional log management platforms. The label-based indexing strategy groups log streams using the same labels already applied to Prometheus metrics, enabling seamless switching between metrics and logs in Grafana dashboards without maintaining separate indexing infrastructure. Grafana Alloy, the telemetry collector replacing Promtail, scrapes and pushes logs with Prometheus-style service discovery, automatic Kubernetes Pod label extraction, and pipeline stages for parsing, filtering, and relabeling before ingestion. LogQL, the query language, combines label matchers for stream selection with regex line filters and aggregation functions, supporting rate calculations, pattern parsing, and metric generation from log data for alerting and dashboard panels. The storage architecture writes compressed log chunks and TSDB indexes to S3, GCS, Azure Blob Storage, or MinIO-compatible object stores, with configurable retention and compaction policies. Deployment modes scale from a single binary for development through monolithic high-availability mode with multiple replicas to full microservices decomposition with separate ingester, distributor, querier, query-frontend, compactor, and ruler components on Kubernetes via Helm charts. Multi-tenancy isolates data and query paths per tenant through header-based tenant ID assignment. Running on a dedicated VPS on RepoCloud with guaranteed CPU, RAM, and SSD, full root SSH access, and a browser serial console. AGPL-3.0 licensed.
Headlamp
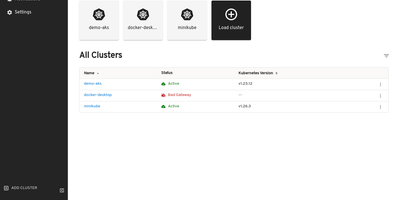
The Kubernetes project's own answer to cluster management UIs: maintained under SIG UI governance, Headlamp's roadmap tracks Kubernetes releases and its design philosophy reflects community needs rather than a vendor's product strategy. The React interface provides full read-write capabilities adapted to each user's RBAC permissions — delete, scale, edit, and restart buttons appear only when the authenticated user holds the corresponding cluster role, preventing accidental unauthorized actions. Multi-cluster support surfaces workloads across development, staging, and production from a single view without context switching. The plugin architecture drives extensibility through a curated catalog: an AI Assistant plugin answers natural-language cluster queries and performs operations via configurable LLM keys, Flux handles GitOps, Karpenter manages nodes. Integrated terminals provide browser-based exec access to running pods, live log streaming follows container output with filtering, and the YAML editor displays inline Kubernetes API documentation alongside resource definitions. Deployment creation forms let you configure containers, environment variables, volumes, and replicas without writing manifests. Side-by-side cluster comparison views surface differences in workload distribution. Works with any distribution: EKS, GKE, AKS, Minikube, Docker Desktop. Helm chart installation via the Headlamp repository with images on GitHub Container Registry. Running on a dedicated VPS on RepoCloud with guaranteed CPU, RAM, and SSD, full root SSH access, and a browser serial console. Apache-2.0 licensed.
Milvus
With over 45,000 GitHub stars and 100 million Docker pulls, Milvus is the most widely adopted open-source vector database, powering production AI systems at NVIDIA, Salesforce, eBay, Airbnb, and DoorDash. The distributed architecture separates compute and storage with stateless microservices on Kubernetes, horizontally scaling query nodes for read-heavy workloads and data nodes for write-heavy ingestion independently. Milvus 3.0 introduces lake-native retrieval that builds and serves indexes directly over vector data in object storage and open formats including Parquet, Lance, Iceberg, and Vortex without maintaining separate copies. Native hybrid search unifies lexical BM25 full-text retrieval and semantic vector search in a single engine with metadata filtering, eliminating the need for separate search infrastructure. Hardware-accelerated ANN indexing supports IVF, HNSW, DiskANN, and GPU-based indexes with BitQ 1-bit quantization cutting memory usage by 72 percent. SDKs for Python, Go, Node.js, and Java provide programmatic access, while Milvus Lite offers lightweight embedding for local development via pip install. Server-side aggregation, sorting, faceted search, StructArray for nested document structures, and ColBERT multi-vector scoring move ranking and result processing into the engine. The Path Index enables 100x faster JSON filtering with support for 100,000+ collections per cluster for multi-tenant deployments. Self-hosting deploys via Docker Standalone or Kubernetes with Helm charts using S3-compatible, GCS, or Azure Blob storage backends. Running on a dedicated VPS on RepoCloud with guaranteed CPU, RAM, and SSD, full root SSH access, and a browser serial console. Apache 2.0 licensed.
Argo CD
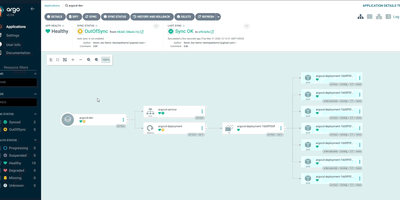
A CNCF Graduated project with over 23,700 GitHub stars and adoption by organizations including Intuit, Adobe, Capital One, and Red Hat, Argo CD has become the industry standard for GitOps-based Kubernetes deployments since its creation at Intuit in 2018, treating Git repositories as the single source of truth for application configurations and automatically reconciling live cluster state with declared desired state. The platform supports Helm charts including Helm 4, Kustomize overlays, Jsonnet, and plain Kubernetes YAML manifests, rendering templates and applying resources through configurable sync policies with automated or manual reconciliation, pruning of orphaned resources, and self-healing that reverts unauthorized cluster changes. ApplicationSets enable templated generation of applications across multiple clusters, environments, and Git repositories using generators for pull requests, Git directories, cluster lists, and merge strategies. The web UI provides a real-time application topology view with resource health status, sync state indicators, log streaming, and a network view supporting Gateway API and Ingress visualization. Version 3.5 introduced mTLS for internal component communication, graduated user impersonation and source hydrator to beta, added native ApplicationSet management with preview applications in the UI, and delivered source integrity validation. Multi-cluster management deploys applications across development, staging, and production environments from a single Argo CD instance with RBAC, SSO via OIDC and SAML, and audit logging. Running on a dedicated VPS on RepoCloud with guaranteed CPU, RAM, and SSD, full root SSH access, and a browser serial console. Apache 2.0 licensed.
Inference Gateway
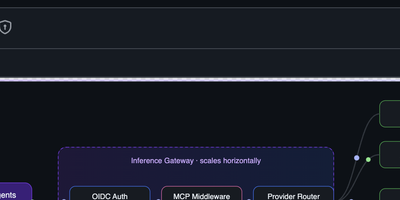
Inference Gateway puts a single OpenAI-compatible API endpoint in front of OpenAI, Anthropic, Groq, Cohere, Ollama, DeepSeek, Google, Mistral, MiniMax, Moonshot, Nvidia, and llama.cpp, so your application code never changes when you switch models or providers. The Go binary starts on port 8080 and normalizes authentication, streaming protocols, and response formats across all backends transparently. Native Model Context Protocol support auto-discovers tools from connected MCP servers and injects them into LLM requests without client-side management, enabling server-side tool execution across any provider that supports function calling. Agent-to-Agent protocol integration allows distributed agent communication through a declarative Agent Definition Language that generates production-ready Go or Rust servers from a single YAML manifest. The dedicated Kubernetes Operator manages Gateway, Agent, MCP, and Orchestrator custom resources with automatic HPA scaling, OIDC authentication, and service discovery that rebuilds MCP configurations when the discovered server set changes. Prometheus metrics and OpenTelemetry tracing provide full request-level observability across the entire inference pipeline. Middleware controls enable per-request provider selection, model routing, and fallback strategies. Official SDKs in Go, Python, TypeScript, and Rust provide typed client interfaces with streaming support. Docker Compose deployment requires only environment variables for API keys. A CNCF Sandbox applicant. Running on a dedicated VPS on RepoCloud with guaranteed CPU, RAM, and SSD, full root SSH access, and a browser serial console. Apache 2.0 licensed.
KubeSphere
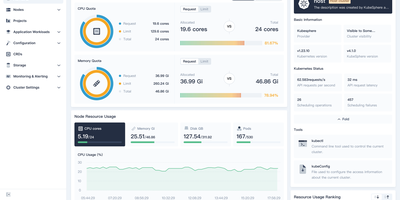
Managing Kubernetes shouldn't require every developer to become a Kubernetes expert — KubeSphere wraps cluster operations, CI/CD, service mesh, and observability into guided web workflows that operations teams configure once and developers consume without kubectl. The LuBan extensible architecture treats each capability as an independently installable extension plugging into a lightweight microkernel: enable DevOps without service mesh, add monitoring without the app store, compose exactly what your organization needs. Multi-cluster management provides a centralized control plane for provisioning and operating clusters across cloud providers, data centers, and edge locations with unified identity and resource quotas. The DevOps extension integrates Jenkins for graphical pipeline creation with S2I and B2I workflows, while Argo CD powers GitOps continuous deployment with real-time sync status. Istio-based service mesh provides traffic management, canary deployments, circuit breaking, and distributed tracing through the console without CLI knowledge. Prometheus monitoring with custom dashboards, Fluentd log collection with multi-tenant search, and alerting via Slack and email complete the observability stack. Multi-tenant workspace hierarchy enforces resource quotas and fine-grained RBAC roles across teams. A built-in Helm-based app store handles lifecycle management across clusters. KubeKey deploys production-grade clusters on bare metal or VMs with air-gapped support. Running on a dedicated VPS on RepoCloud with guaranteed CPU, RAM, and SSD, full root SSH access, and a browser serial console. Apache-2.0 licensed.
Kubero
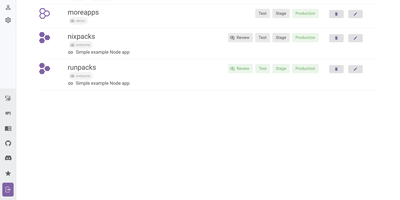
With over 4,300 GitHub stars and a v3 release adding built-in user management, team views, and multi-language support, Kubero has established itself as the most feature-complete open-source Heroku alternative running natively on Kubernetes. The platform operates as a Kubernetes operator with two containers — kubero-ui and the operator — storing all state in etcd without an external database. Developers push code via Git integration with GitHub, GitLab, Bitea, or Gitea, and Kubero automatically builds using Buildpacks, Nixpacks, Runpacks, or Dockerfiles, then deploys to the configured domain with SSL via cert-manager. CI/CD pipelines support up to four staging environments — review, test, staging, and production — with per-stage environment variable isolation and ephemeral review apps that spin up on pull request open and tear down on close. The template catalog includes over 170 pre-configured applications like WordPress, Grafana, and PostgreSQL deployable in one click, while managed add-ons provide highly available PostgreSQL, Redis, MySQL, Kafka, CouchDB, Elasticsearch, and MongoDB alongside your applications. Security features include Trivy vulnerability scanning, GitHub and OAuth2 single sign-on, basic auth, and a role-based permission system with API tokens. The NestJS backend with Vue.js and Vuetify frontend provides application metrics, real-time logs, a built-in web console for container access, scheduled cronjob management, and deployment notifications via Discord, Slack, or webhooks. Running on a dedicated VPS on RepoCloud with guaranteed CPU, RAM, and SSD, full root SSH access, and a browser serial console. GPL-3.0 licensed.
QuickStack
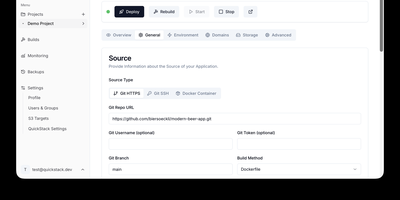
QuickStack transforms your standalone Linux server or cluster into a self-hosted platform-as-a-service that automatically compiles, deploys, and monitors full-stack applications and relational databases without vendor lock-in. Developers can trigger instant deployments directly from public or private Git repositories, upload custom Dockerfiles, or pull container images straight from private registries with automated webhook synchronization. The built-in application catalog enables one-click provisioning of production databases including PostgreSQL, MySQL, MariaDB, MongoDB, and Redis with preconfigured internal network isolation. Administrators can route traffic across custom domains with automated Let's Encrypt SSL certificate issuance, inspect real-time CPU and memory telemetry, stream container runtime logs, and launch in-browser web terminals. Teams can configure granular role-based access controls with single sign-on authentication, establish zero-trust ingress and egress network security policies, and orchestrate automated volume snapshots directly to S3 object storage. When infrastructure requirements expand, operators can attach additional worker nodes using lightweight join tokens to distribute workloads seamlessly across high-availability compute pools. Running on a dedicated VPS on RepoCloud with guaranteed CPU, RAM, and SSD, full root SSH access, and a browser serial console. GNU GPL v3.0 licensed.

RocketplaneIO
RocketplaneIO is a self-hosted AI SRE platform that gives Kubernetes clusters zero-instrumentation eBPF observability plus a copilot capable of safely diagnosing and fixing issues without your telemetry ever leaving your infrastructure. Point it at any cluster, and an eBPF DaemonSet starts capturing HTTP, gRPC, SQL, Redis, and Kafka spans across every service, including compiled binaries, with cross-service context propagation and no code changes required. The live service map draws itself from actual network traffic, matching technology logos from container images and coloring each node's health from RED metrics. Every log line sits two clicks from its parent distributed trace, and a PromQL query engine, embedded from the real Prometheus evaluator, runs over ClickHouse for long-term metric retention. The complete Kubernetes inventory (Services, Ingress, ConfigMaps, network policies, persistent volumes, CRDs) syncs continuously and is searchable alongside traces and logs. When the copilot identifies a problem, it picks from a catalog of roughly 30 risk-classified safe actions; each action verifies its preconditions, captures a before-state snapshot, executes, checks the result, and rolls back automatically on failure. Disruptive operations pause for explicit human approval before proceeding. An MCP endpoint exposes the identical guardrailed toolbox to external AI agents, so Claude Code or Cursor can operate the cluster through the same safety boundary the browser copilot uses. Complex remediations compose as searchable, forkable Starlark workflows that compile deterministically at save. Running on a dedicated VPS on RepoCloud with guaranteed CPU, RAM, and SSD, full root SSH access, and a browser serial console. Apache-2.0 licensed.
dyrector.io
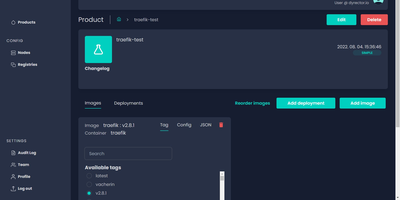
dyrector.io gives teams a visual web interface for deploying and managing containerized applications across Docker, Kubernetes, and Podman environments, replacing repetitive CLI commands and YAML editing with point-and-click configuration. Lightweight Go agents installed on target infrastructure communicate with the central TypeScript platform, enabling deployments to AWS, GCP, Azure, and on-premises servers without requiring infrastructure migration. Unified configuration screens eliminate redundant YAML editing across environments with support for all three container runtimes. Version management lets teams configure OCI-compatible container images once and deploy them as versioned releases with auto-generated changelogs and release notes. Multi-instance deployment enables simultaneous rollouts to multiple nodes with environment-specific configuration overrides, secret management, and instant test environment provisioning from any branch. The fine-grained RBAC system controls user access at project and environment levels, while audit logging tracks every deployment action. Registry integrations support Docker Hub, GitLab, GitHub, Google, and Azure container registries for image sourcing. ChatOps notifications integrate with Slack, Discord, and Microsoft Teams for deployment status alerts. Scheduled releases and workflow support enable automated deployment pipelines triggered by CI events via the REST API with JWT authentication. Running on a dedicated VPS on RepoCloud with guaranteed CPU, RAM, and SSD, full root SSH access, and a browser serial console. Apache 2.0 licensed.