ServiceRadar
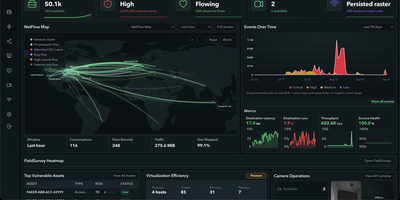
Most teams juggle five consoles to watch one network, and ServiceRadar replaces them with a single operations dashboard for flows, topology, logs, metrics, and alerts. Agents deployed at remote sites keep collecting checks even when the link drops, then deliver their stored records once the connection returns. Discovery over SNMP, LLDP, and CDP builds a topology map that shows traffic between devices, and a NetFlow map traces conversations across the world. Telemetry arrives from OpenTelemetry, syslog, GELF, SNMP polling and traps, BGP, and NetFlow or IPFIX exporters, and a short key:value query language filters any of it. An anomaly engine groups spikes and drift into episodes, so operators get one durable alert instead of a hundred noisy ones. Notification routes with escalation policies page people through Slack, Discord, email, or webhooks, and a delivery log records every attempt. Security views gather scanner findings, threat intelligence matches, and DNS activity, and Ansible playbooks run against inventory devices with live per-host results. Custom checks run as sandboxed plugins, and teams can publish their own dashboards. Managed service providers, multi-site businesses, remote field operations, and homelabs that outgrew a status page are the natural fit. Running on a dedicated VPS on RepoCloud with guaranteed CPU, RAM, and SSD, full root SSH access, and a browser serial console. Apache-2.0 licensed.
Deploy