Saiku Analytics
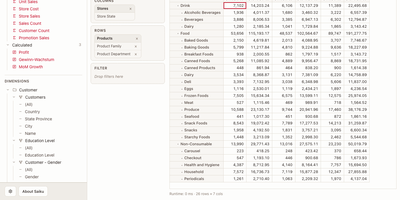
Point Excel, dashboards, and AI agents at one governed cube and Saiku Analytics, an open-source semantic layer, answers all three with the same numbers. The Query Editor writes the MDX as analysts drop measures and levels onto rows, columns, and filters, then shows a pivot grid or 16 chart types such as treemap and sunburst. Dashboards mix KPI, chart, table, text, and image tiles with cross-filtering, drill-down, conditional formatting, and forecast overlays, then export to PDF or PNG, share read-only links, or embed as a web component. An Excel add-in drops governed PivotTables that refresh live, and a Google Sheets add-on inserts cube data as tables that refresh in place. Agents get a typed REST API that lists cubes and measures, accepts JSON questions at /ai/query, and returns the exact field and legal values when validation fails. An MCP server connects Claude Desktop, Cursor, and Cline with a one-click .dxt install, and agent spaces limit each persona to chosen cubes and markdown skills. No semantic model yet? Saiku drafts cubes, dimensions, measures, and joins from a warehouse schema for review. Queries run on DuckDB, ClickHouse, Snowflake, BigQuery, Postgres, and dozens more databases, and model diff flags every saved query or dashboard a schema change would break. Okta and Entra ID provision accounts over SCIM 2.0, and sign-in runs through OIDC or SAML. Running on a dedicated VPS on RepoCloud with guaranteed CPU, RAM, and SSD, full root SSH access, and a browser serial console. Apache-2.0 licensed.
Deploy