InfluxDB
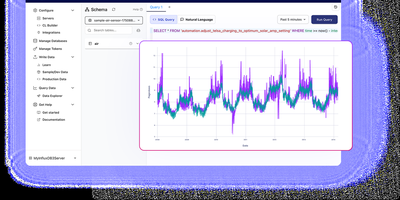
With over 31,600 GitHub stars and thousands of production deployments, InfluxDB 3 Core is the open-source time series database rebuilt in Rust on the FDAP stack — Apache Flight for high-throughput data transfer, DataFusion for vectorized SQL query execution, Arrow for columnar in-memory representation, and Parquet for compressed columnar storage. The engine delivers sub-10ms query response times on recent data and handles millions of writes per second through line protocol ingestion over HTTP, with unlimited tag cardinality eliminating the high-cardinality limitations that plagued earlier InfluxDB versions. The diskless architecture persists data as compressed Parquet files to S3-compatible object storage, Azure Blob, Google Cloud Storage, or local disk with configurable partitioning strategies, while the write-ahead log and in-memory buffer serve real-time queries against recent data before compaction. Native SQL support through DataFusion includes window functions, CTEs, subqueries, and joins, while InfluxQL maintains backward compatibility with existing InfluxDB 1.x and 2.x applications through the same query API. The embedded Python VM enables processing engine plugins and triggers that execute custom logic on write events, perform cross-database queries, and transform data in real time without external tooling. Flight SQL clients provide high-performance query access from Python, Go, Java, and Rust, and the HTTP API supports writes in line protocol format compatible with Telegraf's 300+ input plugins. Running on a dedicated VPS on RepoCloud with guaranteed CPU, RAM, and SSD, full root SSH access, and a browser serial console. MIT/Apache 2.0 dual-licensed.
Emoncms
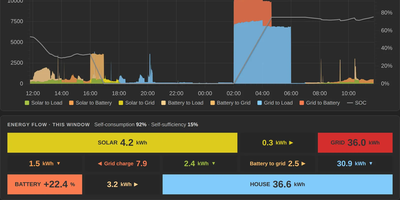
Energy meters, solar systems, heat pumps, and temperature sensors report to Emoncms, which logs every reading as a time series and turns it into graphs, dashboards, and ready-made apps. Readings arrive over an HTTP input API, MQTT topics beneath emon/, or AES-encrypted posts for devices without HTTPS, from scripts, Node-RED, Home Assistant, or emonHub. Input processing calibrates values, combines inputs, converts watts to cumulative kilowatt-hours, and logs the result to a feed. Device templates configure known hardware in one step, and schedules limit processes to set time windows. The graph viewer plots feeds on two axes, groups them into daily, weekly, monthly, or annual bars, and offers feed statistics and CSV export. Virtual feeds calculate values like heat pump COP on request and store nothing; post processing rebuilds feeds from recorded data. My Electric Flow charts live solar, battery, and grid power with an energy-flow breakdown and a Tariff explorer for Octopus Agile and other time-of-use tariffs. My Heatpump reports COP and SCOP. Other apps cover boilers, solar diversion, CO2 air change rates, and the UK grid fuel mix. The dashboard editor places dials, gauges, thermometers, charts, text, and images, and a dashboard can be made public. Sync uploads feeds to another server on a schedule and downloads them for recovery; the Backup module backs up and restores data. Running on a dedicated VPS on RepoCloud with guaranteed CPU, RAM, and SSD, full root SSH access, and a browser serial console. AGPL-3.0 licensed.
VictoriaMetrics
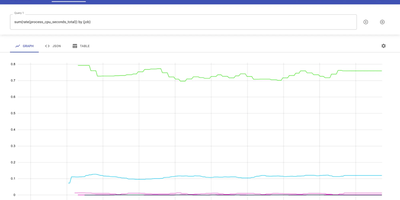
Trusted by thousands of organizations processing billions of time series data points and backed by 17,000+ GitHub stars, VictoriaMetrics delivers a monitoring and time series database that outperforms Prometheus by 16x on query speed while consuming 2.5x less disk space through its optimized compression and storage engine. The architecture supports both single-node deployments handling 10M+ active time series and a horizontally scalable cluster version with vminsert, vmstorage, and vmselect components providing multi-tenancy, replication, and independent namespace isolation. Data ingestion accepts both push protocols including InfluxDB line protocol, Graphite plaintext, OpenTSDB HTTP, CSV, and OpenTelemetry OTLP alongside pull-based Prometheus scraping and remote write, enabling drop-in replacement of existing monitoring stacks without reconfiguring exporters. MetricsQL extends standard PromQL with additional functions, subqueries, and implicit time range alignment while maintaining full backward compatibility with existing Prometheus alerts and Grafana dashboards. The vmalert component processes recording and alerting rules with Alertmanager integration, while vmbackup and vmrestore enable point-in-time snapshots to S3, GCS, and Azure Blob Storage. Stream aggregation operates as a StatsD alternative for pre-aggregating high-cardinality metrics before storage. NFS-compatible storage backends including Amazon EFS and Google Filestore allow shared persistent volumes across cluster nodes. Running on a dedicated VPS on RepoCloud with guaranteed CPU, RAM, and SSD, full root SSH access, and a browser serial console. Apache-2.0 licensed.
Apache IoTDB
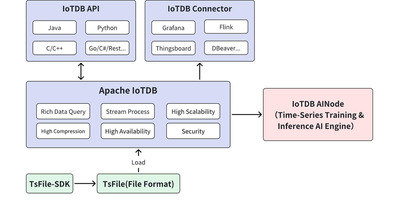
Sensors on factory floors, wind turbines, and connected vehicles produce readings every second, and Apache IoTDB is the time-series database built to store those readings and answer questions over them. Devices write through client sessions that tolerate out-of-order, delayed, and multi-frequency arrivals, so a gateway that reconnects after an outage can backfill history without corrupting the timeline. Series live in a device hierarchy you can browse like a directory tree, or in tables queried with standard SQL, common table expressions, set operations, and more than one hundred built-in aggregation and time-series functions. The TsFile columnar format shares one time column across aligned series and applies encodings designed for sensor data, which keeps high-frequency archives compact while Spark and Hadoop jobs read the same files directly for larger analysis. Pipe synchronization streams records or transfers whole TsFiles between edge sites and central clusters with path and device filtering, so plants keep collecting locally while headquarters queries a continuous copy. AINode brings forecasting, anomaly detection, and missing-value imputation into the database itself: register a model with SQL, then ask for predictions in the same query language instead of shipping measurements to a separate machine learning service. A low-memory Edge edition runs collection on constrained gateways, and clusters scale by adding DataNodes under ConfigNode coordination with automatic load balancing. Running on a dedicated VPS on RepoCloud with guaranteed CPU, RAM, and SSD, full root SSH access, and a browser serial console. Apache-2.0 licensed.