Categories
Monitoring Observability Alerting OpenTelemetry Distributed Tracing APM AIOps Root Cause AnalysisStars
Forks
Watchers
Developer links
DataBuff
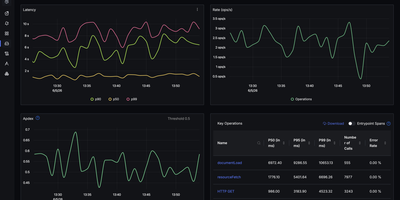
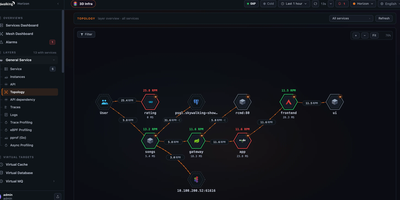
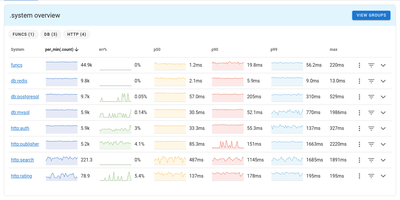
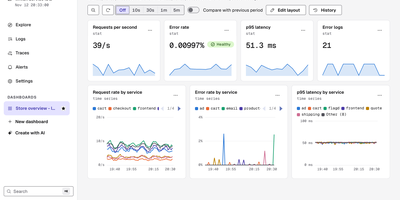
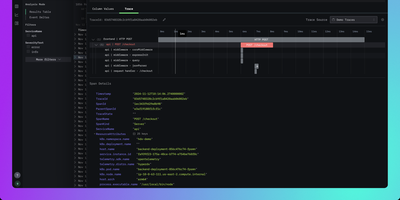
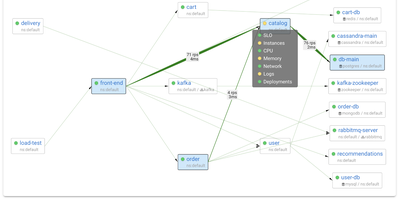
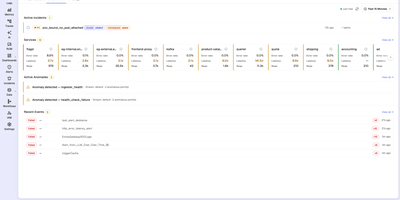
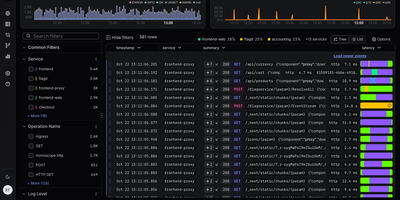
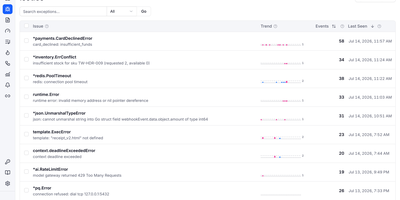
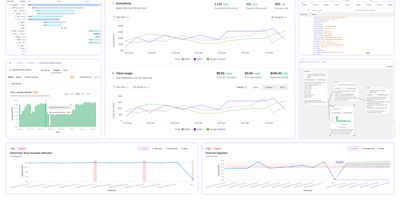
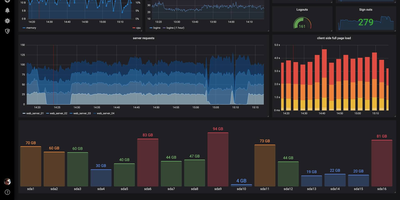
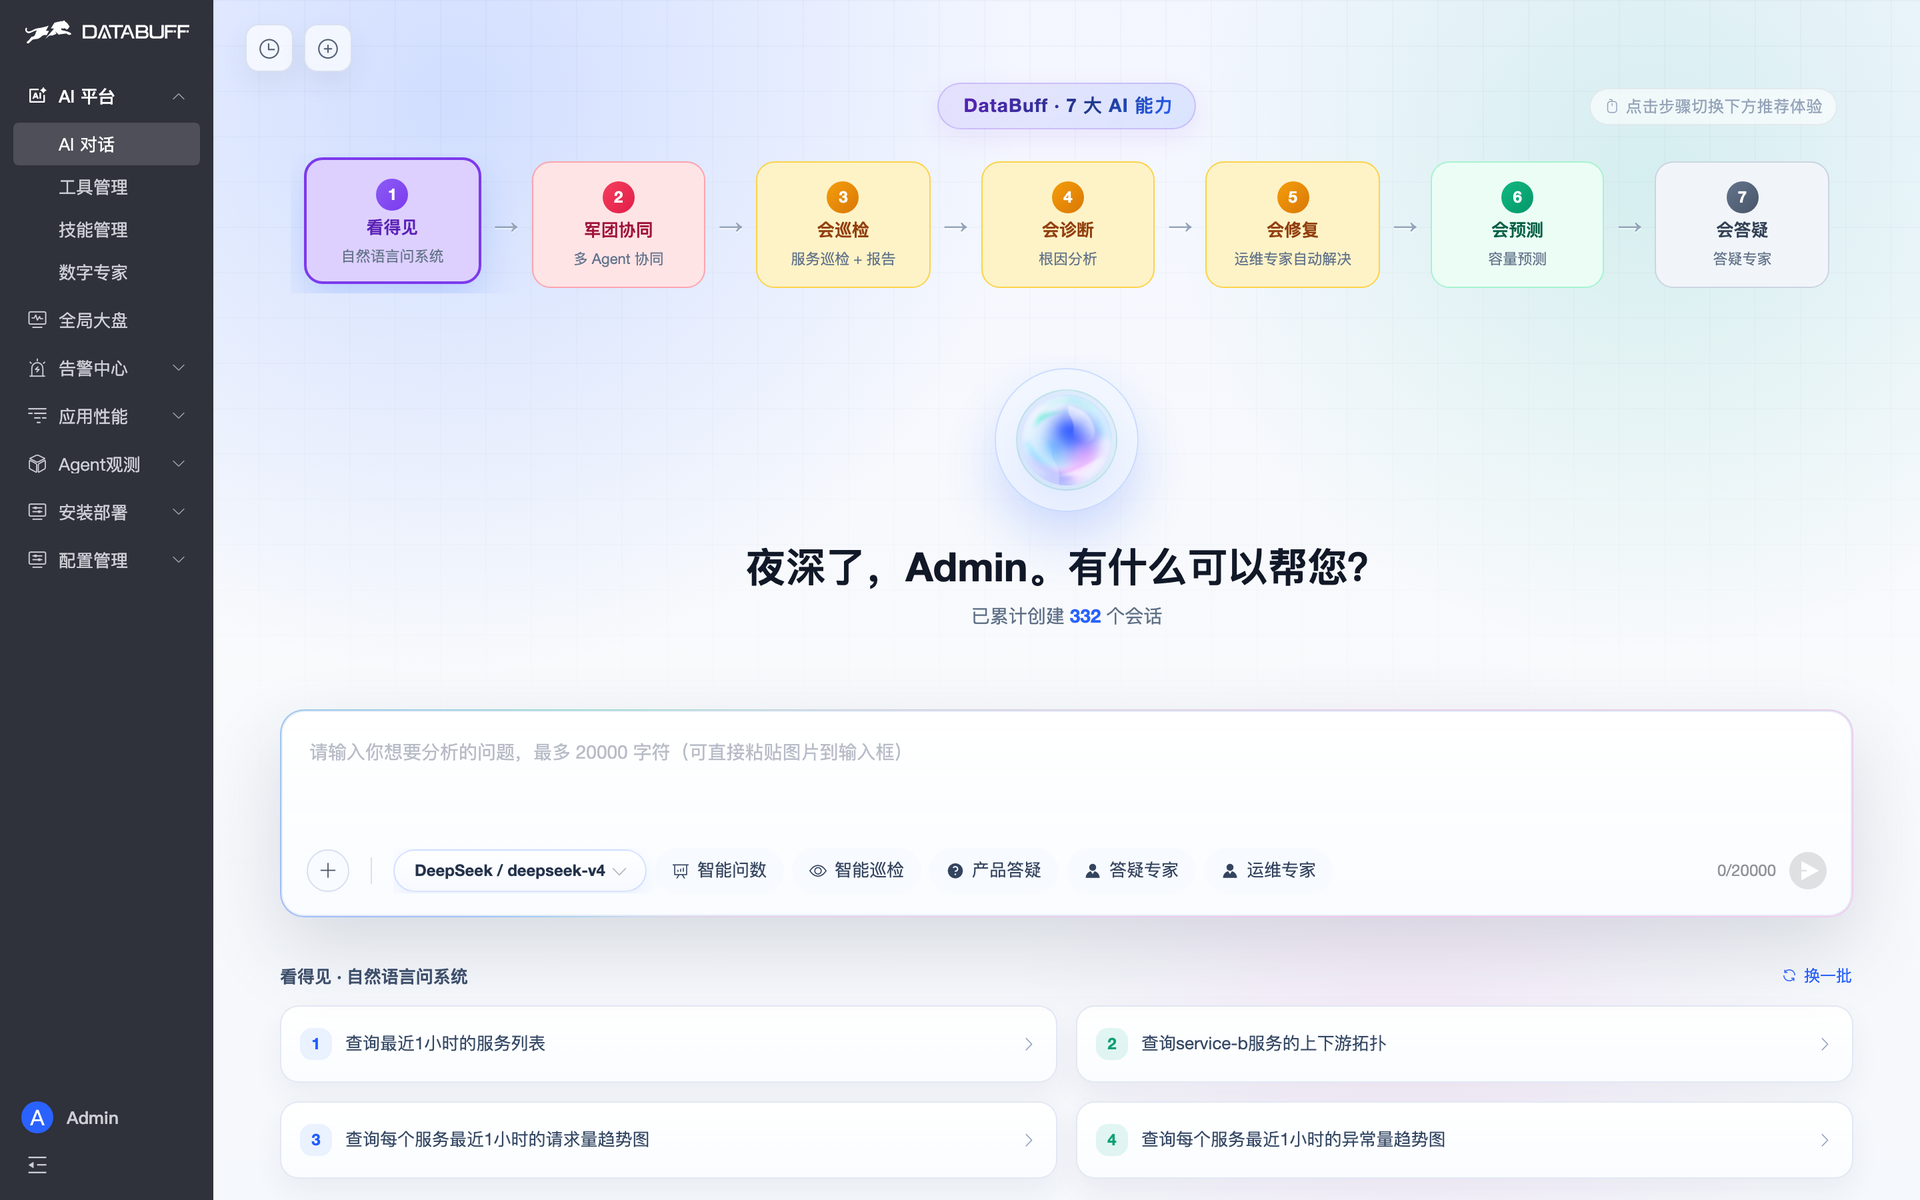
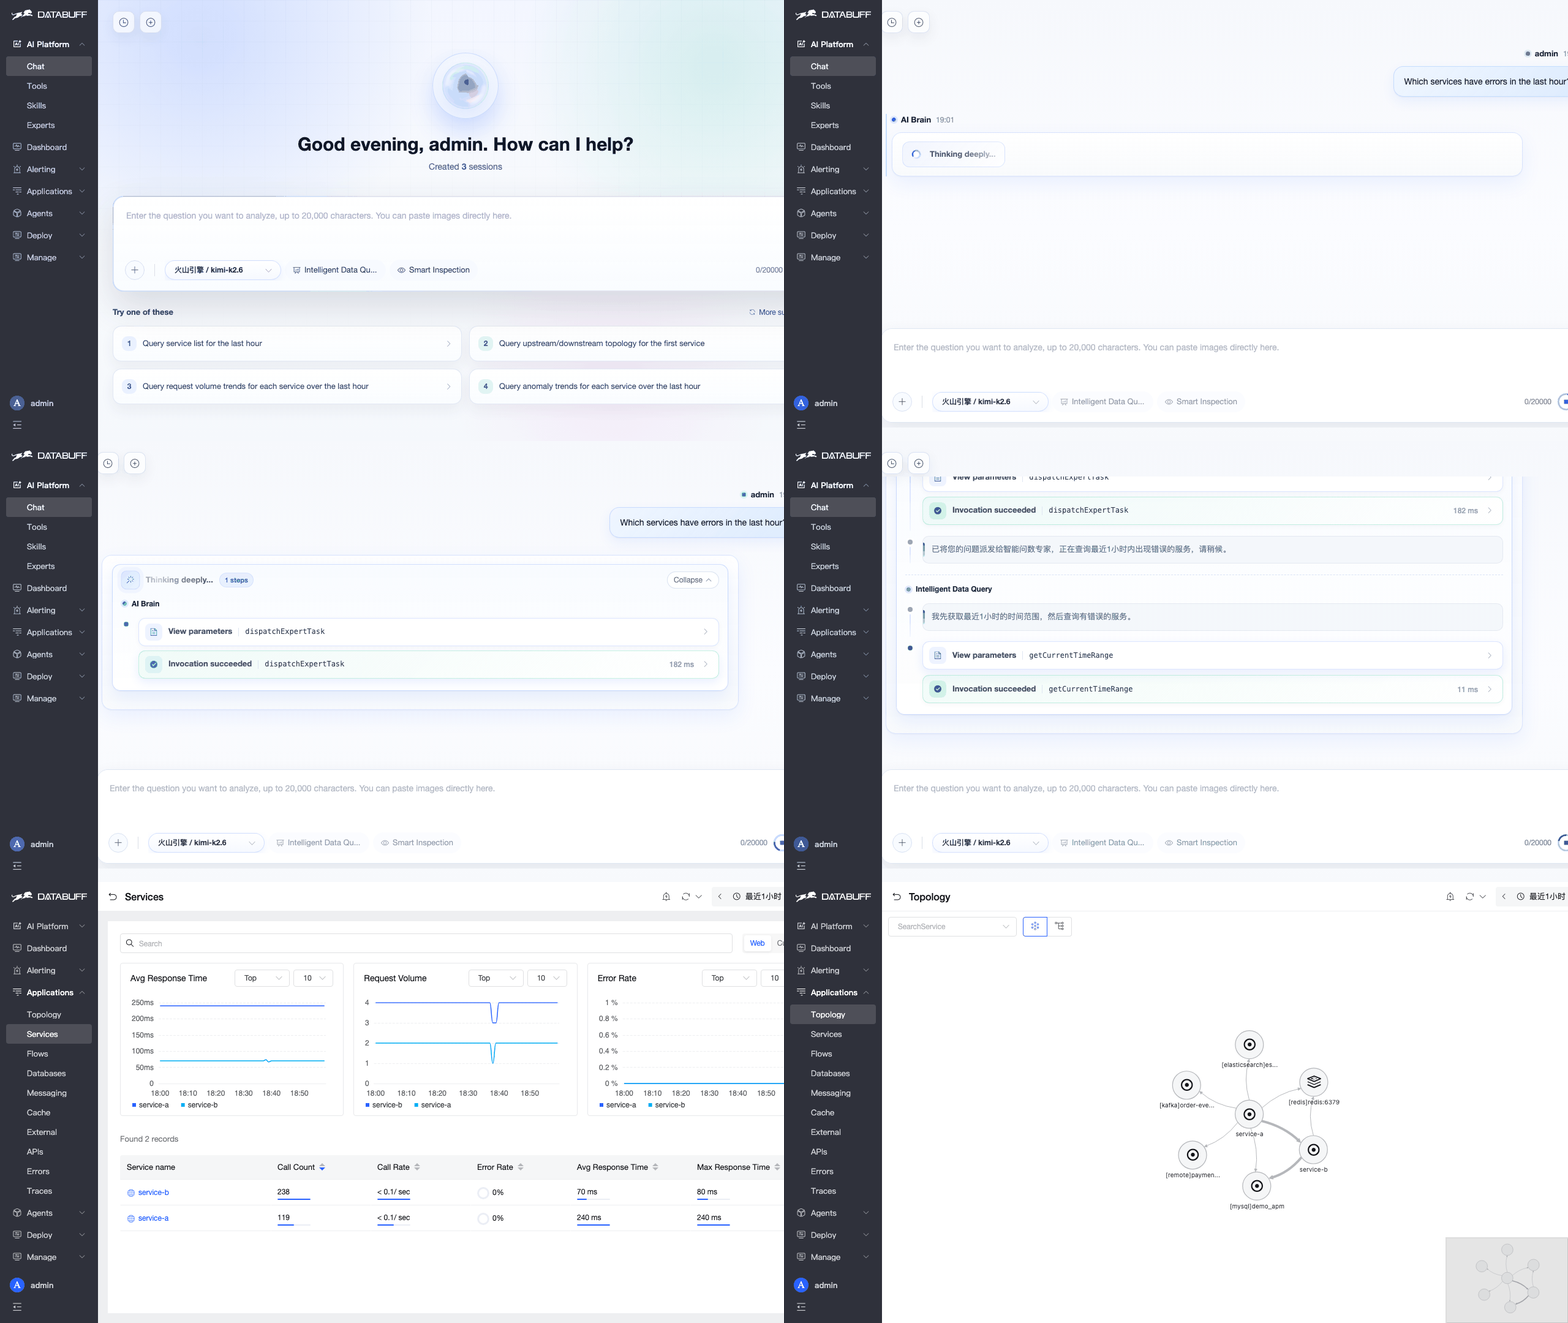
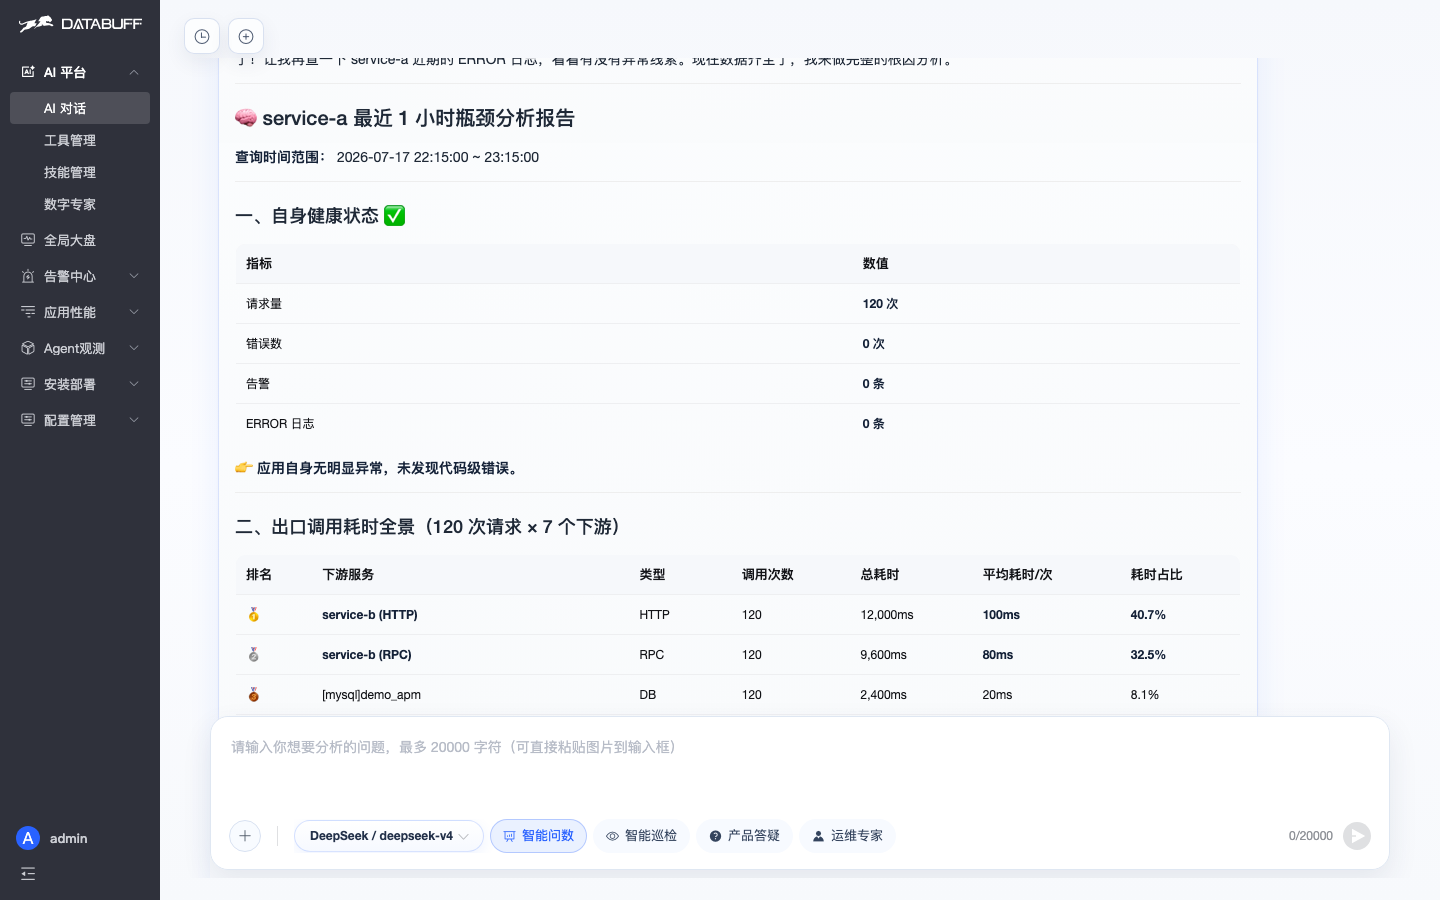
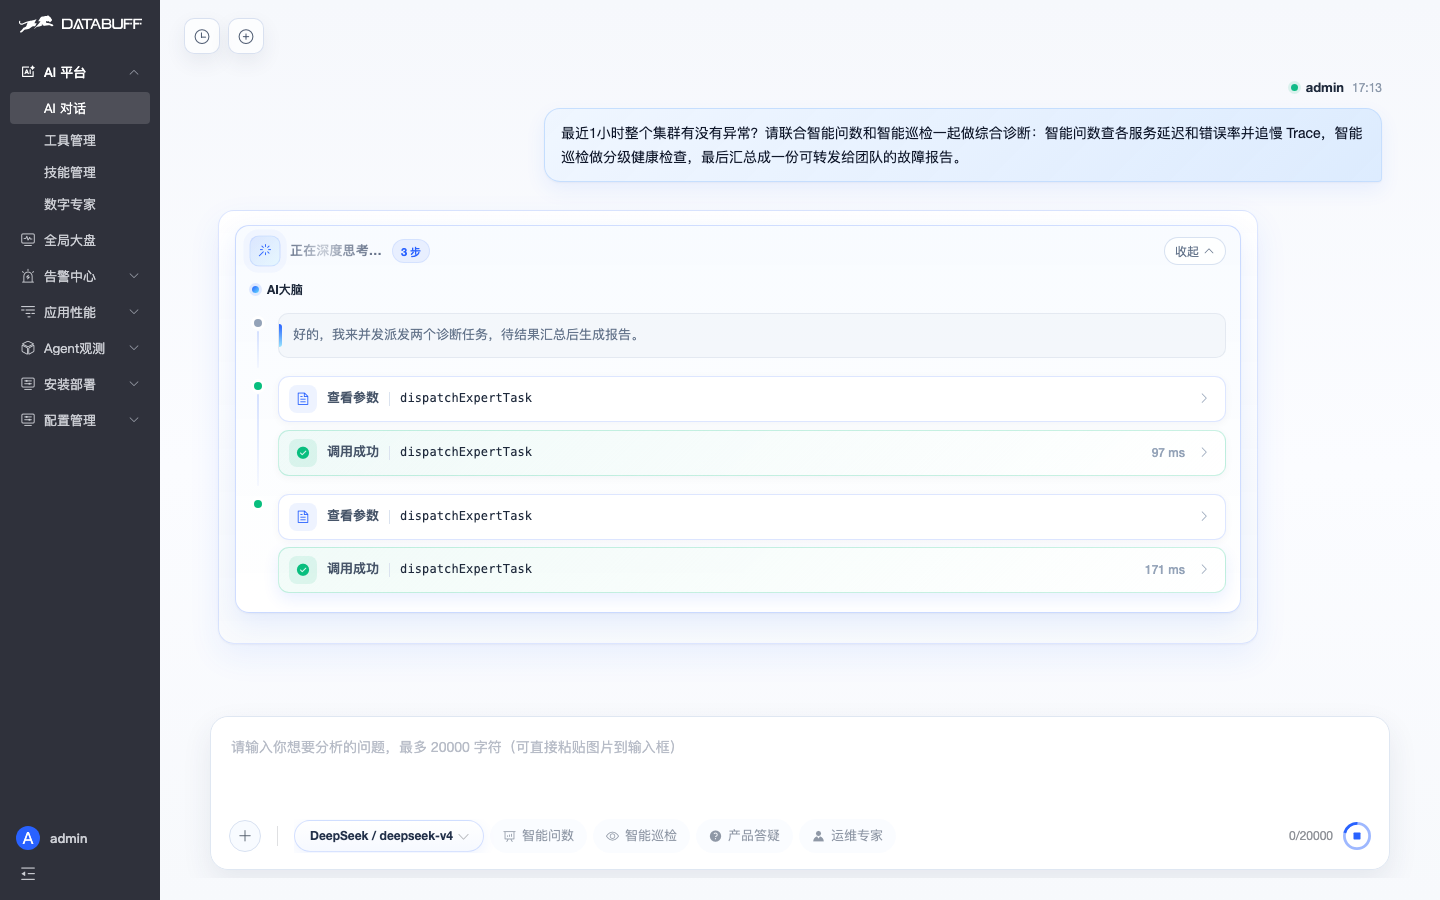
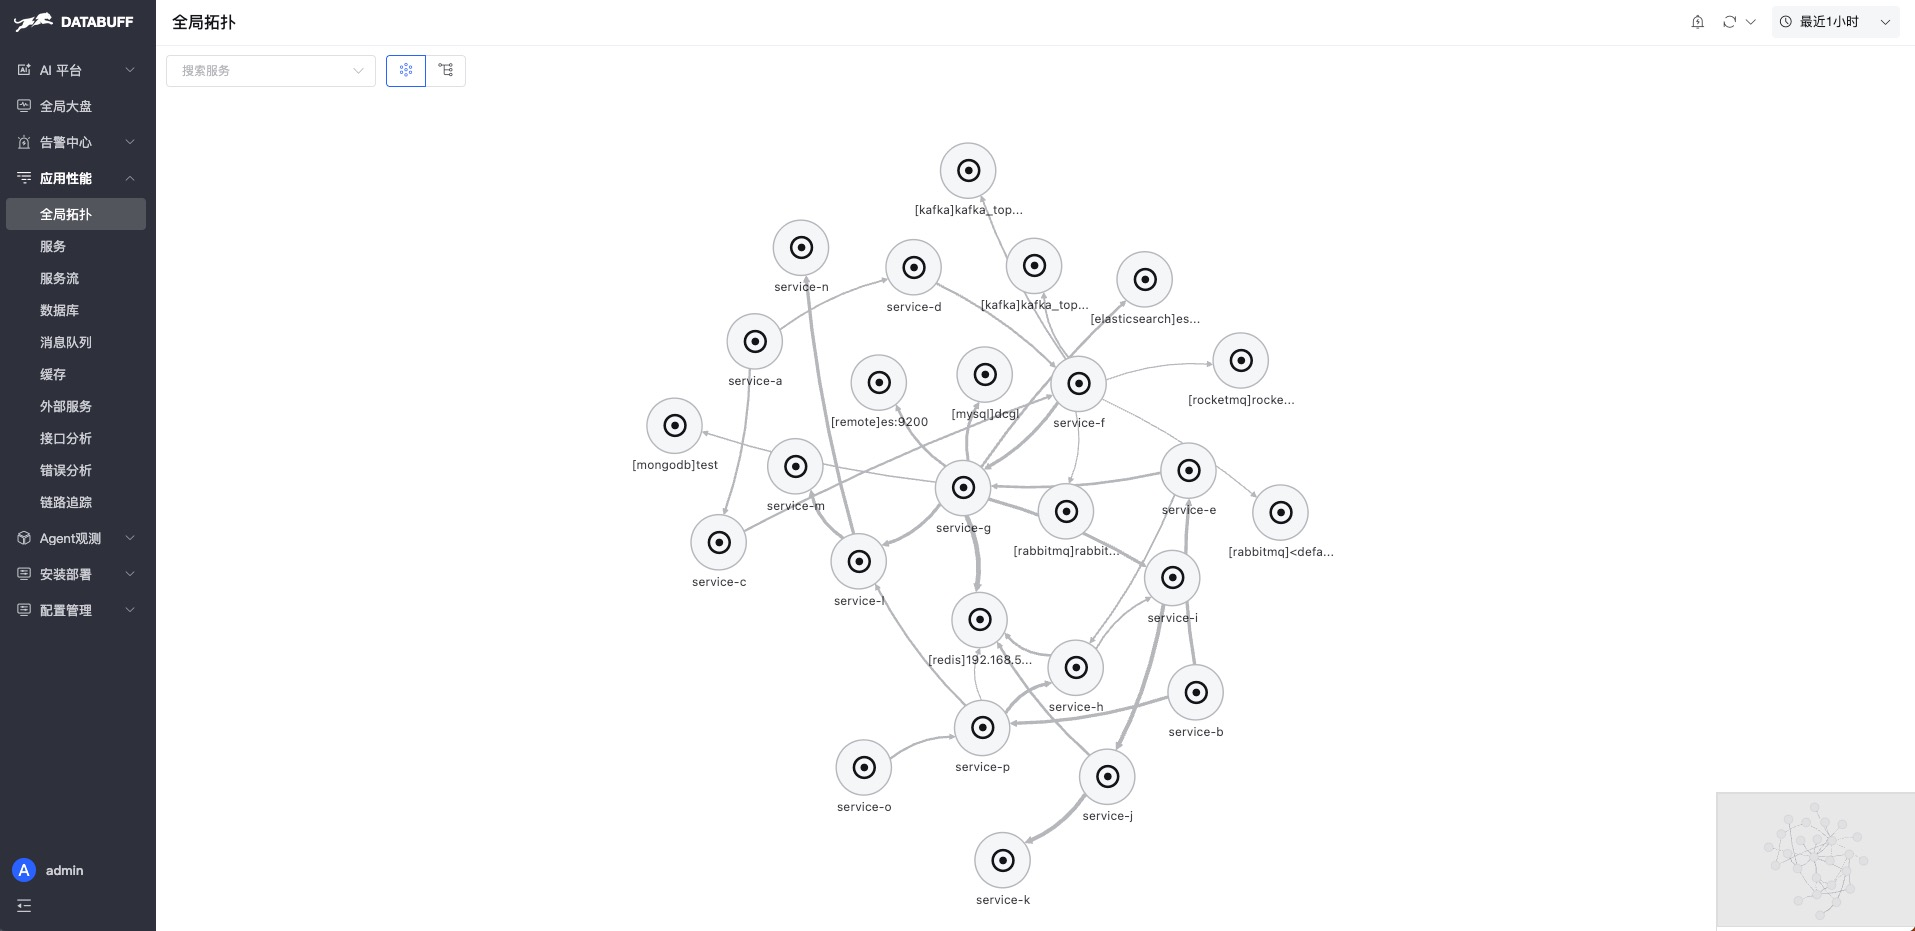
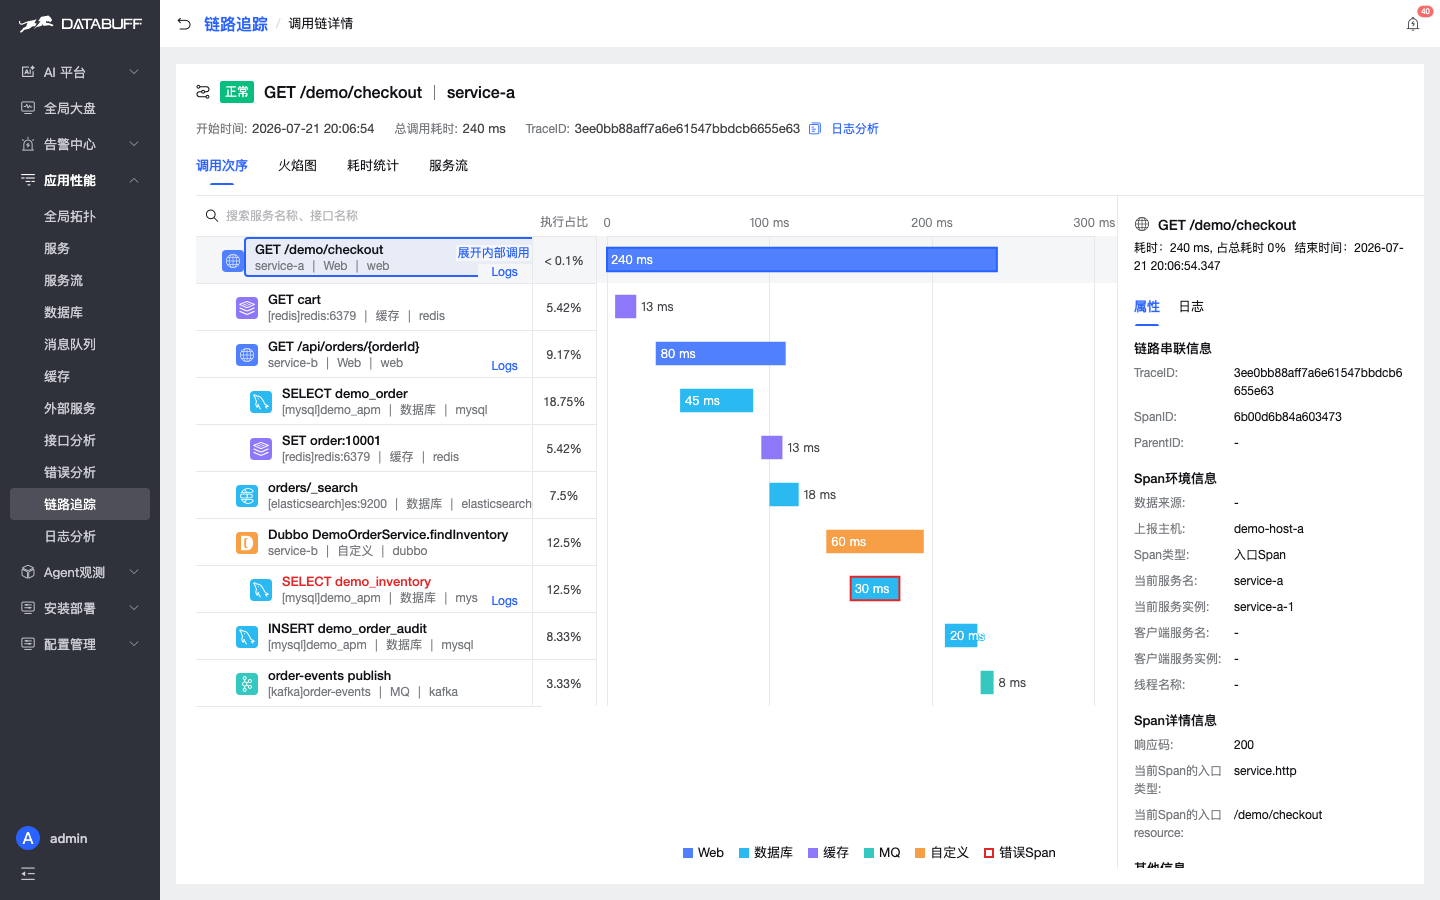
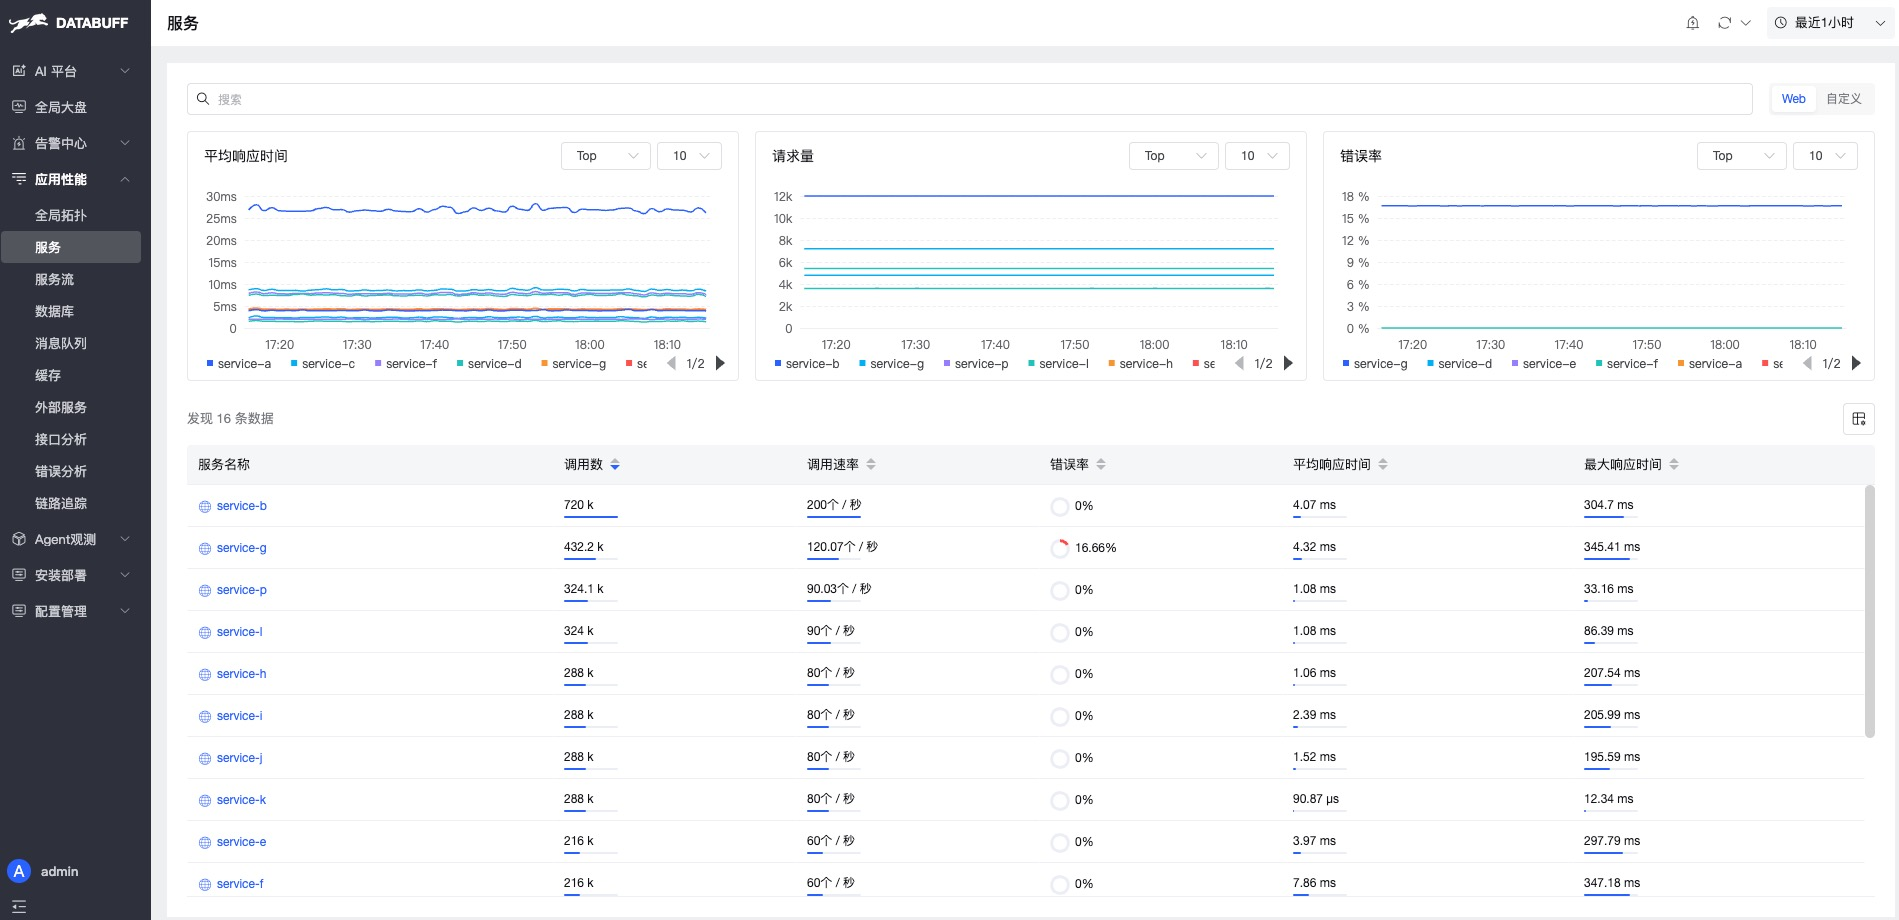
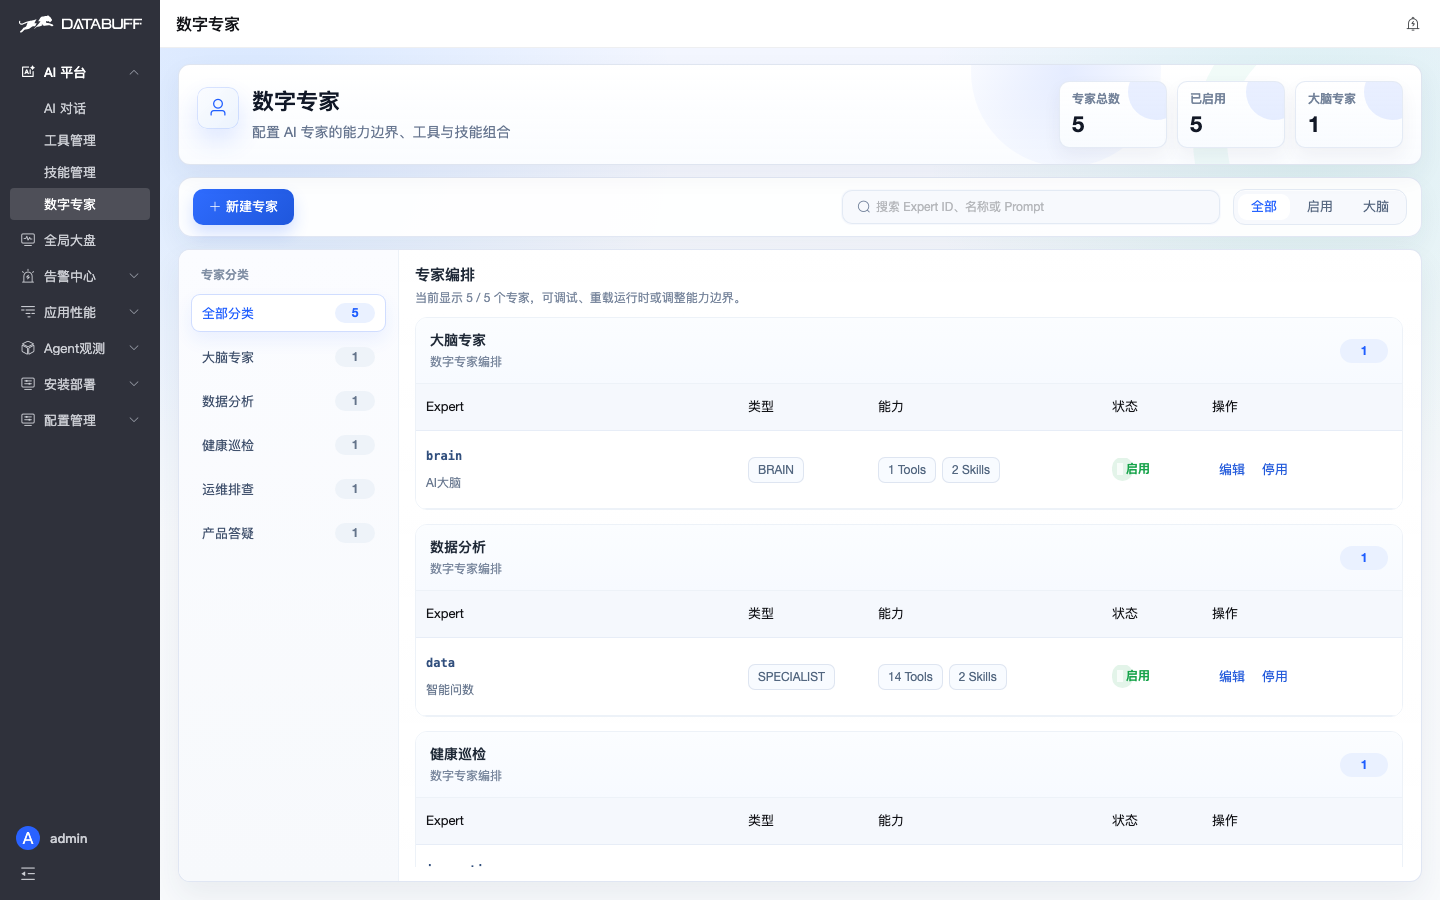
Instead of clicking through charts, you ask DataBuff which service is slowest, and the answer comes straight from live OpenTelemetry traces, metrics, topology, and alerts. The AI Brain runs query and inspection experts in parallel and merges their findings into one forwardable report. Global topology turns failing services red, and service flow shows who calls whom, down to databases, caches, and queues. Click a latency spike to open the matching traces, then read the span waterfall to find the slowest span. The Slow SQL tab ranks statements by call count, and error analysis groups failures by exception type. Alert rules apply thresholds or change detection to error rate, latency, or request count, and alerts resolve themselves when metrics recover. Any alert shows related traces and logs, offers AI root-cause analysis, and can post JSON to a webhook. Telemetry arrives over OTLP from OpenTelemetry SDKs, Collectors, Nginx, or an eBPF DaemonSet, and SkyWalking agents connect through their native gRPC. Cursor and Claude Code call 15 platform tools over MCP, and Prometheus, SkyWalking, or Zabbix join custom digital experts. A key under Model Settings switches the AI on, with Kimi, DeepSeek, GLM, Ollama, or other OpenAI-compatible endpoints behind it. One Docker command installs ingest, storage, and the web platform, with Kubernetes and offline installs also available. Running on a dedicated VPS on RepoCloud with guaranteed CPU, RAM, and SSD, full root SSH access, and a browser serial console. AGPL-3.0 licensed.
Benefits
- Ask Questions, Skip Dashboards
- Natural-language queries answer from live traces, metrics, topology, and alerts, so on-call engineers ask which service is slowest instead of building charts or learning a query language.
- Standard OpenTelemetry Ingestion Built In
- Existing OpenTelemetry instrumentation works as is over OTLP gRPC and HTTP, and SkyWalking agents connect by changing only the exporter address, which eases migration.
- Parallel AI Experts Write Reports
- An AI brain dispatches query, inspection, operations, and Q&A experts together, then merges their findings into one incident report ready to forward to your team.
- Small Footprint, One Command Install
- Only ingest, Doris storage, and web containers run, installed by a single Docker script, so you avoid a sprawling middleware stack; 8 CPU cores and 16 GB RAM are recommended.
Features
- Natural Language Telemetry Query
- Ask in plain language for service lists, request trends, slow traces, topology, and alerts; results come back as tables and charts built from live data.
- Multi-Agent AI Brain
- Dispatches query, inspection, operations, and Q&A experts in parallel, shows a reasoning trace of each tool call, and supports custom digital experts.
- Topology and Service Flow
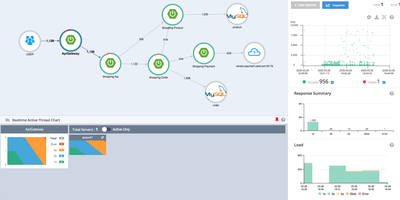
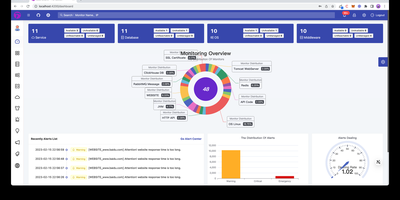
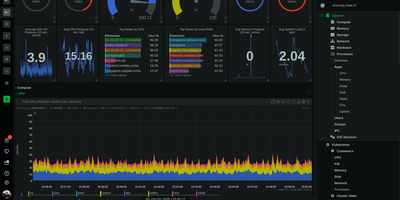
- Global topology and service flow graphs highlight failing nodes and latency contribution per downstream service, then drill into service, endpoint, database, cache, and queue views.
- Trace Waterfall Analysis
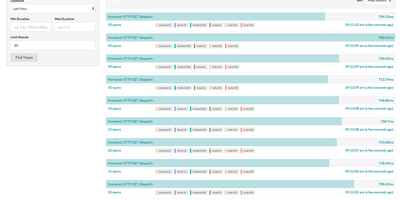
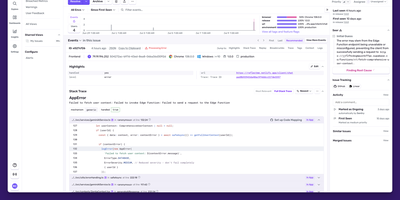
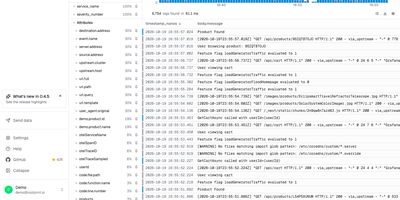
- Search traces, open a waterfall of spans with errors marked, inspect span attributes, and cross-check slow SQL by call count from database views.
- Alerting and Webhooks
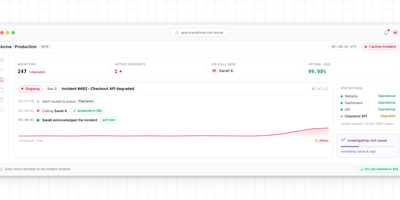
- Threshold and change-detection rules evaluate every minute, record trigger and recovery events, push JSON to webhooks, and open AI root-cause analysis from any alert.
- MCP and Model Choice
- Register external MCP tools such as Prometheus, expose platform queries to Cursor or Claude, and bring Kimi, DeepSeek, GLM, Ollama, or OpenAI-compatible models.