ClickStack
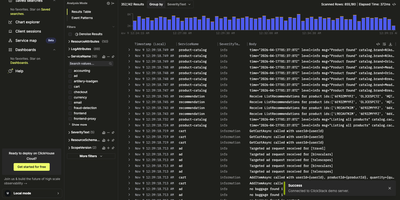
ClickStack is an open-source observability platform that unifies logs, metrics, traces, session replays, and errors in one searchable interface, so engineers can move from an alert to the exact request that broke in minutes. Search uses an intuitive full-text and property syntax (for example level:err), with SQL available when a question needs full analytical power. Live tail streams fresh logs and traces as they arrive, and event deltas surface anomalies by comparing current behavior against earlier windows. Dashboards chart high-cardinality events without a complex query language, and alerts can be created in a few clicks from any search or chart. Session replays connect a user's browser experience to the backend traces and database queries behind it, giving full-stack visibility from click to query. Native JSON string querying handles nested payloads, and the schema-agnostic design works on top of an existing ClickHouse schema instead of forcing a new one. OpenTelemetry is supported out of the box, with SDKs and collectors for Kubernetes, JavaScript, Python, Java, Go, Ruby, PHP, .NET, Elixir, and Rust. The all-in-one Docker image bundles the interface, ClickHouse, the OpenTelemetry Collector, and supporting services on port 8080, and a terminal CLI serves engineers who prefer the shell. Running on a dedicated VPS on RepoCloud with guaranteed CPU, RAM, and SSD, full root SSH access, and a browser serial console. MIT licensed.
Monoscope
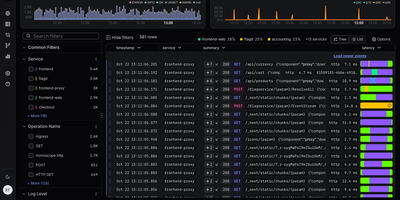
Across logs, traces, and metrics, Monoscope gives engineering teams one self-hosted workspace for finding what broke, asking questions in plain English, and hearing about problems before users do. Start in the Explorer: search events with KQL or an Ask AI prompt, flip between log rows, bar and line charts, log patterns, and sessions, and narrow results with facets for service, level, and HTTP status. Open any span to read its attributes, then follow the full trace across services in a waterfall, timeline, or map view. Live Tail streams new events as they arrive, and the Service Map draws every dependency with its error rate, latency, and requests per second. Build dashboards from widgets with copyable KQL and SQL, then set scheduled monitors with warn and alert thresholds, cron monitors, and uptime checks. An Issues inbox gathers API changes, errors, and log patterns so each one can be acknowledged, archived, or marked as spam, while Reports send scheduled summaries by email. Telemetry arrives over OTLP gRPC on port 4317 from OpenTelemetry SDKs and collectors. The monoscope CLI emits JSON for scripts, and an MCP server at /api/v1/mcp lets Claude, Cursor, and Cline search events and triage issues. Natural-language search uses the OpenAI-compatible model you configure. Running on a dedicated VPS on RepoCloud with guaranteed CPU, RAM, and SSD, full root SSH access, and a browser serial console. AGPL-3.0 licensed.
LaraOwl
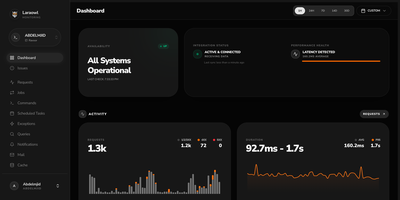
LaraOwl watches your Laravel applications from your own server, streaming every request, exception, slow query, and attack attempt into one live dashboard. Install one Composer package in each app, point it at your LaraOwl server, and requests arrive with method, path, status, duration, and middleware timing attached. Exceptions group themselves by fingerprint with stack traces, occurrence counts, and first and last seen times, so a resolved bug that comes back announces itself. Slow queries and N+1 patterns are flagged with execution times, jobs report failures and retries, and scheduled tasks check in like heartbeats that complain when they stop. A built-in security lens scores threats such as SQL injection, cross-site scripting, and path traversal, tracks hostile IPs, and can push a block into your Cloudflare firewall in one click. Uptime checks run every thirty seconds, alerts fan out to Slack, Discord, Telegram, email, or any webhook, and throttles keep a bad night from becoming a thousand messages. Teams organize multiple projects with their own tokens, thresholds, and retention policies, and daily pruning keeps last quarter's noise from filling the disk. Running on a dedicated VPS on RepoCloud with guaranteed CPU, RAM, and SSD, full root SSH access, and a browser serial console. Apache-2.0 licensed.
Sentry
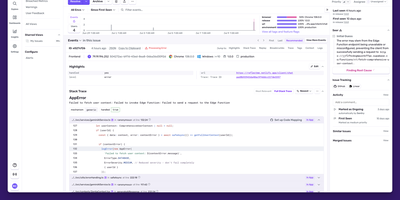
Backed by 44,000 GitHub stars and trusted by over four million developers, Sentry is the debugging platform that captures errors, traces, replays, profiles, and metrics from your applications and connects them all through distributed tracing. The error tracking engine captures full stack traces with source context, breadcrumbs, and automatic demangling for native crashes, while intelligent grouping consolidates duplicate events into actionable issues with regression detection and automatic assignment. Performance monitoring instruments your frameworks automatically, capturing every database query, API call, cache hit, and queue operation as spans within distributed traces that flow across frontend, backend, and mobile boundaries. Session Replay produces video-like recordings of real user sessions showing DOM interactions, network requests, console messages, and errors on a synchronized timeline, with AI-powered summaries that describe what happened without watching the full replay. Continuous profiling captures CPU execution data at the function and line level for Node.js, Python, iOS, and Android, linking slow spans directly to the exact code responsible. Cron monitoring tracks scheduled jobs for failures, missed runs, and duration anomalies. The alerting engine fires notifications through Slack, PagerDuty, Opsgenie, and webhooks on new issues, regressions, error spikes, or when latency and crash-free session rate thresholds are crossed. Self-hosted deployment runs as a Docker Compose stack with PostgreSQL, ClickHouse, Kafka, Redis, and Relay. Running on a dedicated VPS on RepoCloud with guaranteed CPU, RAM, and SSD, full root SSH access, and a browser serial console. FSL licensed.