Appsmith
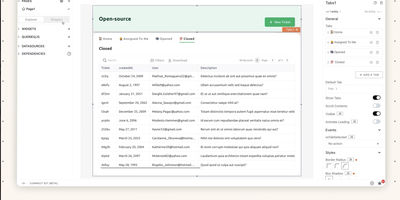
Admin panels, database GUIs, dashboards, approval flows, customer support consoles - Appsmith builds the internal tools your team keeps postponing, on an open-source low-code platform. The UI assembles from 45+ drag-and-drop widgets - tables with server-side pagination and inline editing, charts, forms, lists, buttons - which bind to data through {{ }} JavaScript expressions anywhere in the editor. Datasources cover PostgreSQL, MySQL, MongoDB, MS SQL, Redis, Snowflake, and more, plus any REST or GraphQL API, with SaaS integrations and AI query support for prompt-based steps inside apps. When the widget library falls short, custom widgets are plain JavaScript, HTML, and CSS, and external JS libraries can be imported, which keeps the platform extensible where pure no-code tools hit walls. Git-based version control enables branch-based collaboration, review, and rollback of app definitions. Queries and JS objects hold the business logic layer between datasources and UI. Self-hosted via Docker or Kubernetes, with role-based access control for published apps.
Home Assistant
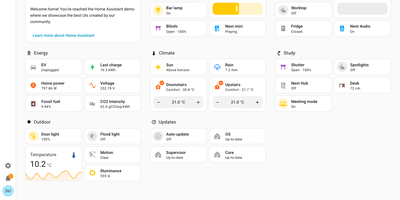
Your house already has lights, locks, sensors, thermostats, and speakers from many brands, and Home Assistant gives them one local control room with no vendor cloud in the loop. To close the shutters when the outdoor temperature holds above 25 °C, or to be alerted when the garage door is left open, build the routine in the visual editor: When, And if, Then do. Scenes, scripts, and blueprints package it for reuse, and run traces show what it did. More than 1,500 integrations cover Zigbee, Z-Wave, Matter, Thread, MQTT, ESPHome, Bluetooth, Hue, and Sonos, and network discovery offers known devices for one-step setup. To see the house at a glance, drag tile, thermostat, gauge, graph, and map cards into a dashboard, then put it on a TV with Home Assistant Cast. The Energy dashboard answers where the power goes, drawing solar, grid, battery, gas, and water as one distribution diagram with cost totals and per-appliance tracking. To talk to the house, use Assist: natural-language commands, wake words, and custom sentences run locally or through Home Assistant Cloud. The map panel shows who is home, plotting people against zones such as Home, Work, and School from the iOS and Android companion apps. Areas and labels keep large setups tidy, and multi-factor authentication guards each account. Running on a dedicated VPS on RepoCloud with guaranteed CPU, RAM, and SSD, full root SSH access, and a browser serial console. Apache-2.0 licensed.
CLIProxyAPI Dashboard
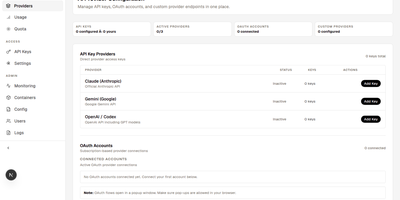
CLIProxyAPI Dashboard puts a web console in front of CLIProxyAPI so you manage AI providers, keys, quotas, and containers through forms instead of YAML files. Connect Claude Code, Codex, xAI, Antigravity, Kimi, and Devin accounts with OAuth, then add Gemini CLI, GitHub Copilot, Kiro, and Cursor through plugins you install and configure from the settings store. Any OpenAI-compatible endpoint can join as a custom provider with model mappings, and admins can mark a provider as shared so the whole team uses it. You create, revoke, and track API keys with per-user ownership, manage dashboard users and admin rights, and stream live logs beside container health. Quota views track rate limits per provider and per model, and Telegram alerts fire when remaining quota drops below your threshold. Usage analytics break down request counts, provider share, model statistics, error rates, and estimated cost. Configuration syncs to OpenCode automatically, model configurations travel as share codes, and backups can be created, scheduled, previewed, and restored from settings. One-click updates refresh the dashboard and proxy images, containers start and stop from the panel, and automatic TLS keeps the console reachable under your domain. Running on a dedicated VPS on RepoCloud with guaranteed CPU, RAM, and SSD, full root SSH access, and a browser serial console. MIT licensed.
TeslaMate
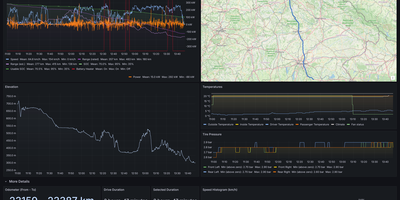
Logging every drive, charge, and idle stretch of a Tesla to a database you own, TeslaMate shows where the battery went, including degradation, vampire drain, and charging cost. Battery health comes first: the dashboard estimates usable capacity, range lost, and degradation against mileage. Idle losses come next, with Vampire Drain listing how much charge disappears during every idle period and a States view recording every online, asleep, and offline stretch. The car is left alone to fall asleep, so logging adds no extra vampire drain. Charging sessions show curves, energy added and used, efficiency, and cost, using per-location prices attached to geo-fences drawn on a map. Each drive records second-by-second speed, power, elevation, and temperature, plotted on a route map beside tire pressure and consumption charts. Trip, Drives, Efficiency, Drive Stats, Mileage, Updates, Statistics, and a lifetime driving map fill in the rest. Live vehicle data goes out over MQTT to Home Assistant, Node-RED, and Telegram, and old history imports from TeslaFi or tesla-apiscraper. Several vehicles on one Tesla account work together, addresses are looked up automatically, and the web interface offers light, dark, or system themes in 19 languages. Sign-in uses Tesla access and refresh tokens that TeslaMate encrypts with a key you set. It works best on an always-on server. Running on a dedicated VPS on RepoCloud with guaranteed CPU, RAM, and SSD, full root SSH access, and a browser serial console. AGPL-3.0 licensed.
Edict
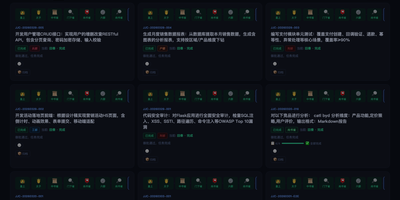
Edict is a multi-agent orchestrator that runs every AI request through a court-style chain: a crown prince agent triages it, a planning department drafts the work, a review department can veto the plan, and specialist ministries execute what survives. Casual chat gets a direct reply, while real commands become kanban tickets whose titles are scrubbed of file paths and metadata. A vetoed plan returns for rework; an approved one is dispatched in parallel to ministries for finance, documentation, engineering, compliance, infrastructure, and HR. Commands arrive through Feishu, Telegram, or Signal channels configured in OpenClaw. The dashboard shows cards by state with heartbeat badges and stop, cancel, and resume controls, plus a department monitor and a memorial archive that turns finished work into five-phase timelines you can copy as Markdown. Nine edict templates add parameter forms and cost estimates, an officials panel ranks agents by merit score while tracking token spend, and per-agent model switching restarts the gateway in about five seconds. Agent thinking, tool calls, and results stream live. A permission matrix limits who may message whom, illegal state jumps are rejected, and every transition lands in an audit log. Worked examples cover competitive analysis, code review, and weekly reports. Dashboard login protects the console, and a systemd unit keeps it running across reboots. Running on a dedicated VPS on RepoCloud with guaranteed CPU, RAM, and SSD, full root SSH access, and a browser serial console. MIT licensed.
World Monitor
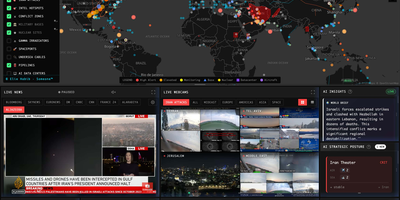
World Monitor replaces twenty or more browser tabs by fusing geopolitical, military, financial, and infrastructure signals onto a single interactive canvas built with TypeScript, Vite, globe.gl with Three.js for the 3D globe, and deck.gl with MapLibre GL for the flat map. World Monitor ingests live data from 530 upstream sources including ACLED and UCDP for conflict events, OpenSky Network for military and civilian aircraft, AISStream for vessel positions, NASA FIRMS for satellite fire detection, USGS for earthquakes, and FRED, IMF, BIS, and Finnhub for macroeconomic and market data. The Country Instability Index v8 computes real-time stress scores across 31 Tier-1 nations, while the finance radar tracks 29 stock exchanges, commodities, and cryptocurrency with a 7-signal market composite. Six specialized dashboard variants — World, Tech, Finance, Commodity, Energy, and Happy — deploy from a single codebase. AI summarization runs locally through Ollama and LM Studio integration or optionally via Groq and OpenRouter cloud providers, with Transformers.js powering browser-side inference. The platform supports 26 languages with native-language feeds and RTL layout, and provides MCP server integration for AI agent connectivity. Running on a dedicated VPS on RepoCloud with guaranteed CPU, RAM, and SSD, full root SSH access, and a browser serial console. AGPL-3.0 licensed.
DevTrack
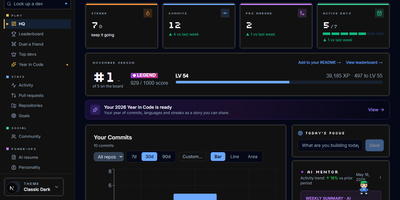
DevTrack turns your GitHub activity into a living dashboard of commit streaks, pull-request analytics, and goals that quietly update themselves. Sign in with GitHub and your last year appears as a contribution heatmap you can filter by repository and language, next to the streak you are protecting and the freeze you are saving for a holiday. Pull requests get the honest treatment: merge rate, average review time, and open-versus-closed breakdowns that show whether reviews or authors are the bottleneck. Weekly and monthly goals fill themselves in from live activity, while the consistency score and activity rings tell you whether your rhythm is steady or heroic but rare. When you want the story told back to you, an AI mentor who knows your history offers guidance, a résumé generator builds an ATS-friendly CV from merged pull requests for the role you name, and a weekly summary explains your own graphs in plain words. Opt into the public leaderboard to rank your streak, commits, and PRs against other developers, or keep everything private and share only the profile page and embeddable badges you choose. Running on a dedicated VPS on RepoCloud with guaranteed CPU, RAM, and SSD, full root SSH access, and a browser serial console. MIT licensed.
Hermes Studio
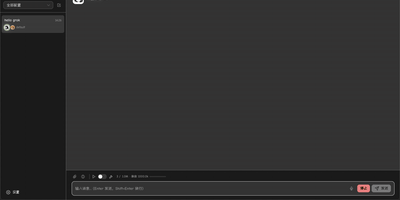
The most comprehensive open-source control plane for Hermes Agent — a full workspace combining AI chat, visual workflows, multi-agent orchestration, coding agent management, and platform channel integration in one self-hosted dashboard. Real-time chat streaming over Socket.IO connects to any OpenAI-compatible backend including Ollama, OpenAI, Anthropic, and custom endpoints with multi-session management, tool call expansion, inline file previews for HTML, PDF, DOCX, images, and source code, plus profile-scoped uploads and workspace attachments. The visual workflow builder provides a Vue Flow canvas for constructing DAG-structured pipelines with directed edges, conditional routes, approval gates, loops, and live execution with per-node status updates. Platform channel integration configures Telegram, Discord, Slack, WhatsApp, Matrix, Feishu, DingTalk, QQBot, WeChat, and WeCom bots from one page with credential management and per-platform behavior settings. Multi-agent group chat rooms enable real-time messaging with @mention routing, automatic context compression, and SQLite message persistence. The coding agent panel installs, launches, and monitors Claude Code and Codex with built-in terminal, session history, and file diffs. Usage analytics track token consumption, estimated costs, cache hit rates, and 30-day daily trends with model distribution charts. Kanban boards plan and track agent work alongside cron job scheduling for recurring tasks. Deploy via Docker, npm CLI, or desktop installer for Windows, macOS, and Linux. Running on a dedicated VPS on RepoCloud with guaranteed CPU, RAM, and SSD, full root SSH access, and a browser serial console. MIT licensed.
Ghostfolio
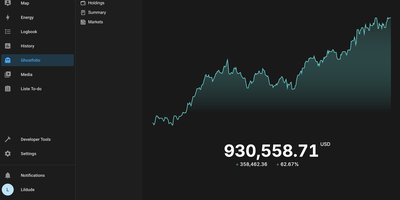
Stocks, ETFs, crypto, bonds, precious metals, and cash across every account and currency, in one privacy-first dashboard: Ghostfolio is open-source wealth management software. The deliberate design decision is no brokerage linking: positions enter by manual entry, CSV import, or the REST API, so your holdings never pass through a data aggregator. Performance is measured as return on average investment across Today, WTD, MTD, YTD, 1Y, 5Y, and Max timeframes, with benchmark comparison against indices like the S&P 500, dividend tracking, and allocation breakdowns by asset class, region, and sector. A static X-ray analysis flags concentration and other portfolio risks, and a FIRE calculator projects progress toward financial independence. Multi-currency support converts holdings using historical exchange rates, market data comes from Yahoo Finance and CoinGecko among other pluggable providers, and everything exports back out as CSV or JSON. Built with Angular and NestJS on PostgreSQL and Redis, shipped as Docker images for amd64 and ARM, with a mobile-first PWA interface, dark mode, and a distraction-free Zen mode. AGPL-licensed.
Briefer
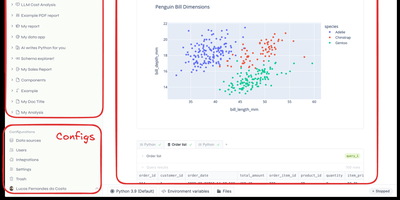
Backed by Y Combinator with 4,300 GitHub stars and growing rapidly since its September 2024 launch, Briefer delivers the first truly unified notebook-and-dashboard platform that eliminates the fragmented workflow of juggling Jupyter for analysis, Tableau for visualization, and Notion for documentation — combining all three in a single Notion-like workspace where SQL query results automatically become Python DataFrames accessible in subsequent code blocks. The built-in AI analyst understands your database schema and notebook context to generate SQL queries, write Python transformations, create visualizations, and fix errors on demand using configurable OpenAI or private LLM backends. Connect directly to PostgreSQL, MySQL, BigQuery, Redshift, Snowflake, and Amazon Athena as data sources, or upload CSV files for immediate analysis. Native point-and-click visualizations produce charts, tables, and dashboards without writing code, while interactive data apps use inputs, dropdowns, and date pickers to create parameterized reports for non-technical stakeholders. Scheduled execution runs notebooks and dashboards periodically with results delivered via Slack integration or public shareable links. Write-back queries modify production data directly from notebooks for ad-hoc pipeline testing. The architecture runs as three Docker containers — web frontend, API server, and optional AI service — backed by PostgreSQL and a Jupyter server for Python execution, deployable via single Docker command, Docker Compose, or Helm charts for Kubernetes. Running on a dedicated VPS on RepoCloud with guaranteed CPU, RAM, and SSD, full root SSH access, and a browser serial console. AGPLv3 licensed.
Nezha Monitoring
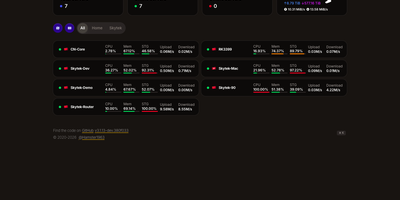
Keep every VPS, home-lab box, NAS, and router you run on one self-hosted dashboard, with a small agent on each machine reporting whether it is up and how hard it is working. Nezha tracks CPU, memory, swap, disk, load, traffic, process counts, and TCP and UDP connections on Linux, Windows, macOS, OpenWRT, and Synology machines, plus GPU and temperature where supported. Servers sort into groups and appear as cards, a list, or a world map, with live charts and, when the optional time-series database is on, 1, 7, and 30 days of history. HTTP GET, ICMP Ping, and TCPing monitors run from the servers you choose, chart latency and packet loss, and warn about HTTPS certificate changes and upcoming expiry. Alert rules watch offline servers, resource use, bandwidth, and cycle traffic limits, then message Telegram, Slack, Matrix, Feishu, DingTalk, or any webhook. A browser terminal and file manager handle quick fixes, while scheduled or alert-triggered tasks run backups, restarts, and scripts across many servers. DDNS updates Cloudflare, Tencent Cloud, or Hurricane Electric records when an agent's IP changes, and NAT traversal publishes a home router or NAS page on your own domain. Admin and user roles, scoped API tokens, and an optional MCP endpoint let people and AI tools list servers and run commands within their permissions. Running on a dedicated VPS on RepoCloud with guaranteed CPU, RAM, and SSD, full root SSH access, and a browser serial console. Apache-2.0 licensed.
ServerBee
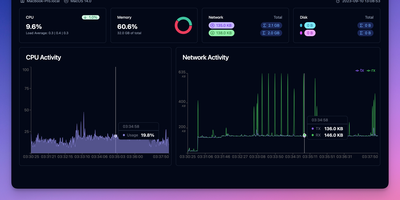
ServerBee delivers complete fleet monitoring from a single Rust binary that embeds both the server and web UI, requiring no external database or heavy runtime. Lightweight agents installed on each node stream CPU, memory, disk, network, load, temperature, GPU, and disk I/O metrics over persistent WebSocket connections to a central server backed by embedded SQLite. The real-time React dashboard presents 17 drag-and-drop widget types across custom layouts, with historical charts spanning one hour to 30 days and monthly traffic statistics with billing-cycle prediction and cost insights including burn rate and per-resource unit cost scoring. Network monitoring covers ICMP, TCP, and HTTP ping probes, service monitors for SSL certificates, DNS records, HTTP keyword matching, TCP ports, and WHOIS expiration, plus network-quality probing across 96 China 3-ISP and international presets with IP-quality and streaming-unlock detection. Remote management features include a web terminal with sandboxed file manager, Docker container stats with logs and events, firewall configuration, and agent auto-update capabilities. Public status pages display 90-day uptime timelines, while alerting supports email and webhook notifications with flexible trigger expressions. A native iOS companion app provides mobile monitoring access. Deploy via Docker or download the single binary for Linux, macOS, or Windows, running on a dedicated VPS on RepoCloud with guaranteed CPU, RAM, and SSD, full root SSH access, and a browser serial console. AGPL-3.0 licensed.

SQLPage
If you can write a SELECT statement, you can publish a working web app with SQLPage, where each query's results appear on the page as tables, charts, maps, or forms. A .sql file is a page. Name a component in the first row, and the rows after it become lists, cards, data grids, timelines, or step trackers. Tables offer searching, sorting, frozen headers, and per-row edit and delete buttons. Charts cover line, area, bar, pie, scatter, bubble, and heatmap views with a one-click CSV export. Forms feed INSERT and UPDATE statements directly, with validation and file uploads. A complete CRUD tool takes a handful of queries. The map component plots markers and GeoJSON shapes, and the JSON component lets the same data serve other systems as an API. Protect private pages with password logins or single sign-on through Google, Microsoft, or your own identity provider. Connect to SQLite, PostgreSQL, MySQL, SQL Server, or ODBC sources such as DuckDB, Oracle, Snowflake, and BigQuery. Tabs, modals, alerts, breadcrumbs, and carousels shape multi-page sites, and custom templates, CSS, and JavaScript fill any gap. Running on a dedicated VPS on RepoCloud with guaranteed CPU, RAM, and SSD, full root SSH access, and a browser serial console. MIT licensed.
ILLA Builder
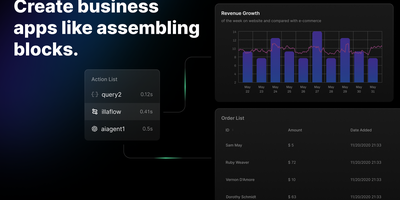
ILLA Builder turns internal tool development from weeks of custom frontend work into hours of drag-and-drop assembly, combining a visual canvas of 60+ UI components with direct connections to over 20 data sources. The TypeScript frontend, powered by ILLA Design, offers data grids backed by MUI X Data Grid Premium, charts, forms, rich-text editors, PDF viewers, QR code scanners, calendar widgets, map embeds, and video players. Each component supports Handlebars-style expression bindings that reference query results, widget state, or global variables, while the reactive execution tree resolves dependencies in topological order and re-evaluates downstream properties whenever upstream values change. Data connectors provide GUI-driven access to PostgreSQL, MySQL, MongoDB, MSSQL, Supabase, Redis, Firebase, CouchDB, Airtable, Google Sheets, Stripe, AWS S3, Hugging Face models, and REST or GraphQL endpoints without writing connector code. Real-time collaboration through WebSocket lets multiple developers edit the same application simultaneously with live cursor tracking and synchronized Redux state. ILLA Flow adds workflow automation triggered by schedules or webhooks, chaining actions across data sources. The Go backend handles application state, resources, and attribute-based access control using PostgreSQL for persistence, Redis for caching, MinIO for file storage, and Envoy for API ingress. Deploys as a single Docker container on port 2022 or scales horizontally on Kubernetes. Running on a dedicated VPS on RepoCloud with guaranteed CPU, RAM, and SSD, full root SSH access, and a browser serial console. Apache 2.0 licensed.
Lodestone
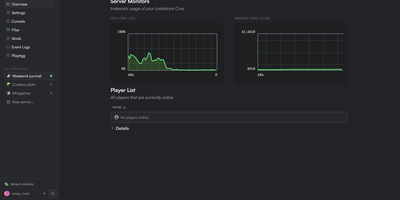
Lodestone Host is a free, open source Minecraft server manager that lets you create, mod, monitor, and share servers from a browser dashboard instead of juggling terminals and config files. A guided wizard builds Vanilla, Fabric, Forge, NeoForge, or Paper servers, or starts from a Fabric modpack found through Modrinth search, a pasted link, or an uploaded .mrpack file, and it downloads the right Java for every server. The instance page shows live CPU and memory charts and the player list, with a searchable console that accepts commands and a file manager that edits configs in the browser. Mods and plugins install straight from Modrinth, filtered to the instance's version and loader, with badges for what is already installed and what players need on their own client too. Lodestone Connect invite links bring friends in without port forwarding, and the companion launcher installs the right mods before joining; optional playit.gg tunnels offer another route in. Give helpers their own accounts with permission to create or delete servers and to view, start, stop, or open the console of chosen ones, then hand scripts and bots scoped, expiring API keys or the JSON-friendly CLI. Survival worlds, creative plots, and minigame servers can all run on hardware you control, sized to your players and not to a hosting provider's RAM tiers. Running on a dedicated VPS on RepoCloud with guaranteed CPU, RAM, and SSD, full root SSH access, and a browser serial console. AGPL-3.0 licensed.
OpenSearch Dashboards
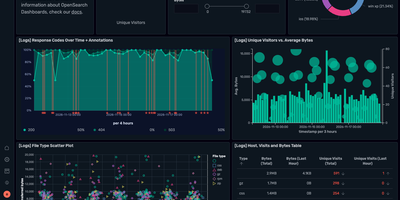
Point OpenSearch Dashboards at an OpenSearch cluster and the documents inside become searchable tables, charts, maps, and dashboards in a browser, with no API requests to write. Discover shows a histogram of documents over time. A field list sits beside expandable results. DQL or Lucene query strings narrow them, and the rows export as CSV. Visualize builds area, bar, line, pie, heat map, gauge, tag cloud, and map charts in a point-and-click editor. TSVB, Timeline, and Vega cover advanced cases. Dashboards combine those panels with input controls, a time picker, and a query bar that filters every panel at once. Sample data brings ready-made logs, flights, and eCommerce dashboards. Query Workbench runs SQL and PPL. Dev Tools sends Query DSL requests. Index Management lists indexes with health, size, and document counts. Reporting exports dashboards and visualizations as PDF, PNG, CSV, or XLSX, once or on a schedule. Observability apps explore logs, traces, and metrics. Alerting monitors and Anomaly Detection flag problems, and Notifications channels reach Slack, email, and webhooks. Data sources connect other OpenSearch clusters, Amazon S3, or Prometheus. Dashboards Management holds index patterns, saved objects, and advanced settings. Security Analytics adds threat alerts, findings, and correlations. Running on a dedicated VPS on RepoCloud with guaranteed CPU, RAM, and SSD, full root SSH access, and a browser serial console. Apache-2.0 licensed.
Rath
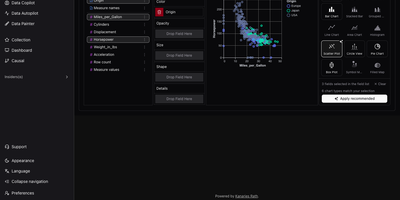
RATH, an automated data exploration workbench, turns any table into a gallery of charts worth reading, without building each chart by hand. Start with a CSV, JSON, or Excel file, or pull tables from MySQL, PostgreSQL, Oracle, SQL Server, SQLite, or Airtable. Eight built-in demo datasets are ready to try. Next comes a profile: every field gets a distribution chart and summary statistics. A metadata view retags fields as dimensions or measures. Data Autopilot then searches the dataset and pages through generated insight charts. Charts can be starred, exported, or opened in the editor. Starting from a single field, Data Copilot lists associated patterns to follow, with controls to add variables, filters, and computations. For hands-on work, the drag-and-drop chart builder offers fifteen chart types, including heat maps, box plots, and maps, plus a button that applies the recommended chart. With Data Painter, you brush points into up to ten labeled color groups or erase anomalies, then search for a chart that explains the painting. Causal analysis runs one of ten discovery algorithms, including PC, FCI, GES, and GRaSP. It then draws a directed graph with influence percentages, plus charts and statistics for any field you select. Dashboards combine titles, text, and charts in movable, resizable cards with four themes and global filters. Running on a dedicated VPS on RepoCloud with guaranteed CPU, RAM, and SSD, full root SSH access, and a browser serial console. AGPL-3.0 licensed.
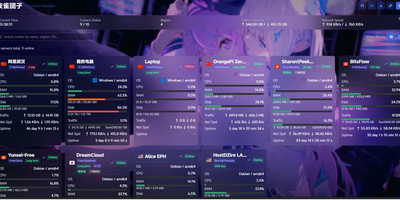
Komari
Komari turns a scattered fleet of VPS boxes into one clean status wall that shows which servers are alive, struggling, or about to expire. Every node reports CPU, GPU, memory, swap, disk, load, network speed, traffic totals, and uptime to a real-time dashboard, with history views from ten minutes to thirty days or any custom range. Flip between a card grid and a table, search by name, region, or operating system, and tag each machine with its price, billing cycle, and days until renewal. Latency tasks send ICMP, TCP, or HTTP probes and plot the results in per-node charts. Offline alerts wait out a per-node grace period before firing, expiry reminders warn before a plan lapses, and Webhook and custom JavaScript channels deliver them. A multi-tab browser terminal that reattaches after disconnects, remote command execution, and a remote file manager with an editor let you fix problems without leaving the panel. Agents install with a script, a binary, Docker, or an auto-discovery key for batch rollouts, and administrators can switch an agent's version remotely. Plugins run on an embedded JavaScript runtime and can add scheduled jobs, HTTP hooks, static pages, and notification channels. Administrators can add two-factor authentication, OAuth sign-in, API keys for a JSON-RPC 2.0 endpoint, themes from a theme market, and backups. Running on a dedicated VPS on RepoCloud with guaranteed CPU, RAM, and SSD, full root SSH access, and a browser serial console. MIT licensed.