Overlook
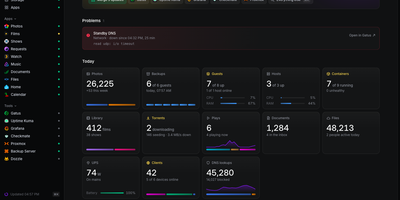
Overlook is a read-only status page that tells you at a glance whether your whole homelab is healthy, by pulling live answers from the monitoring, server, network, storage, and media tools you already run. The page leads with what is wrong, listing the checks your existing check engine is alerting on for as long as they fail, so the page and your alerts never disagree. Below that sit Servers, Network, Storage, and Apps, each marked up, degraded, or down with the last 30 results of its checks and its own detail page showing guests, DNS clients, or disk detail. A Today strip gives one figure from every source, such as guests running, DNS lookups, photos added, or the watts your UPS is drawing, while a weekly view lists each area's problems and events across the last seven days. Your apps appear as links with a dot that says whether each one answers, and chores due this week, waiting updates, batteries to change, and requests awaiting approval collect in one place you act on in the tool itself. A browser setup page appears before any config exists, tests each source you enter, and writes the config and secrets files for you. Running on a dedicated VPS on RepoCloud with guaranteed CPU, RAM, and SSD, full root SSH access, and a browser serial console. MIT licensed.
Dashwise
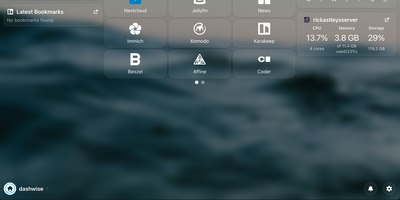
Your homelab grew one service at a time until opening the right one became a memory test, and Dashwise is the dashboard that puts them all in one place. Arrange movable widgets and one-line glanceables around the clock, group links into groups and folders, and build separate pages for the views you actually use. Every piece is configured through the interface itself, so shaping your dashboard never means editing config files by hand. Hit Ctrl+K and the spotlight search jumps you to any link or integration, or fires a search engine bang when the answer lives outside the lab. Subscribe to RSS feeds on the news page to keep up without leaving the dashboard. Other services can push notifications straight into Dashwise, so alerts from your stack land beside the links that fix them. Integrations defined as simple files add widgets, glanceables, and shortcuts for your favorite self-hosted apps, and new ones can be created without touching the core. Accounts are built in, with OIDC single sign-on for households or teams who already run an identity provider. Running on a dedicated VPS on RepoCloud with guaranteed CPU, RAM, and SSD, full root SSH access, and a browser serial console. GPL-3.0 licensed.
Compass
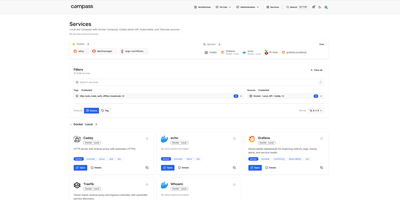
Every homelab outgrows the browser bookmark folder, and Compass answers by building the front page for you, discovering your services automatically instead of asking you to maintain cards by hand. Point it at Docker, Kubernetes, Tailscale, Headscale, NetBird, DNS records, a JSON API, or a plain static list, and it renders everything it finds as a searchable directory with icons, descriptions, and tags filled in from a catalog when a source leaves them blank. Each card shows whether the service is actually up, using the Prometheus or Gatus monitor you already run, and pinned and recent services keep daily tools one click away. Opening a service reveals its connection details, source metadata, extra links such as runbooks and health endpoints, and panels you embed from Grafana. Markdown pages live beside the directory, so architecture notes and on-call runbooks sit in the same navigation, with live service cards and charts embedded directly inside the prose. A debug view shows per-source health, what each source returned, and why a service you expected is missing, while group-based access decides which sources each person can see. Running on a dedicated VPS on RepoCloud with guaranteed CPU, RAM, and SSD, full root SSH access, and a browser serial console. Apache License 2.0 licensed.