Milvus
With over 45,000 GitHub stars and 100 million Docker pulls, Milvus is the most widely adopted open-source vector database, powering production AI systems at NVIDIA, Salesforce, eBay, Airbnb, and DoorDash. The distributed architecture separates compute and storage with stateless microservices on Kubernetes, horizontally scaling query nodes for read-heavy workloads and data nodes for write-heavy ingestion independently. Milvus 3.0 introduces lake-native retrieval that builds and serves indexes directly over vector data in object storage and open formats including Parquet, Lance, Iceberg, and Vortex without maintaining separate copies. Native hybrid search unifies lexical BM25 full-text retrieval and semantic vector search in a single engine with metadata filtering, eliminating the need for separate search infrastructure. Hardware-accelerated ANN indexing supports IVF, HNSW, DiskANN, and GPU-based indexes with BitQ 1-bit quantization cutting memory usage by 72 percent. SDKs for Python, Go, Node.js, and Java provide programmatic access, while Milvus Lite offers lightweight embedding for local development via pip install. Server-side aggregation, sorting, faceted search, StructArray for nested document structures, and ColBERT multi-vector scoring move ranking and result processing into the engine. The Path Index enables 100x faster JSON filtering with support for 100,000+ collections per cluster for multi-tenant deployments. Self-hosting deploys via Docker Standalone or Kubernetes with Helm charts using S3-compatible, GCS, or Azure Blob storage backends. Running on a dedicated VPS on RepoCloud with guaranteed CPU, RAM, and SSD, full root SSH access, and a browser serial console. Apache 2.0 licensed.
Pulse
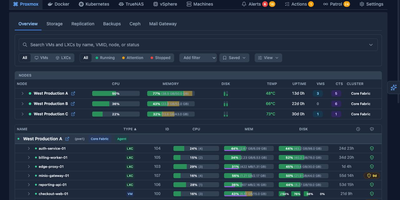
Pulse monitors your entire heterogeneous infrastructure from one screen: Proxmox VE, Proxmox Backup Server, Proxmox Mail Gateway, Docker, Podman, Docker Swarm, Kubernetes, TrueNAS SCALE/CORE, VMware vSphere, and standalone Linux/Windows/macOS machines. The Go binary embeds a SolidJS/TypeScript frontend, delivering WebSocket-driven dashboards with sub-second metric updates on port 7655. A unified agent auto-detects Docker, Podman, Kubernetes, and Proxmox on each host without manual configuration and self-updates silently, while Proxmox nodes need only API credentials with zero agent installation. Smart alerts use adaptive hysteresis-based thresholds to prevent notification floods, pushing to Discord, Slack, Telegram, Teams, email, ntfy.sh, Gotify, and generic webhooks with per-resource overrides. The standout feature is Pulse Patrol: scheduled AI health checks running every ten minutes to seven days using OpenAI, Anthropic, Gemini, or local Ollama models. Patrol catches silent backup failures, capacity creep, restart loops, unhealthy containers, and clock drift that dashboards miss when nobody is watching. Platform-specific views render Proxmox nodes, Ceph clusters, Docker Compose projects, Kubernetes workloads, TrueNAS pools, and vSphere VMs in familiar layouts. OIDC, SSO, and SAML authentication with credential encryption at rest secures access. 6,500+ stars and 441 releases since February 2025. Running on a dedicated VPS on RepoCloud with guaranteed CPU, RAM, and SSD, full root SSH access, and a browser serial console. MIT licensed.
Spinifex
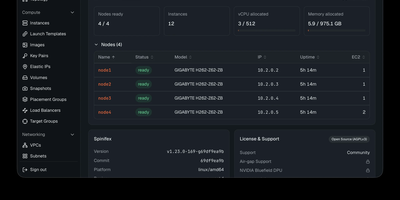
Spinifex rebuilds the AWS services your applications already call (EC2, EBS, S3, VPC, and IAM) on hardware you control, so workloads can leave the hyperscalers without a rewrite. An EC2 call boots a real KVM guest with spot instance and GPU passthrough options, attaches replicated block volumes, and places the machine inside an OVN virtual network guarded by security groups. S3 buckets land in erasure-coded object storage, container images live in a deduplicated registry, and managed Kubernetes clusters arrive with highly available control planes and node groups. Relational databases run as managed PostgreSQL or MariaDB with automated backups, load balancers terminate traffic at layer 4 or layer 7 with ACM certificates, and an authoritative DNS service manages hosted zones. Every request is authenticated with SigV4 at the gateway and routed to stateless service daemons, so capacity grows by starting more daemons on more nodes. Your existing AWS CLI profiles, SDK code, and Terraform plans point at the new endpoint and keep working, because 405 AWS API operations answer with the shapes your tooling expects. A built-in web console covers instances, volumes, buckets, networks, and IAM for operators who prefer clicks to commands. Clusters run on-premise, at air-gapped edge sites, or on GPU cloud capacity, and keep serving through disconnection because no external control plane exists. Running on a dedicated VPS on RepoCloud with guaranteed CPU, RAM, and SSD, full root SSH access, and a browser serial console. AGPL-3.0 licensed.
ToolHive
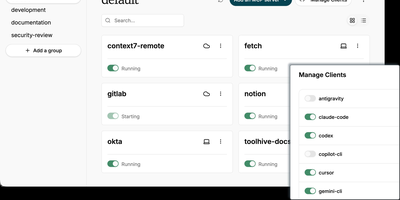
ToolHive is an open-source MCP server management platform that lets you run, secure, and orchestrate Model Context Protocol servers in isolated containers, giving AI agents structured access to tools like GitHub, databases, and cloud services without exposing host credentials or network. Every server launches inside its own sandboxed container with a minimal permission file, network access filtering, and encrypted secrets management, preventing misbehaving connectors from reaching beyond their defined scope. The built-in registry provides a catalog of vetted servers you can install with one command, while custom images and package-manager references let you onboard proprietary connectors without writing Dockerfiles. Platform teams deploy the Kubernetes operator to declare MCP servers as cluster resources using Custom Resource Definitions, with automated lifecycle management and multi-namespace isolation. The Virtual MCP Server gateway aggregates multiple backends behind a single endpoint, centralizing OIDC authentication, tool filtering, and composite cross-server workflows so clients connect once instead of juggling separate URLs. An MCP Optimizer analyzes tool schemas via semantic search and surfaces only relevant tools per request, cutting token consumption by up to 85%. OpenTelemetry traces and Prometheus metrics deliver full visibility into tool execution, latency, and request audit trails across every managed server. Running on a dedicated VPS on RepoCloud with guaranteed CPU, RAM, and SSD, full root SSH access, and a browser serial console. Apache 2.0 licensed.
Cupdate
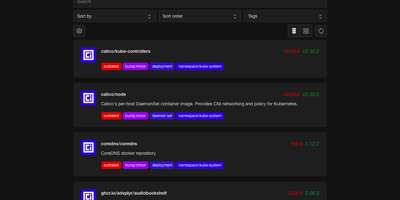
Cupdate keeps a watchful eye on every container image you run, reporting which ones are outdated or vulnerable while deliberately never touching the update button itself. Point it at a Kubernetes cluster, a Docker socket, or Podman hosts (local or remote, one or several) and it inventories every image in use with no configuration to write. Each image is matched against its registry to find the newest available version, and the dashboard shows the gap between what you deployed and what you could be running, with release notes inline so the decision to upgrade takes seconds instead of a changelog hunt. Vulnerability data is layered on top from four sources: Docker Scout for Docker Hub images, Clair for participating Quay images, GitHub Advisories for images tied to repositories, and osv.dev correlation for images shipping SBOMs. A dependency graph explains why each image exists in your stack by showing which workloads pull it, which ends the "can I delete this?" guessing game. Subscribe to the RSS feed to hear about new releases passively, query the REST API to drive scripts that update compose files or kustomizations, or surface outdated and vulnerable counts in a Homepage dashboard widget. Prometheus metrics and traces are available when you want the watcher itself watched. Running on a dedicated VPS on RepoCloud with guaranteed CPU, RAM, and SSD, full root SSH access, and a browser serial console. MIT licensed.
Apache SkyWalking
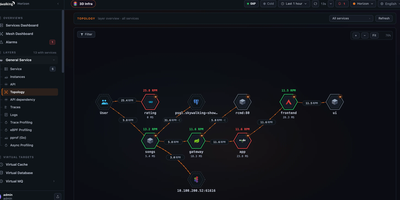
An open-source application performance monitoring platform for microservices, Kubernetes, and service meshes, Apache SkyWalking draws the live service map and ties slow requests to their traces, logs, and metrics. Agents cover Java, .NET Core, PHP, Node.js, Go, Lua, Rust, C++, browser JavaScript, and Python, and OpenTelemetry, Zipkin, Prometheus, Zabbix, and Telegraf data can be ingested too. Start at the service topology map, follow a request through the trace waterfall, then drill into the instance and its API dependencies. When the cause is inside the code, trace profiling, async-profiler, Go pprof, eBPF, and network profiling render flame graphs and process graphs in the same console. The Rover eBPF agent profiles Kubernetes workloads for CPU and network problems, and Istio and Envoy service meshes, including Istio Ambient, report into the same dashboards. Alarm rules target a service, deployment, or API, and alarms and telemetry can be forwarded to third-party systems. Metric and log analysis rules hot-update at runtime without a restart, and a live debugger shows what each rule stage receives and produces. An AI assistant answers plain-language questions with charts, topology, and traces from live data, using an OpenAI-compatible or Amazon Bedrock model you configure, and an MCP connection serves your own AI client. Running on a dedicated VPS on RepoCloud with guaranteed CPU, RAM, and SSD, full root SSH access, and a browser serial console. Apache-2.0 licensed.
Cozystack
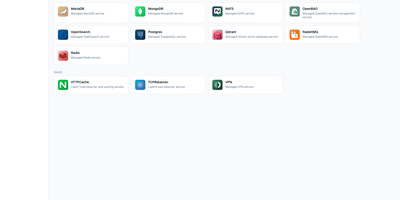
A rack of ordinary servers becomes your own cloud, with tenants ordering real infrastructure from a catalogue instead of filing tickets. Cozystack is an open-source, Kubernetes-based cloud platform that turns bare metal into a self-service system for spawning Kubernetes clusters, databases, virtual machines, load balancers, object storage, and HTTP caching services through a standard REST API. Hosting providers use it to sell managed services on hardware they already own, platform teams use it to give developers isolated environments inside quotas, and organizations leaving VMware run virtual machines and containers side by side with live migration and replicated storage. Tenants stay separated, GPU capacity can be shared between groups, and every service instance ships with preconfigured monitoring dashboards and alerts, gathered per tenant or into one hub. Because services are requested as Kubernetes resources, a billing system integrates by submitting a manifest, and platform packages are plain YAML delivered by FluxCD, so extending the catalogue means editing files your team already understands. Installation bootstraps immutable nodes over PXE or ISO, and the built-in web dashboard deploys applications and shows what the platform is doing without hiding the API underneath. The whole control plane runs on your hardware, auditable end to end. Running on a dedicated VPS on RepoCloud with guaranteed CPU, RAM, and SSD, full root SSH access, and a browser serial console. Apache-2.0 licensed.
Coroot
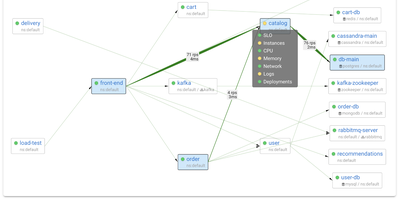
Coroot uses eBPF to capture metrics, distributed traces, logs, and continuous CPU profiles directly from the Linux kernel, delivering full observability without any application code changes, SDKs, or sidecars. From the first minute of deployment, an automatically generated service map covers every microservice, database, message queue, and external dependency with request rate, error rate, and latency measurements. When a service breaches its SLO, AI-powered inspections analyze telemetry across all dimensions to pinpoint the root cause and send a single consolidated alert with findings, replacing the flood of fragmented notifications typical of traditional monitoring. Deployment tracking automatically discovers Kubernetes rollouts and compares each release against the previous one to detect performance regressions, resource spikes, and cost impacts without CI/CD pipeline integration. Continuous profiling captures CPU flame graphs down to the line of code with negligible overhead. Integrated cost monitoring tracks cloud spending across AWS, GCP, and Azure, attributing expenses to individual services and deployments. Coroot supports Prometheus, OpenTelemetry, and ClickHouse as data sources and works identically on Kubernetes clusters, virtual machines, and bare-metal hosts. 7,700+ GitHub stars. Apache-2.0 licensed.
Argo CD
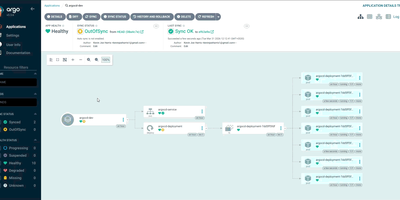
A CNCF Graduated project with over 23,700 GitHub stars and adoption by organizations including Intuit, Adobe, Capital One, and Red Hat, Argo CD has become the industry standard for GitOps-based Kubernetes deployments since its creation at Intuit in 2018, treating Git repositories as the single source of truth for application configurations and automatically reconciling live cluster state with declared desired state. The platform supports Helm charts including Helm 4, Kustomize overlays, Jsonnet, and plain Kubernetes YAML manifests, rendering templates and applying resources through configurable sync policies with automated or manual reconciliation, pruning of orphaned resources, and self-healing that reverts unauthorized cluster changes. ApplicationSets enable templated generation of applications across multiple clusters, environments, and Git repositories using generators for pull requests, Git directories, cluster lists, and merge strategies. The web UI provides a real-time application topology view with resource health status, sync state indicators, log streaming, and a network view supporting Gateway API and Ingress visualization. Version 3.5 introduced mTLS for internal component communication, graduated user impersonation and source hydrator to beta, added native ApplicationSet management with preview applications in the UI, and delivered source integrity validation. Multi-cluster management deploys applications across development, staging, and production environments from a single Argo CD instance with RBAC, SSO via OIDC and SAML, and audit logging. Running on a dedicated VPS on RepoCloud with guaranteed CPU, RAM, and SSD, full root SSH access, and a browser serial console. Apache 2.0 licensed.
Headlamp
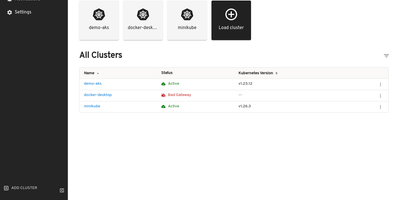
The Kubernetes project's own answer to cluster management UIs: maintained under SIG UI governance, Headlamp's roadmap tracks Kubernetes releases and its design philosophy reflects community needs rather than a vendor's product strategy. The React interface provides full read-write capabilities adapted to each user's RBAC permissions — delete, scale, edit, and restart buttons appear only when the authenticated user holds the corresponding cluster role, preventing accidental unauthorized actions. Multi-cluster support surfaces workloads across development, staging, and production from a single view without context switching. The plugin architecture drives extensibility through a curated catalog: an AI Assistant plugin answers natural-language cluster queries and performs operations via configurable LLM keys, Flux handles GitOps, Karpenter manages nodes. Integrated terminals provide browser-based exec access to running pods, live log streaming follows container output with filtering, and the YAML editor displays inline Kubernetes API documentation alongside resource definitions. Deployment creation forms let you configure containers, environment variables, volumes, and replicas without writing manifests. Side-by-side cluster comparison views surface differences in workload distribution. Works with any distribution: EKS, GKE, AKS, Minikube, Docker Desktop. Helm chart installation via the Headlamp repository with images on GitHub Container Registry. Running on a dedicated VPS on RepoCloud with guaranteed CPU, RAM, and SSD, full root SSH access, and a browser serial console. Apache-2.0 licensed.
Telescope
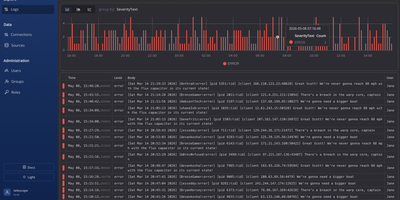
Four log stores should not mean four tools open during an outage, and Telescope is a web log viewer that explores ClickHouse, StarRocks, Docker, and Kubernetes logs in one place. Connect multiple sources, decide which fields each one exposes, mark fields as suggested or hidden, and enable autocompletion so everyday lookups start with structured filters rather than query syntax. When filters are not enough, drop into raw SQL with full WHERE expressions, choose the columns and formatting you want, and narrow results with a time selector that understands relative ranges. Group logs by any field, including nested JSON, map, and array values, and read the interactive chart to spot spikes and anomalies without hand-writing aggregation queries. Save the filter combinations your team reaches for during incidents, share those views, and jump straight to the logs that matter next time. Control who sees what with per-source user and group permissions, GitHub authentication with organization checks, and role-based access for querying. Collapse the sidebar into focus mode when the screen should belong to log lines alone, whether you are chasing container output locally or production records at scale. Running on a dedicated VPS on RepoCloud with guaranteed CPU, RAM, and SSD, full root SSH access, and a browser serial console. MIT licensed.
Tunnet
One encrypted network for every machine you run: Tunnet links laptops, home servers, cloud instances, and CI runners into a private mesh that behaves like a single LAN. Each enrolled machine gets an overlay IP and a hostname, so ordinary tools like ping, curl, SSH, and the browser just work across home servers, cloud instances, and laptops. Publish an internal app to your peers with Serve, or expose a local service to the public internet with an HTTPS tunnel when you need a shareable link. Send files directly between machines without detouring through cloud drives, email attachments, or fragile copy commands. SSH access follows identity instead of scattered key files, with session recording and no bastion host to maintain. Device posture checks gate which machines may join, and subnet routes, exit nodes, and high-availability gateways extend the fabric to whole networks. Write your ACLs, groups, tags, and SSH rules as Policy as Code in Git, simulate changes offline, review semantic diffs on pull requests, and roll back revisions when a change misbehaves. The Kubernetes operator advertises cluster networks, publishes services to peers, and exposes public HTTPS endpoints through custom resources. Run the full stack yourself, control plane, dashboard, management API, relays, and audit logs included, or skip the server entirely with Direct mode for a zero-server peer-to-peer mesh. Running on a dedicated VPS on RepoCloud with guaranteed CPU, RAM, and SSD, full root SSH access, and a browser serial console. AGPL-3.0 and MPL-2.0 licensed.
Kubewall
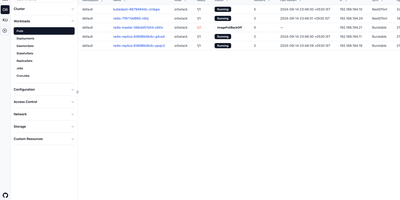
One binary is all that stands between you and every Kubernetes cluster you own: Kubewall opens a realtime web dashboard over all of them, with no agents to install and nothing phoning home. Switch between clusters from the sidebar and browse workloads, networking, storage, configuration, and access control in tables that update live as pods start, fail, and reschedule. Open any resource to inspect its overview, edit its manifest in the built-in YAML editor with validation, watch its events, or stream logs aggregated across pods and containers with search and tail controls. A command palette jumps straight to any resource type, while faceted filters and global search cut through thousands of objects by name, namespace, label, or image. Scale deployments, restart pods, trigger rollout restarts, and apply manifests with a click, or forward a cluster service to your local machine without memorising kubectl incantations. An integrated AI assistant, connected to OpenAI, Claude, Gemini, DeepSeek, OpenRouter, Ollama, or a local model, helps troubleshoot failures and review configurations right beside the resource it concerns. Running on a dedicated VPS on RepoCloud with guaranteed CPU, RAM, and SSD, full root SSH access, and a browser serial console. Apache-2.0 licensed.
QuickStack
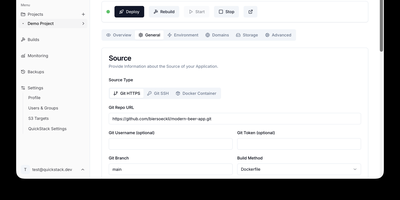
QuickStack transforms your standalone Linux server or cluster into a self-hosted platform-as-a-service that automatically compiles, deploys, and monitors full-stack applications and relational databases without vendor lock-in. Developers can trigger instant deployments directly from public or private Git repositories, upload custom Dockerfiles, or pull container images straight from private registries with automated webhook synchronization. The built-in application catalog enables one-click provisioning of production databases including PostgreSQL, MySQL, MariaDB, MongoDB, and Redis with preconfigured internal network isolation. Administrators can route traffic across custom domains with automated Let's Encrypt SSL certificate issuance, inspect real-time CPU and memory telemetry, stream container runtime logs, and launch in-browser web terminals. Teams can configure granular role-based access controls with single sign-on authentication, establish zero-trust ingress and egress network security policies, and orchestrate automated volume snapshots directly to S3 object storage. When infrastructure requirements expand, operators can attach additional worker nodes using lightweight join tokens to distribute workloads seamlessly across high-availability compute pools. Running on a dedicated VPS on RepoCloud with guaranteed CPU, RAM, and SSD, full root SSH access, and a browser serial console. GNU GPL v3.0 licensed.
Nuclio
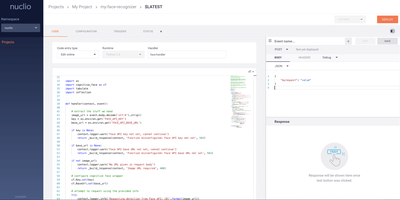
Serverless platforms promise to run your code only when it is needed; Nuclio adds the part they usually skip, raw throughput for data-heavy work, with a single function instance able to process hundreds of thousands of HTTP requests or records per second. You write functions in Python, Go, Node.js, Java, .NET, or plain Shell, and deploy them from the dashboard on port 8070, from the nuctl command line, or from Jupyter through the Nuclio SDK. Events reach your code through HTTP calls, cron schedules, Kafka and Kinesis streams, MQTT and NATS messages, RabbitMQ queues, or Azure Event Hubs, so the same function model covers APIs, stream processors, and scheduled jobs. Each function ships as its own container, built securely with Kaniko, and scales on plain Docker for a single server or on Kubernetes when the workload outgrows one machine, with GPU support for inference and media pipelines. Projects organise functions with shared configuration, secrets, and API gateways, and the dashboard shows invocations, logs, and metrics while templates for common jobs get a first function running in minutes. Data science teams plug Nuclio into MLRun and Kubeflow Pipelines to serve models and automate ML workflows without a separate serving tier. Running on a dedicated VPS on RepoCloud with guaranteed CPU, RAM, and SSD, full root SSH access, and a browser serial console. Apache-2.0 licensed.
Terrapod
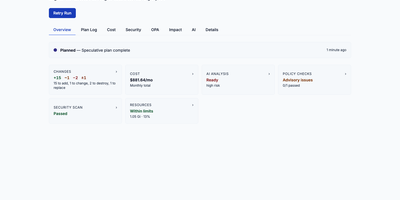
Terrapod gives you the Terraform Enterprise control plane on your own Kubernetes cluster, with remote state, run approvals, and policy checks, and no per-resource bill at the end of the month. Point your existing cloud block at it and terraform or tofu keep working unchanged, because Terrapod answers the same backend protocol the CLI already speaks. Workspaces isolate state, variables, and runs per team or environment, with versioned state you can lock, inspect, and roll back. Server-side agent pools execute plans and applies on ephemeral Kubernetes jobs, while CLI-driven runs stay available for local workflows. Approvals gate every apply, and conditional auto-apply only proceeds when a plan adds or updates resources without destroying anything. Label-based RBAC decides who may read, plan, write, or administer each workspace, with OIDC and SAML single sign-on on top. A private registry hosts your own modules and providers with GPG signing, and OPA Rego policy sets enforce rules as mandatory or advisory checks before apply. Drift detection flags infrastructure that wandered from its state, run triggers chain dependent workspaces, and an interactive impact graph shows a plan's blast radius before you approve it. Optional AI review summarizes each plan's changes and risks, and an MCP server lets AI assistants inspect workspaces and runs under the same permissions. Running on a dedicated VPS on RepoCloud with guaranteed CPU, RAM, and SSD, full root SSH access, and a browser serial console. MPL-2.0 licensed.
AliangBoard
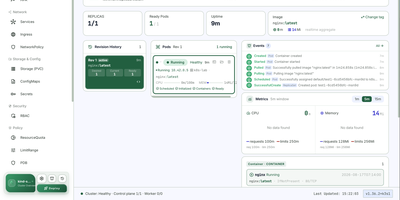
AliangBoard puts every Kubernetes cluster you run behind one web panel, where you manage resources yourself or ask an AI agent to do it with your approval. Connect each cluster with a bearer token or basic auth and the panel persists the connection, so switching clusters, namespaces, and workloads takes one click instead of another kubeconfig. More than thirty resource types stay in sync: create workloads, services, ingress, config, storage, and RBAC through structured forms, edit anything as YAML, apply multi-document manifests at once, and delete optimistically with automatic rollback when the API refuses. Pod work goes deep: a tmux-backed exec terminal survives browser refreshes, port-forwards resolve services to their backend pods, files move up and down with progress, and debug containers inject into running pods without restarting them. Day-two operations are buttons, not flag memorization: scale, rolling restart, rollout undo, manual CronJob triggers, and node cordon or drain. Global search, a layered namespace topology, live event streams, and CPU and memory metrics keep orientation effortless. Then there is the operator: an Agent workbench and MCP server let your LLM read logs, debug containers, and propose changes in natural language, while every write waits for a human click and lands in an audit log that names who did what. Running on a dedicated VPS on RepoCloud with guaranteed CPU, RAM, and SSD, full root SSH access, and a browser serial console. Apache-2.0 licensed.
dyrector.io
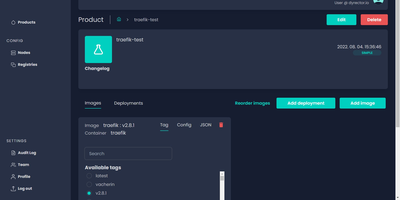
dyrector.io gives teams a visual web interface for deploying and managing containerized applications across Docker, Kubernetes, and Podman environments, replacing repetitive CLI commands and YAML editing with point-and-click configuration. Lightweight Go agents installed on target infrastructure communicate with the central TypeScript platform, enabling deployments to AWS, GCP, Azure, and on-premises servers without requiring infrastructure migration. Unified configuration screens eliminate redundant YAML editing across environments with support for all three container runtimes. Version management lets teams configure OCI-compatible container images once and deploy them as versioned releases with auto-generated changelogs and release notes. Multi-instance deployment enables simultaneous rollouts to multiple nodes with environment-specific configuration overrides, secret management, and instant test environment provisioning from any branch. The fine-grained RBAC system controls user access at project and environment levels, while audit logging tracks every deployment action. Registry integrations support Docker Hub, GitLab, GitHub, Google, and Azure container registries for image sourcing. ChatOps notifications integrate with Slack, Discord, and Microsoft Teams for deployment status alerts. Scheduled releases and workflow support enable automated deployment pipelines triggered by CI events via the REST API with JWT authentication. Running on a dedicated VPS on RepoCloud with guaranteed CPU, RAM, and SSD, full root SSH access, and a browser serial console. Apache 2.0 licensed.