D-Tale
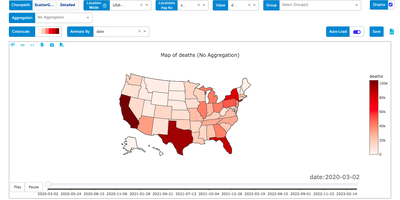
If your data lives in a pandas DataFrame, D-Tale gives it a spreadsheet-style grid, a column profiler, and a chart builder in the browser, started with one call from a notebook or script. In the grid you sort, filter, and edit cells inline, lock, hide, reorder, rename, or reformat columns from their menus, and open a Describe view with each column's distribution, summary statistics, outliers, and missing values, while highlight modes color dtypes, outliers, and numeric ranges across the whole table. Correlation matrices, a predictive power score, and duplicate reports sit beside dataframe functions that add numeric, binned, date, random, and type-converted columns, and Merge & Stack combines dataframes, including ones uploaded from Excel files. The chart builder draws line, bar, stacked, pie, wordcloud, heatmap, 3D scatter, surface, and map charts with grouping and aggregation, exports them as standalone HTML, and a network viewer graphs relationships between nodes. Whatever you build in the interface can be exported as reproducible Python code, and data can be saved as CSV or TSV. Launch it from Jupyter, Google Colab, Kaggle, a terminal, or the command line with a CSV path, protect it with optional authentication, and choose light or dark themes and English or Chinese. Running on a dedicated VPS on RepoCloud with guaranteed CPU, RAM, and SSD, full root SSH access, and a browser serial console. LGPL-2.1 licensed.
Deploy