Airbroke
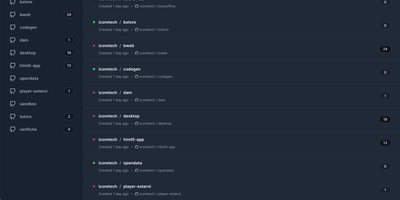
Engineering teams use Airbroke to catch application exceptions in one self-hosted error tracker where they can triage issues, replay failing requests, and debug without a per-event bill. Your existing Airbrake or Sentry clients point at its compatible HTTP collector endpoints, so instrumented applications keep reporting with no new SDK to adopt, and every occurrence lands in storage where the footprint stays small even under heavy ingestion. The web interface groups errors into issues you can triage, bookmark important occurrences for follow-up, and read occurrence charts that show whether a bug is a one-off or a slow-building wave. When an HTTP exception looks suspicious, you can replay the original request directly or copy a generated cURL command that reproduces it exactly, turning vague log complaints into debuggable cases. An AI assistant answers questions about issues in context, an MCP API lets LLM agents query your error data programmatically, and multiple OAuth providers secure sign-in for the team. It runs as a small service needing only a database, a single core, and a few hundred megabytes of memory. Running on a dedicated VPS on RepoCloud with guaranteed CPU, RAM, and SSD, full root SSH access, and a browser serial console. MIT licensed.
Measure
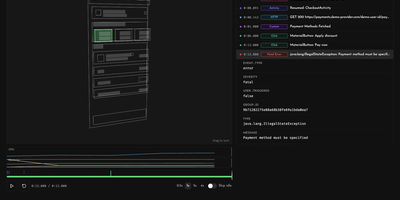
Measure is an open-source mobile monitoring platform that shows mobile teams what broke, how often, and what the user did right before it happened. Crashes, ANRs, and app hangs are grouped into single issues, and each fatal error arrives with a session replay: an ordered timeline of screens opened, taps, network calls, logs, and lifecycle events, with CPU and memory charts alongside screenshots and wireframe layout snapshots. Bug reports can be filed with a device shake or an SDK call and carry the same history of user actions. Performance traces and spans break slow startups and screens into steps, and network monitoring ranks the slowest and most error-prone endpoints. Funnels built from custom events show conversion and drop-off at each step, with a Friction view that ties every step to the crashes, errors, slow traces, and network requests users hit there. User journeys chart how people move between screens, and Adaptive Capture changes sampling, replay length, and screenshot masking remotely, with no new app build. SDKs cover Android, iOS, Flutter, React Native, and Kotlin Multiplatform. Teams sign in with Google or GitHub, invite colleagues by email, and send alerts to Slack, and an optional Measure Agent lets a coding agent or Slack help debug production issues. Running on a dedicated VPS on RepoCloud with guaranteed CPU, RAM, and SSD, full root SSH access, and a browser serial console. Apache-2.0 licensed.
OpenReplay
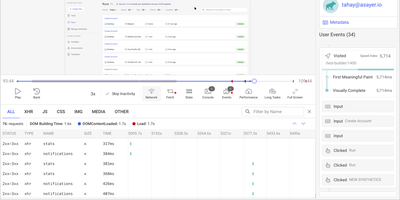
Backed by 12,400+ GitHub stars and positioned as the self-hosted alternative to FullStory and Hotjar, OpenReplay delivers the open-source session replay platform that keeps every byte of user behavior data on your own infrastructure. The JavaScript tracker captures pixel-perfect recordings of clicks, scrolls, form inputs, and navigation with automatic sensitive data masking, while simultaneously logging network requests, console errors, JavaScript exceptions, and Redux, VueX, MobX, NgRx, Pinia, and Zustand store state changes for complete technical context. DevTools mode reconstructs each session with full stack traces, GraphQL queries from Apollo and Relay, Fetch and Axios request payloads, CPU and memory metrics, and page speed waterfall charts — effectively giving developers a browser inspector tied to any user session. Product analytics surfaces conversion funnels, user journeys, click heatmaps, web vitals trends, and retention cohorts without requiring custom instrumentation. Co-browsing connects support agents to live user sessions with cursor control and WebRTC audio, enabling real-time assistance without third-party screen-sharing software. Integrations push session context into Sentry, Datadog, CloudWatch, Stackdriver, and Elastic for front-to-back debugging. Feature flags enable gradual rollouts with session-level targeting. The platform deploys to any cloud via Docker and Kubernetes with auto-scaling ingestion handling up to 50,000 sessions per month on the open-source edition. Running on a dedicated VPS on RepoCloud with guaranteed CPU, RAM, and SSD, full root SSH access, and a browser serial console. AGPLv3 licensed.
Garnet
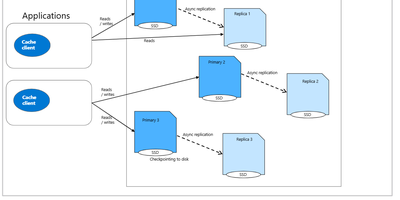
Garnet is Microsoft Research's cache-store built on .NET that speaks the Redis RESP wire protocol while delivering up to 10x higher throughput and 4x lower tail latency than comparable alternatives on identical hardware. The Tsavorite storage engine provides a cache-friendly, shared-memory architecture scaling linearly across CPU cores, supporting both in-memory operation and tiered storage across local SSDs and Azure Storage for datasets exceeding available RAM. Cluster mode enables sharded deployments with replication, dynamic key migration for live rebalancing, non-blocking checkpointing, and automatic failover using standard Redis cluster commands. The RESP implementation covers raw strings, sorted sets, lists, hashes, sets, bitmaps, HyperLogLog, streams, pub/sub, Lua scripting, and client-side transactions, allowing StackExchange.Redis, Jedis, redis-py, and other Redis clients to connect without modification. C#-based extensibility lets developers define custom commands and new data types as server-side stored procedures, compiled and loaded at runtime without restarting the server. TLS encryption, ACL-based access control, and operation logging complete the production feature set. Deployed across Microsoft services including Windows & Web Experiences, Azure Resource Manager, and Azure Resource Graph. Nearly 12,000 GitHub stars. MIT licensed.
Munin
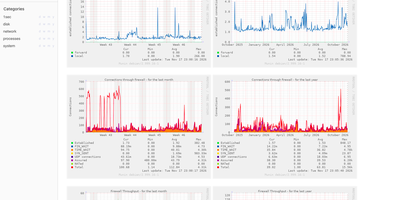
Point Munin at your computers, and this plug-and-play monitoring tool graphs what they are doing, keeps the history, and serves it all in a web interface. A central master polls a small agent on every host every five minutes. That works for a home Raspberry Pi and for a cluster of more than 100 nodes. A default install switches on a large set of plugins on its own. Load, disk, network, and process graphs start filling in with no setup per metric. Plugins are standalone executables that answer a config call with metadata and a plain call with values. Plain shell scripts count. Computers, networks, SANs, applications, even weather measurements: all graphable. The project gallery lists more than a thousand community-supported plugins. No agent on a device? SNMP plugins fetch its values remotely. With supersampling, selected plugins record readings every ten seconds. Every data field can carry warning and critical ranges. Cross one, and Munin can send email, write to syslog, run any script, or notify Nagios or Icinga. Graphs are drawn on demand through CGI or FastCGI. They are grouped by host and category, with hour, day, week, month, and year views side by side. Several masters can watch the same nodes, each keeping its own data. A rewritten node agent covers machines that cannot run the standard one. Running on a dedicated VPS on RepoCloud with guaranteed CPU, RAM, and SSD, full root SSH access, and a browser serial console. GPL-2.0 licensed.

Chatwoot
Unleash the power of Chatwoot, the open-source superhero in the world of customer experience! This platform is perfect for businesses craving to connect with their customers across a multitude of channels without breaking the bank. Wave goodbye to the high-and-mighty likes of Intercom, Zendesk, and Salesforce Service Cloud, and say hello to a wallet-friendly powerhouse. Chatwoot turns your agents into customer service ninjas, armed with the latest in workload management, performance tracking reports that refresh themselves (because who has time for that?), and automations that work smarter, not harder. Zap through conversations with lightning-fast responses and manage your social media and email interactions in a single bound. Plus, with Chatwoot, you get to be the Sherlock of customer satisfaction, deducing your CSAT scores on autopilot. All this hosted on RepoCloud, where the cost is as tiny as the effort you'll need to switch over. Get ready to engage, enlighten, and entertain your customers with Chatwoot!
Supercheck
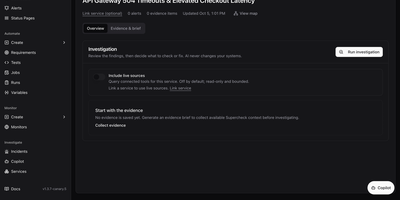
Browser tests, load tests, uptime checks, public status pages, and an AI incident investigator all live in one self-hosted dashboard called Supercheck. Write browser, API, database, custom, and k6 performance tests in a built-in code editor, or record a flow with the Chrome and Edge Recorder extension and save it as a Playwright script. Group tests into scheduled jobs, trigger them from CI with trigger keys, and review run logs, screenshots, traces, and reports. Five monitor types cover HTTP endpoints, website SSL expiry, ping, TCP and UDP ports, and scheduled synthetic browser journeys, with administrator-defined check locations and alerts to email, Slack, Discord, Telegram, Microsoft Teams, or webhooks. Status pages publish component health with 90-day uptime, incidents, scheduled maintenance, badges, and subscriber notifications under a subdomain or custom domain. When something breaks, the incident workspace collects evidence, drafts an evidence brief, and runs a read-only AI investigation across connectors such as GitHub, Prometheus, Grafana, and Kubernetes, while Copilot answers questions about that evidence. Requirements link expectations to tests and show coverage, and AI can extract them from a PRD. Organizations, projects, six roles, API keys, and audit trails keep teams in their lanes, and the CLI pulls, diffs, and deploys resources as code. Running on a dedicated VPS on RepoCloud with guaranteed CPU, RAM, and SSD, full root SSH access, and a browser serial console. AGPL-3.0 licensed.
Sentry
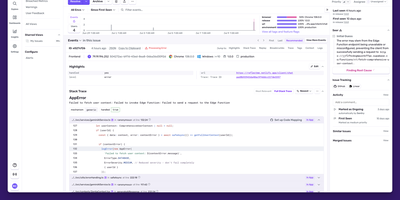
Backed by 44,000 GitHub stars and trusted by over four million developers, Sentry is the debugging platform that captures errors, traces, replays, profiles, and metrics from your applications and connects them all through distributed tracing. The error tracking engine captures full stack traces with source context, breadcrumbs, and automatic demangling for native crashes, while intelligent grouping consolidates duplicate events into actionable issues with regression detection and automatic assignment. Performance monitoring instruments your frameworks automatically, capturing every database query, API call, cache hit, and queue operation as spans within distributed traces that flow across frontend, backend, and mobile boundaries. Session Replay produces video-like recordings of real user sessions showing DOM interactions, network requests, console messages, and errors on a synchronized timeline, with AI-powered summaries that describe what happened without watching the full replay. Continuous profiling captures CPU execution data at the function and line level for Node.js, Python, iOS, and Android, linking slow spans directly to the exact code responsible. Cron monitoring tracks scheduled jobs for failures, missed runs, and duration anomalies. The alerting engine fires notifications through Slack, PagerDuty, Opsgenie, and webhooks on new issues, regressions, error spikes, or when latency and crash-free session rate thresholds are crossed. Self-hosted deployment runs as a Docker Compose stack with PostgreSQL, ClickHouse, Kafka, Redis, and Relay. Running on a dedicated VPS on RepoCloud with guaranteed CPU, RAM, and SSD, full root SSH access, and a browser serial console. FSL licensed.
Bencher
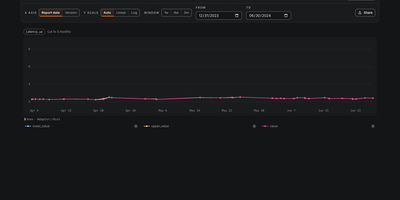
Bencher keeps a continuous record of your benchmark results and flags performance regressions in its web console before they merge into your main branch. Keep the benchmarks you already have: the bencher CLI runs your harness, collects its output through adapters for tools including Criterion, Iai, pytest-benchmark, Go benchmarks, and hyperfine, and ships the numbers to your server. Run the same command on your laptop and in CI, so a pull request compares against a baseline built by the same measurement pipeline instead of a fresh guess. The console plots every benchmark across branches, testbeds, and measures, turning months of runs into lines you can read at a glance. Set thresholds on any measure and Bencher applies statistical tests to separate a genuine slowdown from ordinary machine noise. When a result crosses a threshold, an alert fires and the CI run can fail, so the regression conversation happens on the pull request rather than in production. History stays queryable through the API and console, so you can pin down when a specific function got slower and which change did it. Self-host the Console and API servers with Docker next to the code they measure, and keep every result on machines you control. Running on a dedicated VPS on RepoCloud with guaranteed CPU, RAM, and SSD, full root SSH access, and a browser serial console. Apache-2.0 or MIT licensed.
DragonflyDB
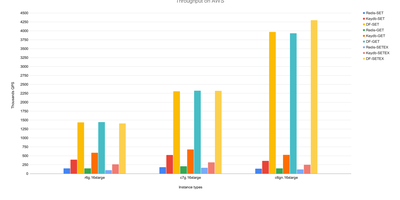
With over 30,000 GitHub stars and benchmarks showing 25x the throughput of single-threaded Redis, DragonflyDB is a modern in-memory data store that eliminates the need for complex Redis Cluster deployments by fully utilizing every CPU core on a single machine. Its shared-nothing, thread-per-core architecture written in C++ supports over 200 Redis commands and 13 Memcached commands, making it a true drop-in replacement that requires zero application code changes. A single DragonflyDB instance scales vertically from 8GB to 768GB of RAM across up to 64 cores, replacing entire Redis Cluster topologies with one process while maintaining full compatibility with Strings, Hashes, Lists, Sets, Sorted Sets, Streams, JSON, and Bloom Filters. The novel dashtable data structure and cache eviction algorithm achieve higher hit rates than LRU and LFU with zero memory overhead per entry. Forkless point-in-time snapshotting eliminates the memory spikes associated with Redis BGSAVE, while automatic backup scheduling via cron syntax supports both local disk and AWS S3 cloud storage. Primary-replica replication follows the Redis replication protocol up to version 6.2, and Prometheus-compatible metrics at the default port enable Grafana monitoring dashboards out of the box. DragonflyDB also exposes an HTTP admin interface on its main TCP port for operational monitoring. Running on a dedicated VPS on RepoCloud with guaranteed CPU, RAM, and SSD, full root SSH access, and a browser serial console. BSL 1.1 licensed.
Pinpoint
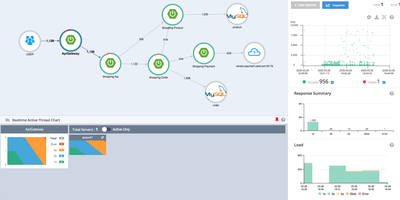
When checkout slows to a crawl somewhere across forty services, Pinpoint draws you the map of what is actually talking to what and where the time went. The ServerMap renders your whole topology live: services, databases, message queues, and external APIs as nodes whose edges carry transaction counts and error rates, so the unhealthy dependency announces itself visually. Click a node and the scatter chart plots every request against its response time; drag across the suspicious cluster and the CallStack opens those exact transactions at code level, method by method, SQL statement by SQL statement, until the bottleneck has nowhere to hide. The Inspector watches each application's CPU, memory, garbage collection, TPS, and JVM arguments, while realtime active-thread charts show stuck work as it happens. Agents attach to Java, PHP, and Python applications without changing a line of code, and applications already instrumented with OpenTelemetry send their traces straight in over OTLP. Group applications into services so each team sees its own Service Map, then arm alarm templates for slow counts, error rates, and thread saturation before users notice. Error Analysis gathers exceptions and error logs grouped by route, and URI metrics rank your hottest endpoints by cost. Running on a dedicated VPS on RepoCloud with guaranteed CPU, RAM, and SSD, full root SSH access, and a browser serial console. Apache-2.0 licensed.
Locust
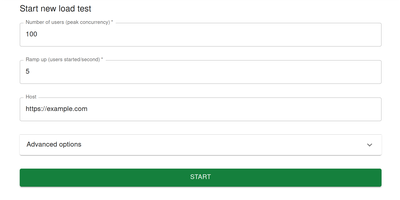
Locust is a load-testing tool that turns plain Python scripts into swarms of simulated users, so you can find out exactly how much traffic your service survives before it falls over. You model real behavior with ordinary Python: classes describe user types, tasks carry weights, and waits plus conditional logic mimic how people actually browse, log in, and check out. The web interface starts the swarm, charts requests per second, response times, and failures as they happen, and lets you raise or lower the load mid-run the moment a bottleneck appears. One machine is rarely the limit: a master process coordinates worker processes across as many machines as you can give it, and every worker runs thousands of greenlet users without thread overhead. HTTP is the home turf, but custom clients let the same scripts load-test WebSockets, gRPC, databases, message queues, or any protocol you can call from Python. Custom load shapes bend the user curve into steps, waves, or double peaks that mirror launches and flash sales instead of a flat ramp. Results export as CSV data and standalone HTML reports for the team, stats can stream into TimescaleDB and Grafana during long runs, and headless mode drops the whole test into CI pipelines. Running on a dedicated VPS on RepoCloud with guaranteed CPU, RAM, and SSD, full root SSH access, and a browser serial console. MIT licensed.
Percona PMM
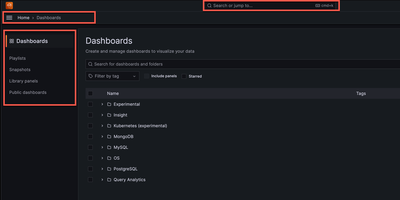
Backed by 1,080+ GitHub stars and maintained by Percona with the latest release v3.8.1 in June 2026, Percona Monitoring and Management delivers the open-source database observability platform that provides a single pane of glass across MySQL, PostgreSQL, MongoDB, Valkey, and Redis databases deployed on-premises, cloud, or hybrid environments. The Go-powered PMM Server collects metrics from lightweight PMM Client agents with minimal performance impact, storing time-series data in ClickHouse for fast querying across configurable retention periods. Query Analytics ranks every query by load across all database engines from one unified dashboard, drilling from fleet-level performance down to individual problematic queries with explain plans, per-query metrics, and anomaly detection. Real-time Query Analytics streams live MongoDB operations updated every 1-5 seconds for immediate troubleshooting of lock contention and long-running queries. Built-in Percona Advisors continuously scan connected databases for security gaps, misconfigurations, and performance problems, distilling decades of DBA expertise into automated actionable recommendations. Percona Alerting integrates with 15+ notification channels including Slack, PagerDuty, email, and webhooks to trigger on custom metric thresholds. Database-specific dashboards visualize InnoDB storage engine details, WiredTiger cache metrics, PostgreSQL tuple activity, replication lag, and cluster health with annotations for root-cause correlation. Deployment options include Docker single-container setup, Podman rootless execution, and Helm charts for Kubernetes with Ingress controller support and ConfigMap management. Running on a dedicated VPS on RepoCloud with guaranteed CPU, RAM, and SSD, full root SSH access, and a browser serial console. AGPL-3.0 licensed.
CHMonitor
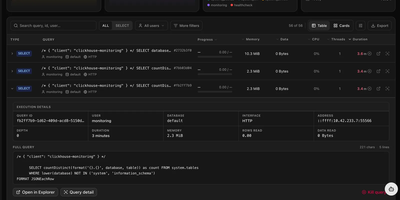
When a ClickHouse cluster slows down, the answers are buried in system tables nobody wants to query by hand; CHMonitor turns those tables into an operations dashboard that explains what the cluster is doing and what to fix next. Live views cover running queries with elapsed time, memory, and a kill action, while history, failed, slowest, and most-expensive pages rank finished work by CPU, duration, and rows read, each with the full statement and one-click EXPLAIN. Thread-level analysis shows how a single query parallelized, and per-user summaries reveal which analyst or service is eating the cluster. Beyond queries, you get a merge and part-lifecycle timeline, replication queue and Keeper health, a live topology map of shards and replicas, storage breakdowns by database, table, and part, and a query activity heatmap spanning a year. An AI advisor reviews the workload and recommends skip indexes, projections, PREWHERE clauses, and TTL changes ranked by impact, with an MCP interface and built-in agent for asking questions in plain English; it recommends only and never applies DDL. Threshold-based health checks alert to Slack, Discord, PagerDuty, or Opsgenie, multiple ClickHouse hosts are watched from one dashboard, and a companion terminal UI covers quick checks from the shell. Running on a dedicated VPS on RepoCloud with guaranteed CPU, RAM, and SSD, full root SSH access, and a browser serial console. GPL-3.0 licensed.
Flyimg
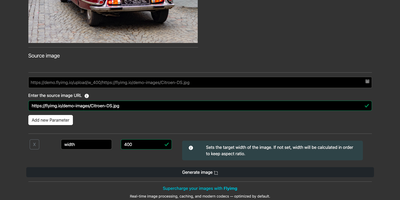
Flyimg generates every image size a website needs at request time, turning one original into resized, cropped, and compressed variants through a simple URL. Append options like width, height, crop, and quality to a request, and the service fetches the source image, transforms it, and serves the result, storing it in cache so the next request is answered instantly. Output defaults to AVIF for browsers that support it, with WebP and MozJPEG compression available for lean JPEG delivery, plus PNG and GIF when the source calls for them. Signed URLs keep strangers from using your server as a free image proxy, and domain restrictions limit which sources the service will fetch from. One Docker container gives a website or application a complete image pipeline: originals stay in whatever storage already holds them, and every thumbnail, banner, and product shot is produced at request time in exactly the dimensions the layout needs. Cache headers and repeat serving keep bandwidth costs predictable as traffic grows. Running on a dedicated VPS on RepoCloud with guaranteed CPU, RAM, and SSD, full root SSH access, and a browser serial console. AGPL-3.0 licensed.