Apache Doris
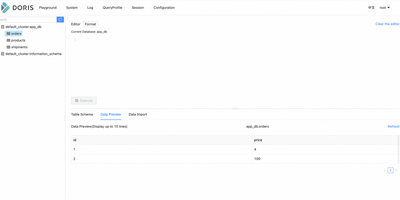
Dashboards should not wait minutes for yesterday's data, so Apache Doris answers analytical SQL over fresh data with a massively parallel, fully vectorized engine that processes column batches instead of row after row. Frontends receive queries over the MySQL protocol, plan them with a cost-based optimizer, and coordinate execution, while Backends store columnar tablets and run scans, joins, and aggregations in parallel pipelines across cores. Data lands continuously through stream and batch loads, broker imports from object storage, and change capture from operational databases, and it is queryable immediately for reporting that reflects the last minutes rather than the last nightly job. Tables outside Doris join the same SQL through catalogs for Hive, Iceberg, Paimon, Hudi, and JDBC sources, with local caching and materialized views accelerating the lakehouse queries your team runs every day. Search workloads live here too: an inverted index and a SEARCH function provide full-text retrieval, vector indexes support similarity search, and AI functions call language models from SQL for extraction and summarization, so hybrid queries mix keywords, semantics, and structured filters in one statement. Workload groups, resource controls, and compute-storage separation in cloud mode keep interactive dashboards fast while heavy ETL spills safely to disk. Running on a dedicated VPS on RepoCloud with guaranteed CPU, RAM, and SSD, full root SSH access, and a browser serial console. Apache-2.0 licensed.
CHMonitor
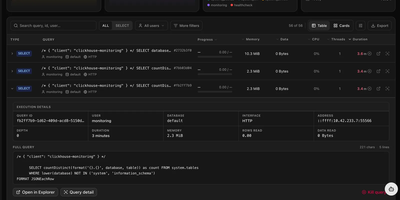
When a ClickHouse cluster slows down, the answers are buried in system tables nobody wants to query by hand; CHMonitor turns those tables into an operations dashboard that explains what the cluster is doing and what to fix next. Live views cover running queries with elapsed time, memory, and a kill action, while history, failed, slowest, and most-expensive pages rank finished work by CPU, duration, and rows read, each with the full statement and one-click EXPLAIN. Thread-level analysis shows how a single query parallelized, and per-user summaries reveal which analyst or service is eating the cluster. Beyond queries, you get a merge and part-lifecycle timeline, replication queue and Keeper health, a live topology map of shards and replicas, storage breakdowns by database, table, and part, and a query activity heatmap spanning a year. An AI advisor reviews the workload and recommends skip indexes, projections, PREWHERE clauses, and TTL changes ranked by impact, with an MCP interface and built-in agent for asking questions in plain English; it recommends only and never applies DDL. Threshold-based health checks alert to Slack, Discord, PagerDuty, or Opsgenie, multiple ClickHouse hosts are watched from one dashboard, and a companion terminal UI covers quick checks from the shell. Running on a dedicated VPS on RepoCloud with guaranteed CPU, RAM, and SSD, full root SSH access, and a browser serial console. GPL-3.0 licensed.

LynxDB
LynxDB is a single-binary log analytics database that ingests logs once into indexed columnar storage, so you can query the same events repeatedly without re-reading raw files or standing up a JVM stack. Pipe kubectl output or local files straight into the LynxFlow query engine for ad hoc investigation, or run the persistent server and let shippers deliver logs through Elasticsearch bulk, OpenTelemetry OTLP, Splunk HEC, syslog, and raw HTTP ingest paths. LynxFlow pipelines parse JSON, regex, key-value, CSV, and other formats at read time, then extend fields, filter with typed predicates, aggregate with stats, join CTEs, and rank results, all in one explicit grammar with time-series helpers for buckets, percentiles, gap filling, and trend lines. Full-text search runs on an FST dictionary, roaring bitmap postings, and bloom filters that skip cold segments, and materialized views keep partial aggregates ready so dashboards rewrite onto rollups automatically. Convert Sigma detections into LynxFlow queries for security hunting, tail live results as new logs arrive, and tier older data out to S3. Individual analysts use it to dissect local application logs, and platform teams run it as a cluster for shared observability with the Web UI and REST API open to everyone. Running on a dedicated VPS on RepoCloud with guaranteed CPU, RAM, and SSD, full root SSH access, and a browser serial console. Apache-2.0 licensed.