Change Detection
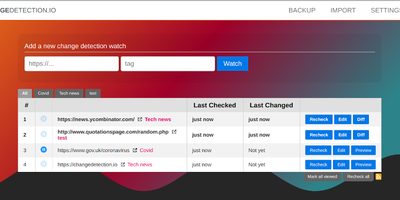
Price drops, restocks, job postings, government announcements, competitor edits - changedetection.io watches web pages and alerts you the moment anything changes, down to PDF text and checksums. Point it at a URL, set a check interval, and precise filters decide what counts as a change: a Visual Selector targets page elements by pointing and clicking, CSS selectors and XPath narrow scope, trigger-text and ignore-text rules (with regex support) cut noise, and JSONPath or jq handles API responses. A dedicated re-stock and price detection mode extracts product metadata and fires on thresholds - alert only when the price drops below your target or the percentage change exceeds a limit. JavaScript-heavy sites render through a real Chrome browser via Playwright, with the ability to execute JS steps first (log in, click, scroll) before extracting text. Notifications reach 85+ services through Apprise - Discord, Slack, Telegram, email, webhooks - optionally with a screenshot of the changed page, and AI-powered summaries (any OpenAI-compatible endpoint, including local Ollama) describe what changed. Per-watch proxies, custom headers, and POST/GET control cover hostile targets. Apache-2.0 licensed with local file-based storage: the URLs you monitor and why stay entirely your business.
Zasper
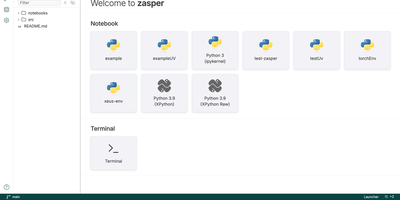
Notebook work gets a lighter home in Zasper, a browser IDE that runs any Jupyter kernel on a fraction of the memory JupyterLab needs. Plotly, ipywidgets, HTML, and Markdown with LaTeX render inline, and saved files match what Jupyter would write byte for byte. A variables panel inspects the running kernel, DataFrames open as a grid that turns into a chart, and SQL cells query the databases you connect. Edits made to the file on disk flow into the open notebook cell by cell, and a run started from another tab or an agent still reaches its cell. A code editor, terminal, and Git panel share the window, and notebook diffs compare cell by cell. Claude Code, Gemini CLI, Codex, or any agent that speaks the Agent Client Protocol can work in a side panel, with each change it makes reviewed and undone from there. A command palette searches files and commands together, trusted folders keep untrusted code from running, and light and dark themes are included. Running on a dedicated VPS on RepoCloud with guaranteed CPU, RAM, and SSD, full root SSH access, and a browser serial console. AGPL-3.0 licensed.
Briefer
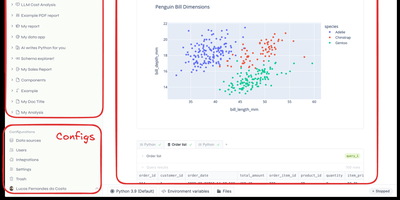
Backed by Y Combinator with 4,300 GitHub stars and growing rapidly since its September 2024 launch, Briefer delivers the first truly unified notebook-and-dashboard platform that eliminates the fragmented workflow of juggling Jupyter for analysis, Tableau for visualization, and Notion for documentation — combining all three in a single Notion-like workspace where SQL query results automatically become Python DataFrames accessible in subsequent code blocks. The built-in AI analyst understands your database schema and notebook context to generate SQL queries, write Python transformations, create visualizations, and fix errors on demand using configurable OpenAI or private LLM backends. Connect directly to PostgreSQL, MySQL, BigQuery, Redshift, Snowflake, and Amazon Athena as data sources, or upload CSV files for immediate analysis. Native point-and-click visualizations produce charts, tables, and dashboards without writing code, while interactive data apps use inputs, dropdowns, and date pickers to create parameterized reports for non-technical stakeholders. Scheduled execution runs notebooks and dashboards periodically with results delivered via Slack integration or public shareable links. Write-back queries modify production data directly from notebooks for ad-hoc pipeline testing. The architecture runs as three Docker containers — web frontend, API server, and optional AI service — backed by PostgreSQL and a Jupyter server for Python execution, deployable via single Docker command, Docker Compose, or Helm charts for Kubernetes. Running on a dedicated VPS on RepoCloud with guaranteed CPU, RAM, and SSD, full root SSH access, and a browser serial console. AGPLv3 licensed.
Lumen
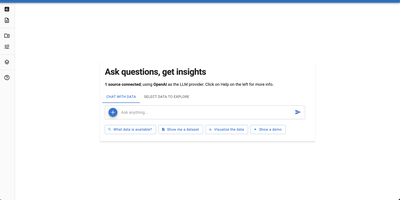
Ask Lumen which islands have the most penguins and it writes the SQL, runs it, and draws the chart in a split-screen explorer. Drag in CSV, Parquet, JSON, or Excel files, or point it at a database, and mark extra files as metadata so the model understands what each column means. Every answer lands in its own exploration, with follow-up questions nested beneath it, and the generated SQL or Vega-Lite chart specification sits in an editor you can change to update the view instantly. Tables sort, filter, and paginate, charts carry tooltips and annotations, and results export as CSV, Excel, PNG, or PDF. Report mode gathers all explorations into one document that downloads as a notebook with every question, query, and visualization ready to rerun. A planner agent breaks hard questions into steps, a validation pass checks that the answer matches the request, and settings choose among OpenAI, Anthropic, Ollama, and other language model providers. Developers can add custom agents, tools, and analyses, or write declarative specifications that become shareable dashboards. Running on a dedicated VPS on RepoCloud with guaranteed CPU, RAM, and SSD, full root SSH access, and a browser serial console. BSD-3-Clause licensed.
JupyterLab
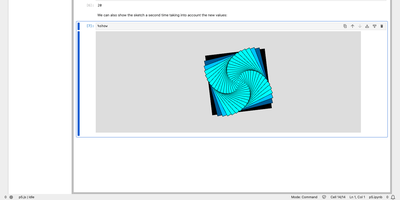
Exploratory data work, teaching material, and research code all live in the same browser tab with JupyterLab, the web workspace of Project Jupyter. Notebooks combine runnable code cells, Markdown, and rich output such as images, JSON, and Vega charts, and they use the same notebook format as the classic Jupyter Notebook. Any Jupyter kernel can execute the code, so Python, R, and other languages share one interface, and code inside plain text files such as Markdown or LaTeX can be run interactively as well. Tabs and splitters arrange documents side by side, and a notebook's cell outputs can be mirrored into their own tab to build a simple dashboard with interactive controls. Code consoles serve as scratchpads linked to a notebook kernel, while full terminals run system shells such as bash on the server. A visual debugger offers breakpoints, a call stack, and a variable explorer for kernels that support the Jupyter debug protocol. Markdown, CSV, and Vega documents show a live preview as they are edited, and built-in viewers handle images, JSON, and PDF files. The Extension Manager installs themes, editors, and renderers from PyPI, and real-time collaboration becomes available by adding the jupyter-collaboration extension. Access is protected by a generated token unless a password is set. Running on a dedicated VPS on RepoCloud with guaranteed CPU, RAM, and SSD, full root SSH access, and a browser serial console. BSD-3-Clause licensed.
MarimoHub
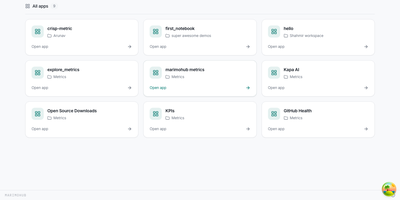
Running one marimo notebook is easy; running a team's worth of them, with storage, sign-on, versions, and somewhere for the results to live, is the job MarimoHub takes on. Notebooks gather in a searchable gallery organized by project, where every edit session leaves a version you can compare side by side, inspect, and restore when an experiment takes a wrong turn. Projects connect their data sources once through a versioned integration catalog, with sensitive values encrypted or pulled from external secret stores, and every new session receives the configuration automatically. When a notebook is ready for people who should never see its code, publish it as an interactive app: viewers get the controls and outputs while rollouts shift versions underneath them. Scheduled jobs rerun notebooks on a clock, GitHub sync keeps repository-backed notebooks current, and an assistant can work inside the notebook context with managed AI keys that never reach the sandbox. Underneath, you pick the object storage, the compute, and the identity provider, and back up one bucket to back up the whole hub. Running on a dedicated VPS on RepoCloud with guaranteed CPU, RAM, and SSD, full root SSH access, and a browser serial console. Apache 2.0 licensed.
Shaper
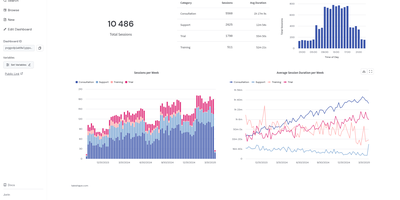
Write standard SQL queries and watch Shaper turn them into interactive dashboards, scheduled reports, and customer-facing analytics widgets without maintaining a heavy business intelligence stack. Every query maps directly to a visual component through simple type casts like BARCHART, LINECHART, GAUGE, BOXPLOT, or DROPDOWN. Analysts can attach external PostgreSQL and MySQL databases, read Parquet, CSV, JSON, and Excel files straight from S3 object storage, or stream live events into the HTTP ingest API. Interactive filter controls let viewers slice metrics by date ranges, multi-select dropdowns, and dynamic parameter variables that automatically re-evaluate downstream charts. Teams version-control their entire reporting layer as plain SQL files in Git, making dashboard updates auditable in pull requests and simple for AI coding assistants to generate. Product engineers embed white-labeled analytics directly into customer web apps without iframes, issuing per-tenant JWT tokens to enforce row-level data isolation. Need scheduled deliverables for stakeholders? Configure SQL-driven background tasks that transform datasets on a cron schedule, send threshold alerts to Slack or Microsoft Teams, and generate downloadable PDF, PNG, Excel, or CSV reports. External collaborators can also view live metrics through password-protected sharing links. Running on a dedicated VPS on RepoCloud with guaranteed CPU, RAM, and SSD, full root SSH access, and a browser serial console. MPL-2.0 licensed.
Dory
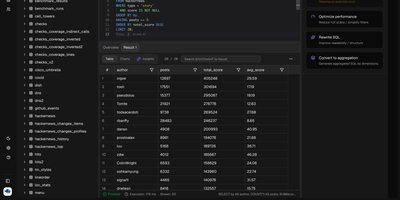
Dory is a SQL workspace where you and your AI agents work on the same queries, results, and charts. Write SQL in a multi-tab editor with schema-aware autocomplete, then let the built-in copilot generate queries from plain English, fix errors, rewrite messy statements, trim full scans, or turn a query into an aggregation. Results land in a grid you can sort, filter, and search, flip into charts, or save as reusable queries. The schema explorer draws a searchable map of tables, primary keys, and foreign keys that you can auto-arrange and export as PNG or SVG, while AI table overviews describe what each column means. Connect PostgreSQL, MySQL, MariaDB, SQL Server, Oracle, SQLite, DuckDB, Snowflake, Supabase, Neon, Cloudflare D1, and ClickHouse, with SSH tunneling for private networks. ClickHouse teams also get a monitoring console for latency, throughput, slow queries, and errors, plus user and role management with cluster-wide privileges. Claude Code, Codex CLI, and other MCP-compatible agents can list connections, explore schemas, and run read-only SQL, and the tabs they open stay editable for you to review, correct, and continue. A team can share one browser address with organizations, invited members, GitHub or Google sign-in, and access tokens for agents. Running on a dedicated VPS on RepoCloud with guaranteed CPU, RAM, and SSD, full root SSH access, and a browser serial console. Apache-2.0 licensed.
Domain Monitor
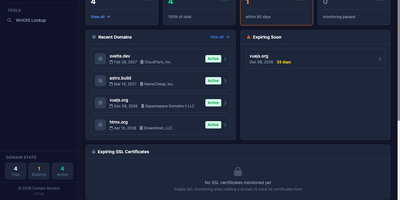
The renewal notice always seems to land in an inbox nobody checks anymore, so Domain Monitor tracks every domain you own from your own server and warns you long before each expiry date arrives. It pulls expiration dates and registrar details automatically through WHOIS and RDAP across more than 1,400 supported TLDs, keeping the whole portfolio current without anyone remembering to look. Add domains one at a time or import them in bulk, group them with tags and watchlists, and let scheduled cron checks refresh the data on their own. Alerts escalate on your schedule, at 60, 30, 21, 14, 7, 5, 3, 2, and 1 day before expiry, and arrive through email, Telegram, Discord, Slack, Mattermost, Pushover, or webhooks, routed by notification groups so the right people hear about the right domains. Each domain also gets tabbed views for its DNS records, SSL certificate validity, billing notes, notification history, and raw WHOIS output, with per-domain toggles for DNS and certificate monitoring. The dashboard surfaces what expires soon, how domains distribute across registrars, and whether every domain is actually covered by an alert channel. Multiple users get their own accounts with two-factor authentication, tracked sessions, and an in-app notification center. Running on a dedicated VPS on RepoCloud with guaranteed CPU, RAM, and SSD, full root SSH access, and a browser serial console. MIT licensed.