
Gods Eye View
God's Eye View turns your browser into a real-time spatial intelligence command center, rendering thousands of live aircraft, ships, satellites, earthquakes, traffic flows, and public cameras on a photorealistic 3D Earth powered by CesiumJS and Google Photorealistic 3D Tiles. Click any aircraft to see its transponder telemetry from OpenSky and adsb.lol, including route history, altitude, speed, and callsign; track live vessel positions worldwide through AIS beacon data from AISStream; or follow roughly 840 satellites color-coded by class using orbital elements from CelesTrak. A hands-free voice agent powered by the OpenAI Realtime API lets you ask the planet questions in natural language, and the globe annotates your answer directly in 3D space. Toggle FLIR mode for a thermal camera aesthetic, layer in NASA FIRMS wildfire data, switch between Google 3D, Bing aerial, and OpenStreetMap base layers, or tune into a geolocated world radio dial. Public CCTV cameras are projected into 3D city geometry with viewshed cones and direct-manipulation calibration. The cockpit mode provides a pilot-style briefing surface with mission-specific overlays. Entity inspection panels show detailed metadata for every tracked object, and shareable links let you send any scene configuration to a colleague. Ten of the thirteen live data layers work with zero API keys, while the required Google Maps key offers 1,000 free 3D tile sessions per month. Running on a dedicated VPS on RepoCloud with guaranteed CPU, RAM, and SSD, full root SSH access, and a browser serial console. MIT licensed.
OpenReplay
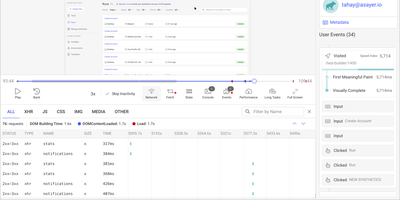
Backed by 12,400+ GitHub stars and positioned as the self-hosted alternative to FullStory and Hotjar, OpenReplay delivers the open-source session replay platform that keeps every byte of user behavior data on your own infrastructure. The JavaScript tracker captures pixel-perfect recordings of clicks, scrolls, form inputs, and navigation with automatic sensitive data masking, while simultaneously logging network requests, console errors, JavaScript exceptions, and Redux, VueX, MobX, NgRx, Pinia, and Zustand store state changes for complete technical context. DevTools mode reconstructs each session with full stack traces, GraphQL queries from Apollo and Relay, Fetch and Axios request payloads, CPU and memory metrics, and page speed waterfall charts — effectively giving developers a browser inspector tied to any user session. Product analytics surfaces conversion funnels, user journeys, click heatmaps, web vitals trends, and retention cohorts without requiring custom instrumentation. Co-browsing connects support agents to live user sessions with cursor control and WebRTC audio, enabling real-time assistance without third-party screen-sharing software. Integrations push session context into Sentry, Datadog, CloudWatch, Stackdriver, and Elastic for front-to-back debugging. Feature flags enable gradual rollouts with session-level targeting. The platform deploys to any cloud via Docker and Kubernetes with auto-scaling ingestion handling up to 50,000 sessions per month on the open-source edition. Running on a dedicated VPS on RepoCloud with guaranteed CPU, RAM, and SSD, full root SSH access, and a browser serial console. AGPLv3 licensed.
Ghostfolio
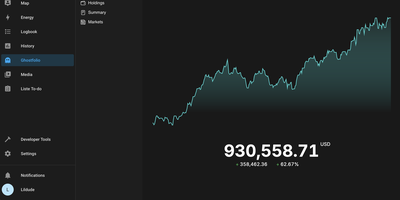
Stocks, ETFs, crypto, bonds, precious metals, and cash across every account and currency, in one privacy-first dashboard: Ghostfolio is open-source wealth management software. The deliberate design decision is no brokerage linking: positions enter by manual entry, CSV import, or the REST API, so your holdings never pass through a data aggregator. Performance is measured as return on average investment across Today, WTD, MTD, YTD, 1Y, 5Y, and Max timeframes, with benchmark comparison against indices like the S&P 500, dividend tracking, and allocation breakdowns by asset class, region, and sector. A static X-ray analysis flags concentration and other portfolio risks, and a FIRE calculator projects progress toward financial independence. Multi-currency support converts holdings using historical exchange rates, market data comes from Yahoo Finance and CoinGecko among other pluggable providers, and everything exports back out as CSV or JSON. Built with Angular and NestJS on PostgreSQL and Redis, shipped as Docker images for amd64 and ARM, with a mobile-first PWA interface, dark mode, and a distraction-free Zen mode. AGPL-licensed.
Dub
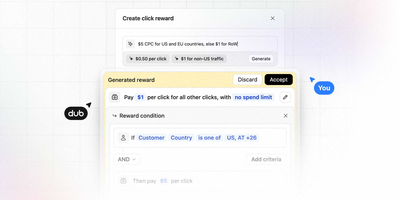
With 24,000 GitHub stars and infrastructure processing over 100 million clicks and 2 million links monthly for marketing teams at Twilio, Buffer, Framer, Perplexity, and Vercel, Dub is the most widely adopted open-source link attribution platform — unifying branded short links, real-time conversion analytics, and affiliate programs in a single self-hostable tool. Create short links on custom domains with built-in QR code generation, device and geographic targeting rules, A/B testing for destination URLs, deferred deep linking for mobile apps, and custom social media preview cards. The attribution engine tracks the complete customer journey from first click through lead capture to final sale, calculating lifetime value, retention rates, and multi-touch attribution across campaigns. Real-time analytics visualize clicks, leads, and revenue with filtering by geography, device, browser, referrer, operating system, and UTM parameters — plus an "Ask AI" feature that generates personalized reports from natural language queries. The partner program module enables embedded referral and affiliate programs with custom reward structures, automated payouts, and partner dashboards for product-led growth. Programmatic link creation via native SDKs for TypeScript, Python, Go, PHP, and Ruby supports enterprise-scale campaigns with real-time webhook notifications on link events. Migration assistants import existing links from Bitly, Rebrandly, and Short.io with redirects preserved. Running on a dedicated VPS on RepoCloud with guaranteed CPU, RAM, and SSD, full root SSH access, and a browser serial console. AGPLv3 licensed.
CPA Manager Plus
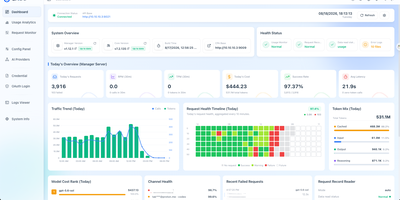
CPA Manager Plus is a self-hosted observability dashboard and management panel that tracks every AI request flowing through your CLI Proxy API gateway, breaking down failures, costs, and account health across providers like OpenAI, Anthropic, xAI, and Codex in one interface. When a request fails, drill into the persistent history to see status codes, affected models, latency, and redacted failure evidence without exposing raw response bodies. The cost analytics engine breaks down token consumption and estimated spend by model, provider, account, API key, project, channel, and time range while tracking input, output, reasoning, cache, and service-tier pricing semantics separately. Model prices sync automatically from models.dev with LiteLLM and OpenRouter fallbacks, and you can add local overrides for aliases or internal models. For teams running Codex or xAI accounts, the health inspector reads quota windows, reset evidence, credential state, and workspace status on a configurable schedule, routing credential failures into an action queue for review rather than letting them silently degrade throughput. Deploy the Lightweight Panel to replace your existing CPA management UI without adding another service, or run Full Mode as a single Docker container that adds the Manager Server with persistent SQLite storage for request history, historical analytics, and automated account inspections. Export or import request history as JSONL for external analysis, and back up the SQLite files alongside your encrypted management keys. Running on a dedicated VPS on RepoCloud with guaranteed CPU, RAM, and SSD, full root SSH access, and a browser serial console. MIT licensed.
Aptabase
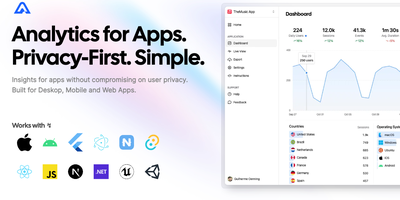
Web analytics tools ignore native mobile, desktop, and game apps; Aptabase was built for exactly those. If Firebase Analytics would force a privacy-policy footnote you don't want to write, this is the alternative - session-based metrics with no cookies, no IDFA or GAID, no device fingerprinting, and a daily-rotated salt that makes cross-day re-identification mathematically impossible. That design means GDPR, CCPA, and PECR compliance out of the box and "Data Not Collected" App Store privacy labels without ATT prompts. The SDK coverage is the widest in its category: eleven first-party libraries spanning Swift, Kotlin, Flutter, React Native, Tauri, Electron, .NET MAUI, NativeScript, Unity, Unreal Engine, and JavaScript for web - each MIT-licensed, following platform conventions, and accepting a custom host parameter that points at your instance. Integration is minutes: initialize with an app key, call trackEvent with optional properties, and the dashboard shows sessions, events, app versions, OS breakdowns, and country-level geography. The self-hosted stack is a .NET server over PostgreSQL for metadata and ClickHouse for high-volume event ingestion, giving cloud-parity features under an AGPL license. For indie iOS/Android apps, Electron and Tauri tools, and Unity or Unreal games, it replaces Firebase without the Google entanglement.
Rotki
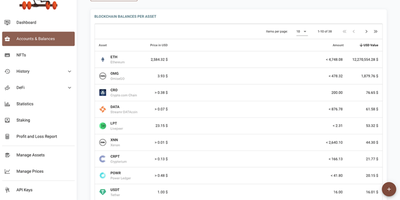
Crypto portfolio tracking that inverts the SaaS model: rotki runs on your own machine, needs no email or account for the free tier, and keeps every wallet address, balance, transaction, and tax event in a local SQLCipher database encrypted with 256-bit AES. By default nothing passes through rotki-operated servers - a design choice that matters when cloud portfolio trackers concentrate exactly the identity-linked holdings data attackers want. Centralized exchanges (Kraken, Binance, Coinbase, Bitstamp, and more) connect through read-only API keys that can see but never withdraw; blockchain accounts cover Ethereum and its L2s, Bitcoin, Solana, Polkadot, and Kusama, with ENS resolution and your choice of RPC endpoint or your own node. rotki decodes on-chain transactions into readable events across major DeFi protocols - Aave, Uniswap, Compound, Curve, Lido - and generates profit-and- loss reports for tax season with customizable accounting settings, including FIFO, LIFO, and HIFO cost-basis methods, plus CSV imports for defunct exchanges. Optional premium sync is zero-knowledge, encrypting the database on-device before upload. AGPLv3-licensed and multiplatform, with a Docker package for server deployment.
HitKeep
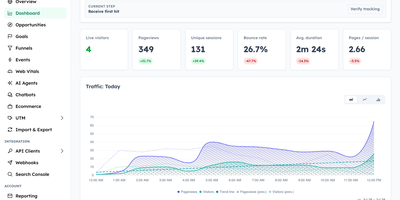
HitKeep is a sovereign web analytics platform that consolidates cookieless visitor telemetry, conversion funnels, e-commerce revenue reports, and AI engine visibility into a privacy-respecting dashboard that replaces Google Analytics and complex tracking clouds. Marketing teams can monitor inbound visitor journeys without installing intrusive consent banners or violating regional GDPR regulations. Custom conversion funnels and goal milestones track user registrations, checkout transactions, newsletter subscriptions, and software downloads with exact revenue attribution. Integrated Google Search Console synchronization brings organic search queries, keyword impression rankings, and click-through metrics directly alongside real-time pageview logs. A dedicated artificial intelligence visibility dashboard monitors crawling bots, retrieval citations, and direct referral visits originating from ChatGPT, Claude, Perplexity, and other generative search agents. Growth analysts can pose natural language questions to an embedded AI reporting assistant, generating instant cohort breakdowns and engagement trends without assembling complex manual filters. Site operators can configure custom tracking domains, whitelist reverse proxy networks, filter out referrer spam, and schedule automated database backups across persistent storage volumes. Complete data sovereignty controls allow teams to export raw event telemetry into open Parquet and CSV archives or stream metrics into external business intelligence warehouses via webhooks. Running on a dedicated VPS on RepoCloud with guaranteed CPU, RAM, and SSD, full root SSH access, and a browser serial console. MIT licensed.
Plausible
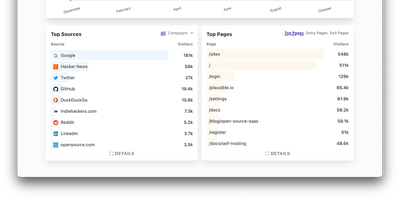
Built as a direct rejection of the adtech model, Plausible is the best-known privacy-first web analytics tool - lightweight, cookie-free, and open-source. It sets no cookies and stores no personal data: unique visitors are counted via a hash of IP plus User-Agent that rotates every 24 hours and is never stored raw, so no consent banner is required and GDPR compliance is structural rather than contractual. The tracking script is under 1 KB - orders of magnitude lighter than GA - and the dashboard is a deliberate contrast to GA4's sprawl: one fast-loading page with visitors, sources, top pages, countries, devices, and UTM breakdowns, filterable by any dimension. Custom events and goals track signups and clicks, Google Search Console integration pulls in search queries, scheduled email reports keep stakeholders updated, and the Stats API (v2) plus CSV export feed data anywhere. This is the AGPL-licensed Community Edition, the same Elixir codebase that powers Plausible's cloud service, running as three containers: the web app, PostgreSQL for accounts, and ClickHouse for event storage - which means self-hosters get direct SQL access to raw analytics data the cloud version never exposes. Traffic data stays entirely on your server, with no visitor caps or per-pageview pricing.
RisingWave
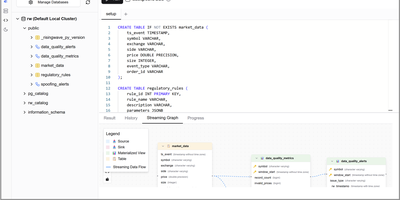
With over 9,100 GitHub stars and production deployments powering real-time analytics at companies like SHOPLINE where it reduced API latency by 76.7%, RisingWave is the PostgreSQL-compatible streaming database that collapses the traditional Debezium-plus-Kafka-plus-Flink-plus-serving-database stack into a single Rust-powered system. The platform continuously ingests data from PostgreSQL and MySQL via native CDC connectors that eliminate Debezium middleware, consumes Kafka, Redpanda, Pulsar, and Kinesis topics, accepts webhook events from SaaS applications, and batch-loads historical data from S3 and data warehouses. Standard SQL defines sources, materialized views, and sinks — no new DSL, no Java, and no custom API — while the PostgreSQL wire protocol means psql, DBeaver, pgAdmin, Grafana, Metabase, Superset, Tableau, and every PostgreSQL client library works without modification. Materialized views are incrementally maintained as events arrive, delivering point lookups in single-digit milliseconds without recomputing aggregates from scratch. For long-term retention, RisingWave writes to Apache Iceberg tables with a hosted REST catalog and automated table maintenance including compaction, small-file optimization, and snapshot cleanup, with data queryable by Spark, Trino, DuckDB, and DataFusion. The disaggregated compute-storage architecture uses S3-based state management for elastic scaling, instant failure recovery measured in seconds rather than the minutes-to-hours typical of RocksDB-based systems, and cost-efficient storage tiering. An MCP server enables AI agents to query and operate RisingWave directly. Running on a dedicated VPS on RepoCloud with guaranteed CPU, RAM, and SSD, full root SSH access, and a browser serial console. Apache 2.0 licensed.
Grafana
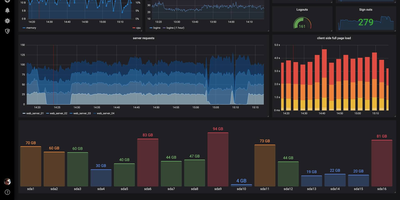
The de facto dashboard of observability: Grafana is the open-source frontend that turns the data stores you already run into interactive graphs. It does not store metrics itself; it connects to the data stores you already run and turns their contents into interactive dashboards. Supported sources number over 150 via plugins: Prometheus, Loki, Tempo, InfluxDB, Elasticsearch, MySQL, PostgreSQL, Microsoft SQL Server, AWS CloudWatch, Azure Monitor, Google Cloud Monitoring, and many more. Dashboards are built from a large library of panel types (time series, heatmaps, tables, gauges, logs) with template variables for reusable, parameterized views. Unified alerting evaluates rules against any connected data source, not just Prometheus, and routes notifications to Slack, PagerDuty, email, and other channels with grouping and silencing - unlike Prometheus Alertmanager, a single rule can combine a Loki log pattern, a PostgreSQL query result, and a CloudWatch metric. Dashboards serialize to JSON and data sources configure via provisioning files, so the entire observability setup can live in Git and deploy repeatably across environments. Explore mode adds ad-hoc querying outside dashboards, with split view for correlating a metric spike against the matching log lines, and access control spans organizations, teams, folder permissions, and OAuth, LDAP, and SAML integration. Written in Go and TypeScript, AGPL-licensed. Self-hosting gives you unlimited users, dashboards, and queries at flat hosting cost, without Grafana Cloud's usage-based pricing.
GoAccess
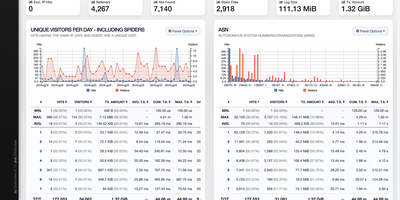
GoAccess processes millions of web log entries in seconds and renders the results as interactive dashboards that update every 200 milliseconds in the terminal or every second via WebSocket-connected HTML reports. Written entirely in C with only ncurses as a dependency, it achieves exceptional performance even on resource-constrained servers, reducing memory usage by approximately 20% and parsing time by 35% in recent releases through optimized in-memory hash tables with on-disk persistence support. The analyzer parses virtually every web log format out of the box (Apache Combined and Common, Nginx, Amazon CloudFront, Amazon S3, AWS Elastic Load Balancing, Google Cloud Storage, Squid, W3C IIS, Caddy JSON, and Traefik) while supporting fully custom log format strings for non-standard configurations. The self-contained HTML dashboard displays 15+ interactive panels covering unique visitors, requested files, static files, 404 errors, referring sites, search keyphrases, geographic location with city-level GeoIP resolution, operating systems, browsers, HTTP status codes, time distribution, and virtual host metrics. WebSocket authentication via JWT provides secure remote access, and incremental log processing ensures data continuity across daemon restarts. Docker deployment requires a single command with volume-mapped access logs. Over 20,800 stars with active development since 2010. Running on a dedicated VPS on RepoCloud with guaranteed CPU, RAM, and SSD, full root SSH access, and a browser serial console. MIT licensed.
CubeJS
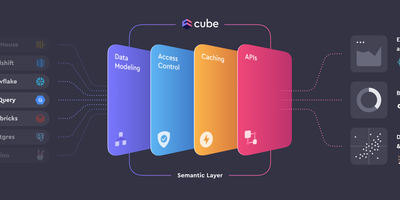
Between your databases and everything that consumes data - BI tools, embedded analytics, AI agents - sits Cube (formerly Cube.js), an open-source semantic layer. Metrics, dimensions, joins, and access rules are defined once as code in YAML, JavaScript, or Python, forming a governed data model that every downstream consumer shares, so "revenue" means the same thing in every dashboard. Caching is two-level: an in-memory cache absorbs bursts of identical queries, and declared pre-aggregations - rollup tables built in the warehouse or in Cube Store, Cube's distributed columnar engine, and refreshed in the background - deliver sub-second latency while cutting warehouse compute costs. The query planner routes each request to cache, rollup, or source automatically. Consumers connect through a Postgres-compatible SQL API (any tool that speaks Postgres works), plus REST, GraphQL, and a Meta API for model introspection. Row-level security and multi-tenancy are enforced in the layer itself, upstream of every client. Sources include Snowflake, BigQuery, Databricks, Postgres, MySQL, Presto, and Athena. Headless by design - bring your own UI.
GrowthBook
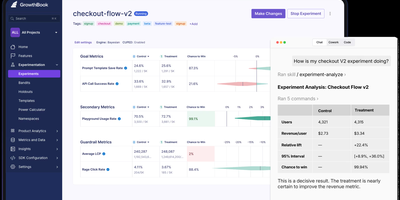
Used by over 3,000 organizations including Dropbox, Khan Academy, Sony, Pepsi, Wikipedia, and Mistral, GrowthBook is the open-source experimentation platform that handles over 100 billion feature flag evaluations daily across its cloud and self-hosted deployments. Feature flags support advanced targeting with user attributes, gradual percentage rollouts, prerequisite dependencies, and scheduled launches, with both client and server SDKs evaluating flags locally from a cached payload for sub-millisecond performance with zero network calls per check. The warehouse-native architecture queries experiment results directly from 11 data sources including BigQuery, Snowflake, Databricks, Redshift, ClickHouse, Mixpanel, and PostgreSQL, eliminating duplicate data pipelines. The statistics engine implements CUPED variance reduction, sequential testing, Bayesian analysis, post-stratification, multi-armed bandits, and sample ratio mismatch checks with fully open-source methodology. Product analytics provides dashboards with funnels, retention cohorts, and event-based tracking shareable across teams. Twenty-four SDKs cover React, Next.js, Node.js, Python, Go, Ruby, PHP, Java/Kotlin, Swift, C#/.NET, Rust, Elixir, Angular, and edge runtimes including Cloudflare Workers, Fastly Compute, and Lambda@Edge. The MCP server and REST API enable AI coding agents to create features, start experiments, and manage stale flags programmatically. Self-hosting deploys via Docker Compose with MongoDB, or via Helm charts on Kubernetes, with the same codebase powering both open-source and managed cloud offerings. Running on a dedicated VPS on RepoCloud with guaranteed CPU, RAM, and SSD, full root SSH access, and a browser serial console. MIT licensed.
Mage
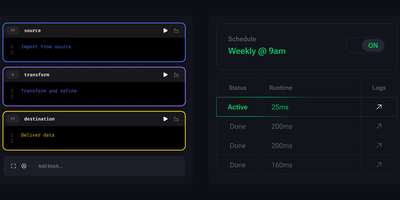
Backed by 8,700+ GitHub stars and designed as a modern alternative to Apache Airflow, Mage delivers the open-source data pipeline platform that combines the interactive flexibility of notebooks with production-grade orchestration in a single self-hosted environment accessible at port 6789. The modular block architecture lets data engineers compose pipelines from Python, SQL, and R code blocks with instant data previews, live execution logs, and visual debugging at each step. Over 100 prebuilt integrations connect sources and destinations including PostgreSQL, MySQL, Snowflake, BigQuery, Redshift, S3, Kafka, MongoDB, Amplitude, Salesforce, and Stripe with parallel stream synchronization for high-throughput data movement. Batch pipelines run on cron schedules or event triggers while streaming pipelines process real-time data from Kafka, Kinesis, and RabbitMQ with stream mode reducing memory usage by approximately 90 percent compared to batch processing. Native dbt integration builds, tests, and runs dbt models directly inside the pipeline editor alongside custom transformation blocks. Spark, Snowpark, and Databricks runtimes handle large-scale distributed processing. AI-assisted development generates code, fixes errors, and optimizes queries within the notebook interface. Monitoring dashboards track pipeline health with integrations to Datadog, Prometheus, New Relic, and OpenTelemetry. Terraform templates deploy production environments to AWS, GCP, or Azure with two commands, while Helm charts support Kubernetes clusters. Running on a dedicated VPS on RepoCloud with guaranteed CPU, RAM, and SSD, full root SSH access, and a browser serial console. Apache 2.0 licensed.
Redash
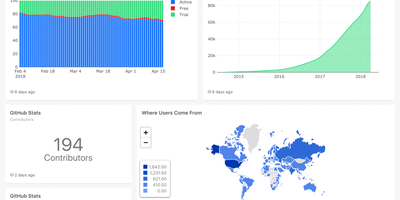
Used by millions of users at thousands of organizations worldwide and holding 29,000+ GitHub stars, Redash is the most established open-source SQL-first business intelligence tool — enabling anyone from analysts to executives to query databases, visualize results, and share dashboards without writing a single line of application code. The browser-based query editor supports SQL and NoSQL with schema browsing, auto-complete, query snippets, and parameterized queries that turn static reports into interactive data applications. Native connectors span 35+ data sources including PostgreSQL, MySQL, Amazon Redshift, Google BigQuery, Snowflake, ClickHouse, MongoDB, Elasticsearch, Databricks, Apache Presto, Microsoft SQL Server, and REST APIs — with an extensible data source API for custom integrations. Visualization types cover line, bar, area, pie, scatter, box plot, funnel, cohort, sankey, sunburst, choropleth map, and pivot tables, all draggable onto shared dashboards with cross-filtering parameters. Scheduled refreshes automatically update query results at configurable intervals, while threshold-based alerts notify teams via email, Slack, or webhook when metrics cross defined boundaries. SAML and Google OAuth SSO integration, role-based access control, API key management, and query-level permissions ensure enterprise-grade security for sensitive datasets. The self-hosted stack deploys via Docker Compose with PostgreSQL for metadata storage, Redis for job queuing, and Celery workers for background task execution. Running on a dedicated VPS on RepoCloud with guaranteed CPU, RAM, and SSD, full root SSH access, and a browser serial console. BSD 2-Clause licensed.

Social Analyzer
Social Analyzer scans over 1,000 social media platforms in parallel to discover and correlate user profiles from a single username query, making it the most comprehensive OSINT reconnaissance tool of its kind. Three detection modes cover different accuracy and speed tradeoffs: fast HTTP library checks for rapid sweeps, Selenium WebDriver validation for JavaScript-heavy sites, and a special mode for stubborn edge cases. String analysis generates username permutations and combinations to catch related accounts with slight naming variations. Three interfaces serve different workflows: a Node.js web application on port 9005 with a browser-based GUI, a CLI for scripted batch operations, and Python plus Node.js APIs for embedding into automated investigation pipelines. The QeeqBox OSINT library extracts profile metadata, screenshots, titles, descriptions, and activity patterns, all visualized through Ixora-based force-directed graphs that map relationships between discovered accounts. Tesseract OCR analyzes profile images for additional detection vectors. Search results narrow by country codes, website categories, Alexa ranking thresholds, and confidence levels. Optional Google API and DuckDuckGo API integration adds search engine correlation alongside direct platform queries. Docker deployment bundles Node.js, Firefox ESR, Tesseract, and all dependencies into one container. Trusted by law enforcement and security researchers for digital forensics and identity verification. 23,000+ GitHub stars. AGPL-3.0 licensed.
Temps
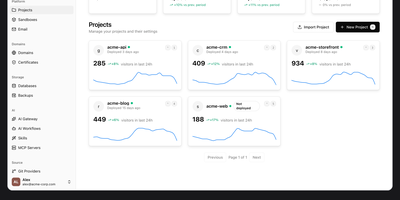
Consolidate application hosting, web analytics, error tracking, and performance monitoring into Temps, an open-source developer platform that replaces disparate SaaS subscriptions with a single compiled Rust binary. Engineering teams deploy full-stack web applications, background daemons, and microservices directly from Git repositories with automated TLS certificate provisioning powered by an embedded Cloudflare Pingora reverse proxy. The centralized web console unifies real-time visitor analytics, conversion funnels, and rrweb-powered session replay recordings without third-party tracking scripts. Integrated error monitoring ingests runtime exceptions with full stack traces and source map resolution, while continuous health checks evaluate container CPU utilization, memory thresholds, and network throughput across custom alerting rules. Developers manage infrastructure through an extensive command line interface containing over 440 operations across 69 command groups, or deploy drop-in skill files that allow AI coding assistants like Claude Code and Codex to provision preview environments autonomously. The platform also provides serverless key-value storage, S3-compatible blob buckets, and native transactional email routing with custom DKIM validation. Running on a dedicated VPS on RepoCloud with guaranteed CPU, RAM, and SSD, full root SSH access, and a browser serial console. Apache 2.0 licensed.